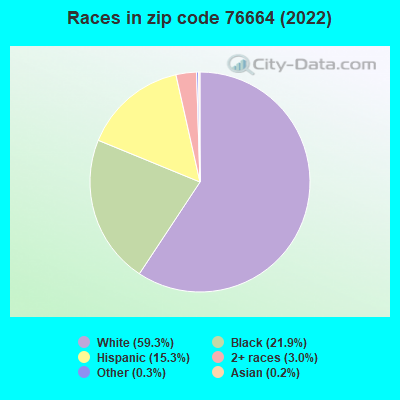
Estimated zip code population in 2022: 3,797 Zip code population in 2010: 3,514 Zip code population in 2000: 3,411
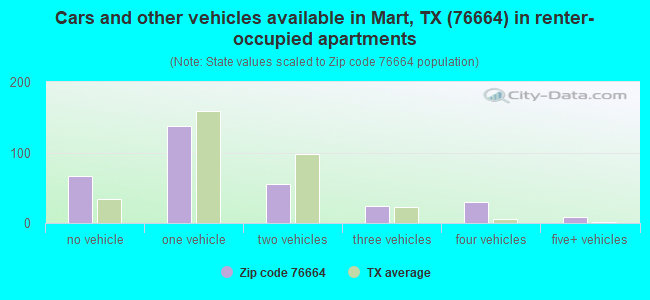
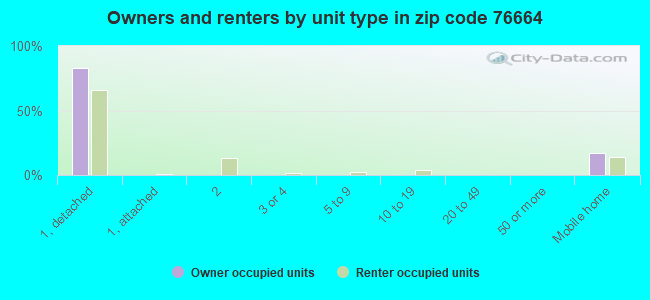
Houses and condos: 1,422 Renter-occupied apartments: 320
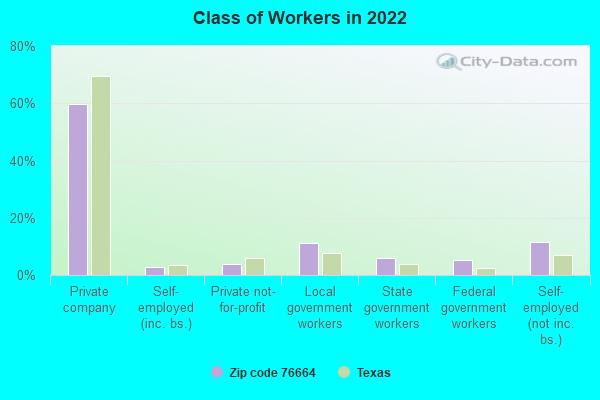
% of renters here:
25%
State:
38%
March 2022 cost of living index in zip code 76664: 78.8 (low, U.S. average is 100)
Land area: 135.0 sq. mi. Water area: 1.2 sq. mi.
Population density: 28 people per square mile
(very low).
OSM Map
General Map
Google Map
MSN Map
OSM Map
General Map
Google Map
MSN Map
OSM Map
General Map
Google Map
MSN Map
OSM Map
General Map
Google Map
MSN Map
Please wait while loading the map...
Real estate property taxes paid for housing units in 2022:
This zip code:
1.4% ($1,949)
Texas:
1.5% ($4,050)
Median real estate property taxes paid for housing units with mortgages in 2022: $2,422 (1.6%) Median real estate property taxes paid for housing units with no mortgage in 2022: $1,543 (1.2%)
Averages for the 2020 tax year for zip code 76664, filed in 2021:
Average Adjusted Gross Income (AGI) in 2020: $49,247 (Individual Income Tax Returns)
Here:
$49,247
State:
$77,054
Salary/wage: $44,091 (reported on 83.2% of returns)
Here:
$44,091
State:
$62,766
(% of AGI for various income ranges: 1136.1% for AGIs below $25k, 3489.1% for AGIs $25k-50k, 6529.3% for AGIs $50k-75k, 9196.2% for AGIs $75k-100k, 21612.5% for AGIs $100k-200k)
Taxable interest for individuals: $464 (reported on 26.3% of returns)
This zip code:
$464
Texas:
$2,665
(% of AGI for various income ranges: 7.6% for AGIs below $25k, 9.4% for AGIs $25k-50k, 9.3% for AGIs $50k-75k, 33.8% for AGIs $75k-100k, 81.2% for AGIs $100k-200k)
Ordinary dividends: $2,020 (reported on 7.3% of returns)
Here:
$2,020
State:
$10,044
(% of AGI for various income ranges: 24.4% for AGIs $25k-50k, 60.0% for AGIs $50k-75k, 42.5% for AGIs $100k-200k)
Net capital gain/loss in AGI: +$3,700 (reported on 8.8% of returns)
Here:
+$3,700
State:
+$39,590
(% of AGI for various income ranges: 2.2% for AGIs below $25k, 6.2% for AGIs $25k-50k, 88.0% for AGIs $50k-75k, 353.8% for AGIs $100k-200k)
Profit/loss from business: +$6,563 (reported on 13.9% of returns)
Here:
+$6,563
State:
+$10,888
(% of AGI for various income ranges: 71.5% for AGIs below $25k, 131.2% for AGIs $25k-50k, 329.3% for AGIs $50k-75k, 50.0% for AGIs $100k-200k)
Taxable individual retirement arrangement distribution: $16,688 (reported on 5.8% of returns)
76664:
$16,688
Texas:
$24,740
(% of AGI for various income ranges: 34.9% for AGIs below $25k, 99.4% for AGIs $25k-50k, 1092.5% for AGIs $75k-100k)
Total itemized deductions: $32,900 (reported on 2.2% of returns)
Here:
$32,900
State:
$40,428
(% of AGI for various income ranges: 658.0% for AGIs $50k-75k)
Taxes paid: $5,767 (reported on 2.2% of returns)
76664:
$5,767
State:
$7,821
(% of AGI for various income ranges: 115.3% for AGIs $50k-75k)
Earned income credit: $2,312 (reported on 24.8% of returns)
Here:
$2,312
State:
$2,584
(% of AGI for various income ranges: 125.4% for AGIs below $25k, 85.0% for AGIs $25k-50k)
Percentage of individuals using paid preparers for their 2020 taxes: 92.7%
Here:
93%
State:
92%
(% for various income ranges: 92.3% for AGIs below $25k, 92.3% for AGIs $25k-50k, 90.0% for AGIs $50k-75k, 100.0% for AGIs $75k-100k, 92.3% for AGIs $100k-200k, 100.0% for AGIs over 200k)
Averages for the 2012 tax year for zip code 76664, filed in 2013:
Average Adjusted Gross Income (AGI) in 2012: $40,911 (Individual Income Tax Returns)
Here:
$40,911
State:
$65,384
Salary/wage: $38,056 (reported on 83.3% of returns)
Here:
$38,056
State:
$52,524
(% of AGI for various income ranges: 79.7% for AGIs below $25k, 83.4% for AGIs $25k-50k, 82.1% for AGIs $50k-75k, 81.9% for AGIs $75k-100k, 65.6% for AGIs $100k-200k)
Taxable interest for individuals: $828 (reported on 31.0% of returns)
This zip code:
$828
Texas:
$2,372
(% of AGI for various income ranges: 1.2% for AGIs below $25k, 1.1% for AGIs $25k-50k, 0.4% for AGIs $50k-75k, 0.4% for AGIs $75k-100k, 0.3% for AGIs $100k-200k)
Ordinary dividends: $1,754 (reported on 10.3% of returns)
Here:
$1,754
State:
$9,721
(% of AGI for various income ranges: 0.6% for AGIs below $25k, 0.2% for AGIs $25k-50k, 0.8% for AGIs $50k-75k, 0.5% for AGIs $100k-200k)
Net capital gain/loss in AGI: +$1,689 (reported on 7.1% of returns)
Here:
+$1,689
State:
+$35,319
(% of AGI for various income ranges: 0.8% for AGIs $50k-75k, 0.5% for AGIs $100k-200k)
Profit/loss from business: +$7,850 (reported on 12.7% of returns)
Here:
+$7,850
State:
+$13,732
(% of AGI for various income ranges: 6.5% for AGIs below $25k, 1.6% for AGIs $25k-50k, 1.6% for AGIs $50k-75k, 5.6% for AGIs $75k-100k)
Taxable individual retirement arrangement distribution: $8,611 (reported on 7.1% of returns)
76664:
$8,611
Texas:
$19,511
(% of AGI for various income ranges: 1.8% for AGIs below $25k, 2.8% for AGIs $25k-50k, 3.9% for AGIs $75k-100k)
Total itemized deductions: $18,914 (22% of AGI, reported on 11.1% of returns)
Here:
$18,914
State:
$24,724
Here:
21.6% of AGI
State:
15.9% of AGI
(% of AGI for various income ranges: 4.2% for AGIs $25k-50k, 4.6% for AGIs $50k-75k, 9.1% for AGIs $75k-100k, 6.6% for AGIs $100k-200k)
Charity contributions: $3,889 (reported on 7.1% of returns)
Here:
$3,889
State:
$6,808
(% of AGI for various income ranges: 0.7% for AGIs below $25k, 0.6% for AGIs $50k-75k, 0.9% for AGIs $75k-100k, 1.2% for AGIs $100k-200k)
Taxes paid: $3,543 (reported on 11.1% of returns)
76664:
$3,543
State:
$6,921
(% of AGI for various income ranges: 0.8% for AGIs $25k-50k, 0.9% for AGIs $50k-75k, 1.6% for AGIs $75k-100k, 1.3% for AGIs $100k-200k)
Earned income credit: $2,453 (reported on 28.6% of returns)
Here:
$2,453
State:
$2,570
(% of AGI for various income ranges: 9.3% for AGIs below $25k, 1.9% for AGIs $25k-50k)
Percentage of individuals using paid preparers for their 2012 taxes: 51.6%
Here:
52%
State:
51%
(% for various income ranges: 50.9% for AGIs below $25k, 50.0% for AGIs $25k-50k, 52.9% for AGIs $50k-75k, 55.6% for AGIs $75k-100k, 55.6% for AGIs $100k-200k)
Averages for the 2004 tax year for zip code 76664, filed in 2005:
Average Adjusted Gross Income (AGI) in 2004: $32,021 (Individual Income Tax Returns)
Here:
$32,021
State:
$47,881
Salary/wage: $30,522 (reported on 85.5% of returns)
Here:
$30,522
State:
$41,947
(% of AGI for various income ranges: 92.8% for AGIs below $10k, 82.1% for AGIs $10k-25k, 86.1% for AGIs $25k-50k, 86.2% for AGIs $50k-75k, 79.4% for AGIs $75k-100k, 66.6% for AGIs over 100k)
Taxable interest for individuals: $1,533 (reported on 33.9% of returns)
This zip code:
$1,533
Texas:
$2,255
(% of AGI for various income ranges: 3.8% for AGIs below $10k, 1.7% for AGIs $10k-25k, 1.6% for AGIs $25k-50k, 1.0% for AGIs $50k-75k, 1.1% for AGIs $75k-100k, 2.4% for AGIs over 100k)
Taxable dividends: $1,706 (reported on 11.0% of returns)
Here:
$1,706
State:
$4,261
(% of AGI for various income ranges: 2.1% for AGIs below $10k, 0.4% for AGIs $10k-25k, 0.4% for AGIs $25k-50k, 0.1% for AGIs $50k-75k, 0.1% for AGIs $75k-100k, 1.8% for AGIs over 100k)
Net capital gain/loss: +$2,140 (reported on 10.5% of returns)
Here:
+$2,140
State:
+$16,110
(% of AGI for various income ranges: -1.0% for AGIs below $10k, 0.7% for AGIs $10k-25k, 0.3% for AGIs $25k-50k, 0.9% for AGIs $50k-75k, 0.1% for AGIs $75k-100k, 1.9% for AGIs over 100k)
Profit/loss from business: +$5,285 (reported on 11.7% of returns)
Here:
+$5,285
State:
+$11,013
(% of AGI for various income ranges: -2.4% for AGIs below $10k, -0.2% for AGIs $10k-25k, 1.3% for AGIs $25k-50k, 0.0% for AGIs $50k-75k, 12.9% for AGIs $75k-100k)
IRA payment deduction: $2,500 (reported on 1.2% of returns)
76664:
$2,500
Texas:
$3,120
Total itemized deductions: $14,812 (20% of AGI, reported on 9.9% of returns)
Here:
$14,812
State:
$19,631
Here:
20.4% of AGI
State:
18.9% of AGI
(% of AGI for various income ranges: 2.6% for AGIs $10k-25k, 4.4% for AGIs $25k-50k, 4.4% for AGIs $50k-75k, 7.3% for AGIs $75k-100k, 5.8% for AGIs over 100k)
Charity contributions deductions: $4,000 (5% of AGI, reported on 7.7% of returns)
Here:
$4,000
State:
$4,753
Here:
5.1% of AGI
State:
4.2% of AGI
(% of AGI for various income ranges: 0.9% for AGIs $25k-50k, 0.8% for AGIs $50k-75k, 1.7% for AGIs $75k-100k, 1.9% for AGIs over 100k)
Total tax: $4,284 (reported on 65.7% of returns)
76664:
$4,284
State:
$9,058
(% of AGI for various income ranges: 1.9% for AGIs below $10k, 3.4% for AGIs $10k-25k, 5.9% for AGIs $25k-50k, 8.5% for AGIs $50k-75k, 11.2% for AGIs $75k-100k, 18.6% for AGIs over 100k)
Earned income credit: $2,017 (reported on 27.5% of returns)
Here:
$2,017
State:
$2,024
Percentage of individuals using paid preparers for their 2004 taxes: 54.8%
Here:
55%
State:
57%
(% for various income ranges: 50.0% for AGIs below $10k, 59.4% for AGIs $10k-25k, 52.8% for AGIs $25k-50k, 51.6% for AGIs $50k-75k, 55.6% for AGIs $75k-100k, 70.2% for AGIs over 100k)
Household received Food Stamps/SNAP in the past 12 months: 201 Household did not receive Food Stamps/SNAP in the past 12 months: 1,085
Women who had a birth in the past 12 months: 29 (8 now married, 20 unmarried) Women who did not have a birth in the past 12 months: 691 (334 now married, 356 unmarried)
Housing units in zip code 76664 with a mortgage: 352 (3 second mortgage, 3 both second mortgage and home equity loan) Median monthly owner costs for units with a mortgage: $1,349 Median monthly owner costs for units without a mortgage: $570
Residents with income below the poverty level in 2022:
This zip code:
17.9%
Whole state:
14.0%
Residents with income below 50% of the poverty level in 2022:
This zip code:
10.4%
Whole state:
7.4%
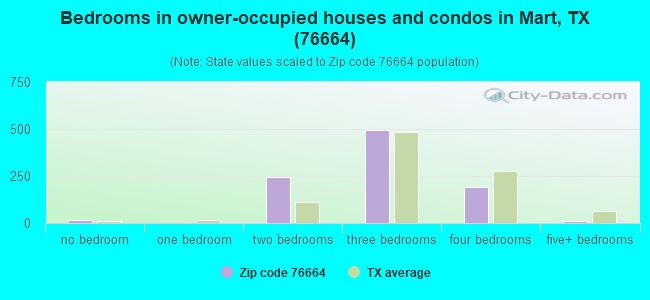
Median number of rooms in houses and condos:
Here:
6.2
State:
6.3
Median number of rooms in apartments:
Here:
5.1
State:
4.0
Notable locations in this zip code not listed on our city pages
Churches in zip code 76664 include: Criswell Church (A), Mount Zion Baptist Church (B), Mount Pleasant Baptist Church (C), First Baptist Church of Mart (D), Saint Marys Baptist Church (E), North Side Church of Christ (F), Church of Christ of Mart (G). Display/hide their locations on the map
Cemeteries: Pavelka Cemetery (1), Evergreen Cemetery (2), Lone Oak Cemetery (3), Wise Cemetery (4), Oklahoma Cemetery (5), Nus Cemetery (6). Display/hide their locations on the map
In group quarters: 275 (-1 institutionalized population)
Size of family households: 401 2-persons, 257 3-persons, 109 4-persons, 119 5-persons, 43 6-persons, 25 7-or-more-persons
Size of nonfamily households: 288 1-person, 32 2-persons, 5 3-persons
389 married couples with children.
329 single-parent households (62 men, 267 women).
91.9% of residents of 76664 zip code speak English at home.
7.9% of residents speak Spanish at home (81% very well, 7% well, 4% not well, 8% not at all).
0.2% of residents speak other Indo-European language at home (100% very well).
0.1% of residents speak Asian or Pacific Island language at home (100% well).
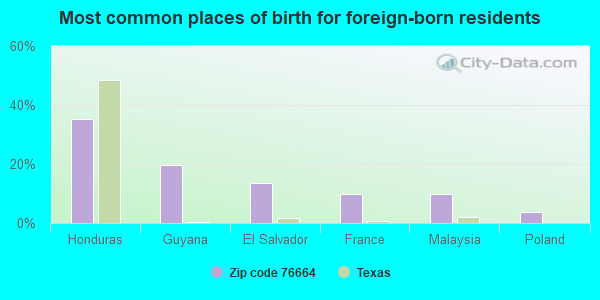
Foreign born population: 82 (2.2%) (37.5% of them are naturalized citizens)
This zip code:
2.2%
Whole state:
17.2%
35%Honduras
20%Guyana
13%El Salvador
10%France
10%Malaysia
4%Poland
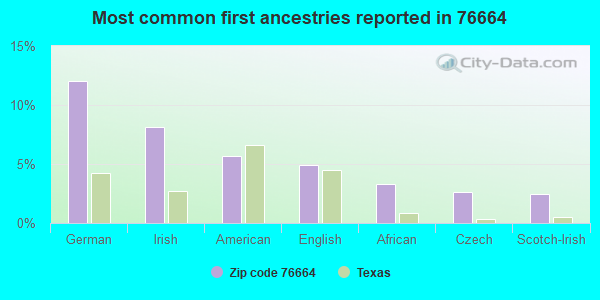
12%German
8%Irish
6%American
5%English
3%African
3%Czech
2%Scotch-Irish
Year of entry for the foreign-born population
292010 or later
172000 to 2009
181990 to 1999
28Before 1990
Housing units lacking complete plumbing facilities: 3.6% Housing units lacking complete kitchen facilities: 3.5%
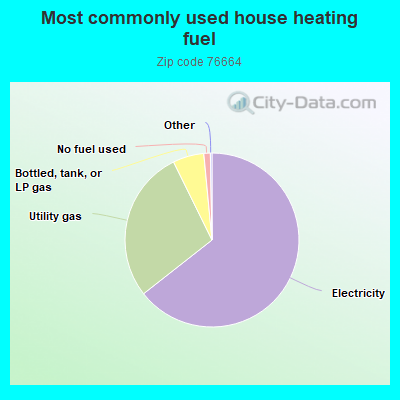
64.6%Electricity
28.4%Utility gas
5.8%Bottled, tank, or LP gas
1.2%No fuel used
Population in 1990: 2,588. Population change in the 1990s: +823 (+31.8%).
Place of birth for U.S.-born residents:
This state: 3,004
Northeast: 74
Midwest: 244
South: 186
West: 168
58% of the 76664 zip code residents lived in the same house 5 years ago. Out of people who lived in different houses, 60% lived in this county. Out of people who lived in different counties, 50% lived in Texas.
93% of the 76664 zip code residents lived in the same house 1 year ago. Out of people who lived in different houses, 67% moved from this county. Out of people who lived in different houses, 24% moved from different county within same state. Out of people who lived in different houses, 8% moved from different state.
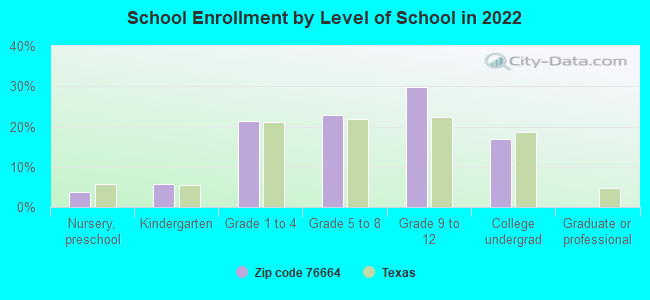
Private vs. public school enrollment:
Students in private schools in grades 1 to 8 (elementary and middle school): 14
Here:
3.1%
Texas:
8.8%
Students in private schools in grades 9 to 12 (high school): 51
Here:
16.2%
Texas:
8.0%
Students in private undergraduate colleges: 3
Here:
2.2%
Texas:
16.2%
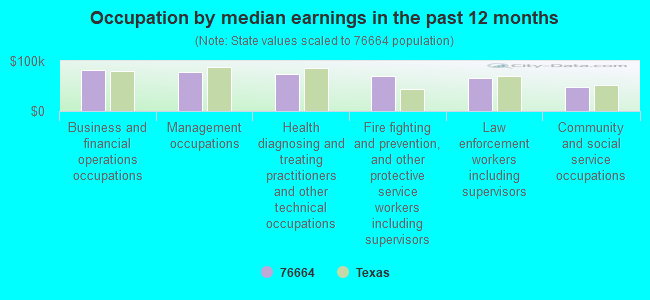
Occupation by median earnings in the past 12 months ($)
82,753Business and financial operations occupations
77,506Management occupations
73,537Health diagnosing and treating practitioners and other technical occupations
70,556Fire fighting and prevention, and other protective service workers including supervisors
65,256Law enforcement workers including supervisors
47,961Community and social service occupations
Top industries in this zip code by the number of employees in 2005:
Health Care and Social Assistance: Nursing Care Facilities (50-99 employees: 1 establishment, 1-4 employees: 1 establishment)
Finance and Insurance: Commercial Banking (20-49: 1, 10-19: 1)
Utilities: Electric Power Distribution (20-49: 1)
Accommodation and Food Services: Limited-Service Restaurants (10-19: 1, 1-4: 2)
Arts, Entertainment, and Recreation: Golf Courses and Country Clubs (10-19: 1)
Accommodation and Food Services: Food Service Contractors (10-19: 1)
Other Services (except Public Administration): Religious Organizations (5-9: 2)
Accommodation and Food Services: Full-Service Restaurants (5-9: 1, 1-4: 1)
People in group quarters in 2010:
312 people in correctional facilities intended for juveniles
45 people in nursing facilities/skilled-nursing facilities
8 people in workers' group living quarters and job corps centers
People in group quarters in 2000:
84 people in nursing homes
84 people in homes for abused, dependent, and neglected children
Fatal accident statistics in 2013:
Fatal accident count: 1
Vehicles involved in fatal accidents: 1
Fatal accidents caused by drunken drivers: 0
Fatalities: 1
Persons involved in fatal accidents: 1
Pedestrians involved in fatal accidents: 1
Fatal accident statistics in 2012:
Fatal accident count: 1
Vehicles involved in fatal accidents: 1
Fatal accidents caused by drunken drivers: 1
Fatalities: 1
Persons involved in fatal accidents: 1
Pedestrians involved in fatal accidents: 0
Home Mortgage Disclosure Act Aggregated Statistics For Year 2009 (Based on 2 partial tracts)
A) FHA, FSA/RHS & VA Home Purchase Loans
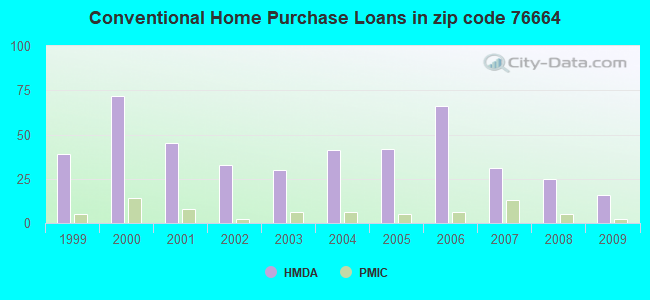
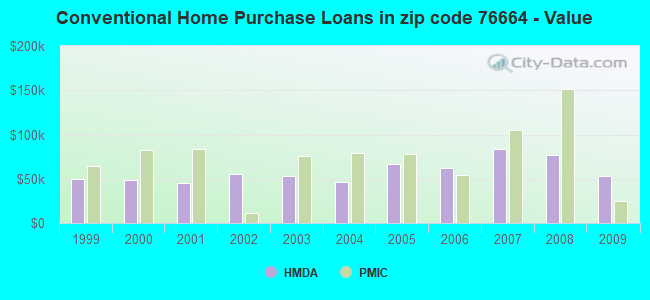
B) Conventional Home Purchase Loans
C) Refinancings
D) Home Improvement Loans
F) Non-occupant Loans on < 5 Family Dwellings (A B C & D)
G) Loans On Manufactured Home Dwelling (A B C & D)
Number
Average Value
Number
Average Value
Number
Average Value
Number
Average Value
Number
Average Value
Number
Average Value
LOANS ORIGINATED
8
$98,665
16
$53,435
20
$141,217
5
$22,820
8
$33,605
2
$37,510
APPLICATIONS APPROVED, NOT ACCEPTED
0
$0
2
$71,900
8
$91,826
2
$4,690
0
$0
0
$0
APPLICATIONS DENIED
2
$47,670
9
$45,674
13
$143,916
5
$22,194
3
$66,687
5
$58,768
APPLICATIONS WITHDRAWN
0
$0
0
$0
9
$159,600
2
$150,050
0
$0
0
$0
FILES CLOSED FOR INCOMPLETENESS
0
$0
0
$0
0
$0
0
$0
0
$0
0
$0
Aggregated Statistics For Year 2008 (Based on 2 partial tracts)
A) FHA, FSA/RHS & VA Home Purchase Loans
B) Conventional Home Purchase Loans
C) Refinancings
D) Home Improvement Loans
F) Non-occupant Loans on < 5 Family Dwellings (A B C & D)
G) Loans On Manufactured Home Dwelling (A B C & D)
Number
Average Value
Number
Average Value
Number
Average Value
Number
Average Value
Number
Average Value
Number
Average Value
LOANS ORIGINATED
14
$90,431
25
$76,712
19
$107,929
9
$32,129
11
$31,118
3
$64,603
APPLICATIONS APPROVED, NOT ACCEPTED
0
$0
0
$0
2
$96,125
3
$125,040
0
$0
0
$0
APPLICATIONS DENIED
0
$0
9
$52,273
20
$55,643
20
$15,708
2
$11,725
8
$53,729
APPLICATIONS WITHDRAWN
2
$50,800
0
$0
11
$109,836
5
$36,574
0
$0
0
$0
FILES CLOSED FOR INCOMPLETENESS
0
$0
0
$0
0
$0
0
$0
0
$0
0
$0
Aggregated Statistics For Year 2007 (Based on 2 partial tracts)
A) FHA, FSA/RHS & VA Home Purchase Loans
B) Conventional Home Purchase Loans
C) Refinancings
D) Home Improvement Loans
F) Non-occupant Loans on < 5 Family Dwellings (A B C & D)
G) Loans On Manufactured Home Dwelling (A B C & D)
Number
Average Value
Number
Average Value
Number
Average Value
Number
Average Value
Number
Average Value
Number
Average Value
LOANS ORIGINATED
8
$73,461
31
$84,049
28
$103,884
14
$25,343
3
$97,427
8
$39,661
APPLICATIONS APPROVED, NOT ACCEPTED
0
$0
6
$53,142
9
$81,450
2
$9,380
0
$0
5
$50,328
APPLICATIONS DENIED
3
$91,177
23
$68,364
55
$103,016
27
$46,253
2
$50,800
9
$52,969
APPLICATIONS WITHDRAWN
0
$0
3
$143,277
27
$94,070
3
$54,183
3
$67,730
2
$23,445
FILES CLOSED FOR INCOMPLETENESS
0
$0
0
$0
5
$101,908
0
$0
0
$0
0
$0
Aggregated Statistics For Year 2006 (Based on 2 partial tracts)
A) FHA, FSA/RHS & VA Home Purchase Loans
B) Conventional Home Purchase Loans
C) Refinancings
D) Home Improvement Loans
F) Non-occupant Loans on < 5 Family Dwellings (A B C & D)
G) Loans On Manufactured Home Dwelling (A B C & D)
Number
Average Value
Number
Average Value
Number
Average Value
Number
Average Value
Number
Average Value
Number
Average Value
LOANS ORIGINATED
8
$79,712
66
$62,117
22
$91,435
17
$28,778
19
$33,234
8
$41,224
APPLICATIONS APPROVED, NOT ACCEPTED
2
$41,420
6
$64,083
3
$106,283
0
$0
3
$20,840
2
$44,545
APPLICATIONS DENIED
2
$39,855
28
$58,501
30
$68,720
28
$25,064
8
$44,350
20
$55,017
APPLICATIONS WITHDRAWN
2
$57,050
9
$56,442
23
$79,033
6
$45,327
3
$33,867
0
$0
FILES CLOSED FOR INCOMPLETENESS
0
$0
2
$27,355
2
$92,215
0
$0
0
$0
2
$27,355
Aggregated Statistics For Year 2005 (Based on 2 partial tracts)
A) FHA, FSA/RHS & VA Home Purchase Loans
B) Conventional Home Purchase Loans
C) Refinancings
D) Home Improvement Loans
F) Non-occupant Loans on < 5 Family Dwellings (A B C & D)
G) Loans On Manufactured Home Dwelling (A B C & D)
Number
Average Value
Number
Average Value
Number
Average Value
Number
Average Value
Number
Average Value
Number
Average Value
LOANS ORIGINATED
11
$53,995
42
$66,614
36
$70,552
8
$37,708
14
$24,561
6
$60,697
APPLICATIONS APPROVED, NOT ACCEPTED
0
$0
8
$98,860
8
$77,564
2
$7,035
2
$60,175
6
$46,630
APPLICATIONS DENIED
0
$0
30
$51,162
41
$61,605
14
$41,308
3
$56,267
20
$49,860
APPLICATIONS WITHDRAWN
0
$0
11
$71,472
31
$100,738
2
$162,550
0
$0
2
$36,730
FILES CLOSED FOR INCOMPLETENESS
0
$0
6
$129,990
6
$131,032
0
$0
0
$0
0
$0
Aggregated Statistics For Year 2004 (Based on 2 partial tracts)
A) FHA, FSA/RHS & VA Home Purchase Loans
B) Conventional Home Purchase Loans
C) Refinancings
D) Home Improvement Loans
F) Non-occupant Loans on < 5 Family Dwellings (A B C & D)
G) Loans On Manufactured Home Dwelling (A B C & D)
Number
Average Value
Number
Average Value
Number
Average Value
Number
Average Value
Number
Average Value
Number
Average Value
LOANS ORIGINATED
9
$83,533
41
$46,356
45
$67,348
19
$70,171
11
$18,330
6
$42,722
APPLICATIONS APPROVED, NOT ACCEPTED
3
$59,393
6
$56,268
8
$62,325
2
$16,410
0
$0
6
$35,948
APPLICATIONS DENIED
2
$113,320
13
$53,984
41
$61,071
13
$35,108
2
$37,510
5
$48,454
APPLICATIONS WITHDRAWN
2
$123,475
3
$115,663
25
$69,397
2
$37,510
2
$62,520
2
$53,925
FILES CLOSED FOR INCOMPLETENESS
2
$46,110
2
$46,890
13
$97,628
2
$42,985
0
$0
0
$0
Aggregated Statistics For Year 2003 (Based on 2 partial tracts)
A) FHA, FSA/RHS & VA Home Purchase Loans
B) Conventional Home Purchase Loans
C) Refinancings
D) Home Improvement Loans
F) Non-occupant Loans on < 5 Family Dwellings (A B C & D)
Number
Average Value
Number
Average Value
Number
Average Value
Number
Average Value
Number
Average Value
LOANS ORIGINATED
13
$71,417
30
$52,934
67
$71,385
9
$30,044
13
$32,703
APPLICATIONS APPROVED, NOT ACCEPTED
2
$60,955
3
$42,723
6
$52,360
3
$31,260
0
$0
APPLICATIONS DENIED
3
$56,267
22
$49,305
56
$71,563
8
$11,918
3
$104,200
APPLICATIONS WITHDRAWN
2
$42,985
5
$66,896
23
$69,248
2
$14,065
0
$0
FILES CLOSED FOR INCOMPLETENESS
0
$0
0
$0
0
$0
2
$21,880
0
$0
Aggregated Statistics For Year 2002 (Based on 2 partial tracts)
A) FHA, FSA/RHS & VA Home Purchase Loans
B) Conventional Home Purchase Loans
C) Refinancings
D) Home Improvement Loans
F) Non-occupant Loans on < 5 Family Dwellings (A B C & D)
Number
Average Value
Number
Average Value
Number
Average Value
Number
Average Value
Number
Average Value
LOANS ORIGINATED
9
$68,251
33
$55,605
59
$73,037
13
$25,729
16
$27,450
APPLICATIONS APPROVED, NOT ACCEPTED
2
$43,765
6
$38,033
6
$84,923
5
$26,572
0
$0
APPLICATIONS DENIED
2
$66,430
13
$47,732
25
$54,017
16
$36,731
2
$7,035
APPLICATIONS WITHDRAWN
3
$57,310
3
$93,780
17
$40,730
5
$16,256
0
$0
FILES CLOSED FOR INCOMPLETENESS
2
$50,015
2
$59,395
0
$0
0
$0
0
$0
Aggregated Statistics For Year 2001 (Based on 2 partial tracts)
A) FHA, FSA/RHS & VA Home Purchase Loans
B) Conventional Home Purchase Loans
C) Refinancings
D) Home Improvement Loans
F) Non-occupant Loans on < 5 Family Dwellings (A B C & D)
Number
Average Value
Number
Average Value
Number
Average Value
Number
Average Value
Number
Average Value
LOANS ORIGINATED
14
$56,268
45
$45,570
48
$62,260
19
$16,288
30
$17,506
APPLICATIONS APPROVED, NOT ACCEPTED
0
$0
11
$53,853
9
$42,374
2
$60,955
2
$32,825
APPLICATIONS DENIED
0
$0
53
$38,131
30
$55,434
17
$11,033
5
$30,010
APPLICATIONS WITHDRAWN
0
$0
8
$60,371
20
$41,420
3
$35,950
0
$0
FILES CLOSED FOR INCOMPLETENESS
0
$0
0
$0
5
$50,016
0
$0
0
$0
Aggregated Statistics For Year 2000 (Based on 2 partial tracts)
A) FHA, FSA/RHS & VA Home Purchase Loans
B) Conventional Home Purchase Loans
C) Refinancings
D) Home Improvement Loans
F) Non-occupant Loans on < 5 Family Dwellings (A B C & D)
Number
Average Value
Number
Average Value
Number
Average Value
Number
Average Value
Number
Average Value
LOANS ORIGINATED
13
$73,100
72
$48,062
19
$42,859
13
$14,308
22
$23,161
APPLICATIONS APPROVED, NOT ACCEPTED
0
$0
8
$65,646
2
$43,765
0
$0
0
$0
APPLICATIONS DENIED
2
$22,665
42
$47,746
5
$49,390
16
$17,681
2
$86,745
APPLICATIONS WITHDRAWN
3
$103,157
2
$35,170
6
$35,168
0
$0
0
$0
FILES CLOSED FOR INCOMPLETENESS
0
$0
6
$80,755
6
$41,158
0
$0
5
$69,710
Aggregated Statistics For Year 1999 (Based on 1 partial tract)
A) FHA, FSA/RHS & VA Home Purchase Loans
B) Conventional Home Purchase Loans
C) Refinancings
D) Home Improvement Loans
F) Non-occupant Loans on < 5 Family Dwellings (A B C & D)
Detailed PMIC statistics for the following Tracts:0036.01
2002 - 2018 National Fire Incident Reporting System (NFIRS) incidents
According to the data from the years 2002 - 2018 the average number of fire incidents per year is 11. The highest number of reported fire incidents - 59 took place in 2002, and the least - 0 in 2015. The data has a declining trend.
When looking into fire subcategories, the most reports belonged to: Outside Fires (55.9%), and Structure Fires (27.9%).
Fire incident types reported to NFIRS in Zip Code 76664


 Nearest zip codes: 76678, 76682, 76624, 76635, 76673, 76661.


 According to the data from the years 2002 - 2018 the average number of fire incidents per year is 11. The highest number of reported fire incidents - 59 took place in 2002, and the least - 0 in 2015. The data has a declining trend.
 When looking into fire subcategories, the most reports belonged to: Outside Fires (55.9%), and Structure Fires (27.9%).