Estimated zip code population in 2022: 7,309 Zip code population in 2010: 8,708 Zip code population in 2000: 9,518
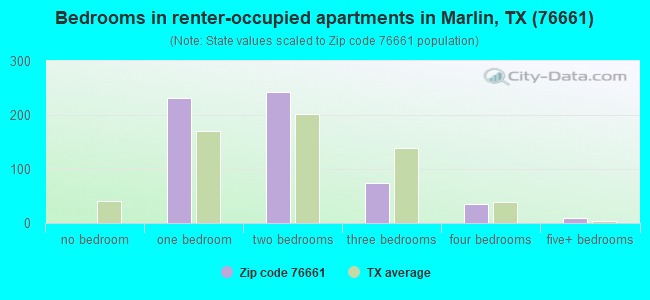
Houses and condos: 3,083 Renter-occupied apartments: 602
% of renters here:
29%
State:
38%
March 2022 cost of living index in zip code 76661: 76.1 (low, U.S. average is 100)
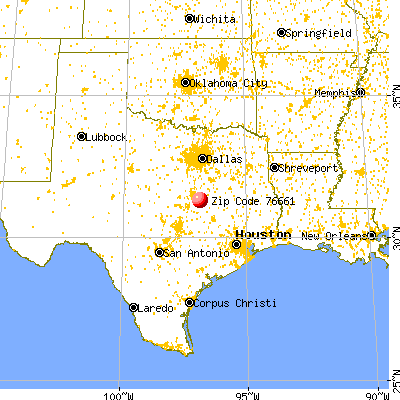
Land area: 160.5 sq. mi. Water area: 2.6 sq. mi.
Population density: 46 people per square mile
(very low).
OSM Map
General Map
Google Map
MSN Map
OSM Map
General Map
Google Map
MSN Map
OSM Map
General Map
Google Map
MSN Map
OSM Map
General Map
Google Map
MSN Map
Please wait while loading the map...
Real estate property taxes paid for housing units in 2022:
This zip code:
1.5% ($1,364)
Texas:
1.5% ($4,050)
Median real estate property taxes paid for housing units with mortgages in 2022: $1,867 (2.0%) Median real estate property taxes paid for housing units with no mortgage in 2022: $1,237 (1.4%)
Averages for the 2020 tax year for zip code 76661, filed in 2021:
Average Adjusted Gross Income (AGI) in 2020: $38,410 (Individual Income Tax Returns)
Here:
$38,410
State:
$77,054
Salary/wage: $33,716 (reported on 82.8% of returns)
Here:
$33,716
State:
$62,766
(% of AGI for various income ranges: 1256.4% for AGIs below $25k, 3773.4% for AGIs $25k-50k, 6554.3% for AGIs $50k-75k, 8798.0% for AGIs $75k-100k, 22384.0% for AGIs $100k-200k)
Taxable interest for individuals: $898 (reported on 17.2% of returns)
This zip code:
$898
Texas:
$2,665
(% of AGI for various income ranges: 7.7% for AGIs below $25k, 9.2% for AGIs $25k-50k, 40.9% for AGIs $50k-75k, 39.0% for AGIs $75k-100k, 274.0% for AGIs $100k-200k)
Ordinary dividends: $4,706 (reported on 6.5% of returns)
Here:
$4,706
State:
$10,044
(% of AGI for various income ranges: 3.4% for AGIs below $25k, 21.7% for AGIs $25k-50k, 75.7% for AGIs $50k-75k, 105.0% for AGIs $75k-100k, 672.0% for AGIs $100k-200k)
Net capital gain/loss in AGI: +$8,539 (reported on 6.9% of returns)
Here:
+$8,539
State:
+$39,590
(% of AGI for various income ranges: 6.3% for AGIs below $25k, 15.2% for AGIs $25k-50k, 242.6% for AGIs $50k-75k, 1628.0% for AGIs $100k-200k)
Profit/loss from business: +$6,035 (reported on 14.1% of returns)
Here:
+$6,035
State:
+$10,888
(% of AGI for various income ranges: 63.0% for AGIs below $25k, 53.9% for AGIs $25k-50k, 91.7% for AGIs $50k-75k, 500.0% for AGIs $75k-100k, 1144.0% for AGIs $100k-200k)
Taxable individual retirement arrangement distribution: $13,646 (reported on 5.0% of returns)
76661:
$13,646
Texas:
$24,740
(% of AGI for various income ranges: 22.4% for AGIs below $25k, 45.8% for AGIs $25k-50k, 232.2% for AGIs $50k-75k, 1426.0% for AGIs $100k-200k)
Total itemized deductions: $30,325 (reported on 1.5% of returns)
Here:
$30,325
State:
$40,428
(% of AGI for various income ranges: 527.4% for AGIs $50k-75k)
Charity contributions: $7,233 (reported on 1.1% of returns)
Here:
$7,233
State:
$18,201
(% of AGI for various income ranges: 30.6% for AGIs $25k-50k)
Taxes paid: $5,250 (reported on 1.5% of returns)
76661:
$5,250
State:
$7,821
(% of AGI for various income ranges: 91.3% for AGIs $50k-75k)
Earned income credit: $2,613 (reported on 33.2% of returns)
Here:
$2,613
State:
$2,584
(% of AGI for various income ranges: 171.3% for AGIs below $25k, 103.0% for AGIs $25k-50k)
Percentage of individuals using paid preparers for their 2020 taxes: 92.7%
Here:
93%
State:
92%
(% for various income ranges: 90.5% for AGIs below $25k, 94.3% for AGIs $25k-50k, 96.9% for AGIs $50k-75k, 92.9% for AGIs $75k-100k, 90.9% for AGIs $100k-200k, 100.0% for AGIs over 200k)
Averages for the 2012 tax year for zip code 76661, filed in 2013:
Average Adjusted Gross Income (AGI) in 2012: $33,052 (Individual Income Tax Returns)
Here:
$33,052
State:
$65,384
Salary/wage: $28,840 (reported on 85.3% of returns)
Here:
$28,840
State:
$52,524
(% of AGI for various income ranges: 86.3% for AGIs below $25k, 84.9% for AGIs $25k-50k, 71.1% for AGIs $50k-75k, 65.2% for AGIs $75k-100k, 88.7% for AGIs $100k-200k)
Taxable interest for individuals: $1,317 (reported on 20.5% of returns)
This zip code:
$1,317
Texas:
$2,372
(% of AGI for various income ranges: 0.5% for AGIs below $25k, 0.8% for AGIs $25k-50k, 1.1% for AGIs $50k-75k, 0.6% for AGIs $75k-100k, 1.6% for AGIs $100k-200k)
Ordinary dividends: $3,814 (reported on 8.5% of returns)
Here:
$3,814
State:
$9,721
(% of AGI for various income ranges: 0.5% for AGIs below $25k, 0.4% for AGIs $25k-50k, 1.4% for AGIs $50k-75k, 1.7% for AGIs $75k-100k, 2.9% for AGIs $100k-200k)
Net capital gain/loss in AGI: +$9,206 (reported on 7.0% of returns)
Here:
+$9,206
State:
+$35,319
(% of AGI for various income ranges: 1.2% for AGIs $50k-75k, 1.7% for AGIs $75k-100k, 14.1% for AGIs $100k-200k)
Profit/loss from business: +$2,406 (reported on 14.0% of returns)
Here:
+$2,406
State:
+$13,732
(% of AGI for various income ranges: 0.8% for AGIs below $25k, 1.0% for AGIs $25k-50k, 1.7% for AGIs $50k-75k, 2.0% for AGIs $75k-100k)
Taxable individual retirement arrangement distribution: $10,379 (reported on 7.4% of returns)
76661:
$10,379
Texas:
$19,511
(% of AGI for various income ranges: 1.4% for AGIs below $25k, 1.8% for AGIs $25k-50k, 3.1% for AGIs $50k-75k, 3.4% for AGIs $75k-100k, 4.5% for AGIs $100k-200k)
Total itemized deductions: $18,662 (25% of AGI, reported on 9.3% of returns)
Here:
$18,662
State:
$24,724
Here:
25.3% of AGI
State:
15.9% of AGI
(% of AGI for various income ranges: 3.5% for AGIs below $25k, 4.5% for AGIs $25k-50k, 6.7% for AGIs $50k-75k, 6.1% for AGIs $75k-100k, 11.1% for AGIs $100k-200k)
Charity contributions: $4,912 (reported on 6.2% of returns)
Here:
$4,912
State:
$6,808
(% of AGI for various income ranges: 0.8% for AGIs $25k-50k, 1.1% for AGIs $50k-75k, 1.8% for AGIs $75k-100k, 2.4% for AGIs $100k-200k)
Taxes paid: $3,462 (reported on 9.3% of returns)
76661:
$3,462
State:
$6,921
(% of AGI for various income ranges: 0.4% for AGIs below $25k, 0.7% for AGIs $25k-50k, 1.1% for AGIs $50k-75k, 1.3% for AGIs $75k-100k, 3.1% for AGIs $100k-200k)
Earned income credit: $2,619 (reported on 37.6% of returns)
Here:
$2,619
State:
$2,570
(% of AGI for various income ranges: 11.5% for AGIs below $25k, 1.8% for AGIs $25k-50k)
Percentage of individuals using paid preparers for their 2012 taxes: 56.2%
Here:
56%
State:
51%
(% for various income ranges: 55.5% for AGIs below $25k, 54.1% for AGIs $25k-50k, 57.7% for AGIs $50k-75k, 63.6% for AGIs $75k-100k, 87.5% for AGIs $100k-200k)
Averages for the 2004 tax year for zip code 76661, filed in 2005:
Average Adjusted Gross Income (AGI) in 2004: $27,156 (Individual Income Tax Returns)
Here:
$27,156
State:
$47,881
Salary/wage: $22,980 (reported on 84.8% of returns)
Here:
$22,980
State:
$41,947
(% of AGI for various income ranges: 133.0% for AGIs below $10k, 83.0% for AGIs $10k-25k, 82.0% for AGIs $25k-50k, 70.9% for AGIs $50k-75k, 61.2% for AGIs $75k-100k, 28.4% for AGIs over 100k)
Taxable interest for individuals: $2,153 (reported on 28.0% of returns)
This zip code:
$2,153
Texas:
$2,255
(% of AGI for various income ranges: 6.1% for AGIs below $10k, 1.5% for AGIs $10k-25k, 1.4% for AGIs $25k-50k, 2.9% for AGIs $50k-75k, 2.4% for AGIs $75k-100k, 3.2% for AGIs over 100k)
Taxable dividends: $1,919 (reported on 10.7% of returns)
Here:
$1,919
State:
$4,261
(% of AGI for various income ranges: 1.3% for AGIs below $10k, 0.4% for AGIs $10k-25k, 0.5% for AGIs $25k-50k, 0.7% for AGIs $50k-75k, 0.6% for AGIs $75k-100k, 1.8% for AGIs over 100k)
Net capital gain/loss: +$7,277 (reported on 10.7% of returns)
Here:
+$7,277
State:
+$16,110
(% of AGI for various income ranges: -0.9% for AGIs below $10k, 0.1% for AGIs $10k-25k, 0.7% for AGIs $25k-50k, 1.3% for AGIs $50k-75k, 1.5% for AGIs $75k-100k, 14.8% for AGIs over 100k)
Profit/loss from business: +$7,272 (reported on 11.6% of returns)
Here:
+$7,272
State:
+$11,013
(% of AGI for various income ranges: -3.2% for AGIs below $10k, 3.4% for AGIs $10k-25k, 2.4% for AGIs $25k-50k, 2.2% for AGIs $50k-75k, 3.2% for AGIs $75k-100k, 6.8% for AGIs over 100k)
IRA payment deduction: $2,654 (reported on 1.9% of returns)
76661:
$2,654
Texas:
$3,120
Total itemized deductions: $15,728 (24% of AGI, reported on 7.4% of returns)
Here:
$15,728
State:
$19,631
Here:
23.7% of AGI
State:
18.9% of AGI
(% of AGI for various income ranges: 2.5% for AGIs $10k-25k, 3.9% for AGIs $25k-50k, 5.6% for AGIs $50k-75k, 7.0% for AGIs $75k-100k, 5.5% for AGIs over 100k)
Charity contributions deductions: $4,598 (7% of AGI, reported on 6.1% of returns)
Here:
$4,598
State:
$4,753
Here:
6.5% of AGI
State:
4.2% of AGI
(% of AGI for various income ranges: 0.5% for AGIs $10k-25k, 0.6% for AGIs $25k-50k, 1.4% for AGIs $50k-75k, 1.8% for AGIs $75k-100k, 2.0% for AGIs over 100k)
Total tax: $3,943 (reported on 56.4% of returns)
76661:
$3,943
State:
$9,058
(% of AGI for various income ranges: 2.2% for AGIs below $10k, 2.7% for AGIs $10k-25k, 5.8% for AGIs $25k-50k, 9.7% for AGIs $50k-75k, 12.2% for AGIs $75k-100k, 18.2% for AGIs over 100k)
Earned income credit: $1,959 (reported on 38.5% of returns)
Here:
$1,959
State:
$2,024
Percentage of individuals using paid preparers for their 2004 taxes: 62.1%
Here:
62%
State:
57%
(% for various income ranges: 54.5% for AGIs below $10k, 66.5% for AGIs $10k-25k, 61.8% for AGIs $25k-50k, 59.5% for AGIs $50k-75k, 69.3% for AGIs $75k-100k, 82.0% for AGIs over 100k)
Household received Food Stamps/SNAP in the past 12 months: 645 Household did not receive Food Stamps/SNAP in the past 12 months: 1,474
Women who had a birth in the past 12 months: 296 (283 now married, 17 unmarried) Women who did not have a birth in the past 12 months: 1,959 (506 now married, 1,465 unmarried)
Housing units in zip code 76661 with a mortgage: 488 (2 second mortgage, 3 both second mortgage and home equity loan) Houses without a mortgage: 27
Median monthly owner costs for units with a mortgage: $933 Median monthly owner costs for units without a mortgage: $446
Residents with income below the poverty level in 2022:
This zip code:
21.0%
Whole state:
14.0%
Residents with income below 50% of the poverty level in 2022:
This zip code:
13.4%
Whole state:
7.4%
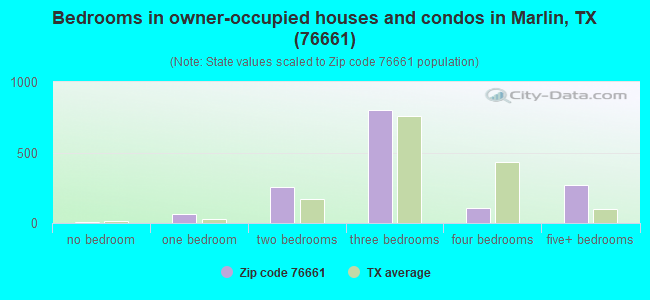
Median number of rooms in houses and condos:
Here:
5.5
State:
6.3
Median number of rooms in apartments:
Here:
4.0
State:
4.0
Notable locations in this zip code not listed on our city pages
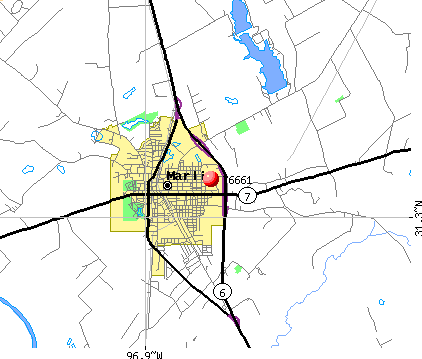
Notable locations in zip code 76661: Marlin Country Club (A), Highlands Mansion (B), Marlin Volunteer Fire Department (C), Marlin Fire Department Station 1 (D), Marlin Fire Department Station 2 (E), Marlin Volunteer Fire Department (F), Falls County Emergency Medical Services (G). Display/hide their locations on the map
Churches in zip code 76661 include: Church Saint Pauls (A), First Presbyterian Church (B), Pentecostal Bibleway Holiness Church (C), Davis Chapel United Methodist Church (D), Grace Lutheran Church (E), Power House Church of God in Christ (F), Bernard Steet Church of Christ (G), Saint Josephs Catholic Church (H), Saint Pauls Baptist Church (I). Display/hide their locations on the map
Cemeteries: Evergreen Cemetery (1), Old Bowman Cemetery (2), Hillcrest Cemetery (3), Taylor Chapel Cemetery (4), Calvary Cemetery (5), Falls County Cemetery (6), New Bowman Cemetery (7). Display/hide their locations on the map
Lakes and reservoirs: Buie Lake (A), McCullough Slough (B), Oil Mill Lake (C), New City Lake (D), Marlin City Lake (E), Marlin Old City Lake (F), City Lake (G), Falls Cattle Company Lake (H). Display/hide their locations on the map
Streams, rivers, and creeks: Brushy Creek (A), Bean Branch (B), Barganier Slough (C), Big Creek (D), Sandy Creek (E), Pin Oak Creek (F), Keechi Creek (G), Tucker Creek (H), Salt Branch (I). Display/hide their locations on the map
In group quarters: 1,765 (-1 institutionalized population)
Size of family households: 603 2-persons, 89 3-persons, 62 4-persons, 64 5-persons, 12 6-persons, 242 7-or-more-persons
Size of nonfamily households: 1,012 1-person, 39 2-persons
669 married couples with children.
226 single-parent households (105 men, 121 women).
87.0% of residents of 76661 zip code speak English at home.
12.4% of residents speak Spanish at home (56% very well, 36% well, 5% not well, 3% not at all).
0.4% of residents speak other Indo-European language at home (57% very well, 43% well).
0.1% of residents speak other language at home (100% well).
Foreign born population: 495 (6.8%) (14.4% of them are naturalized citizens)
This zip code:
6.8%
Whole state:
17.2%
46%Singapore
45%Honduras
3%Guatemala
2%Sweden
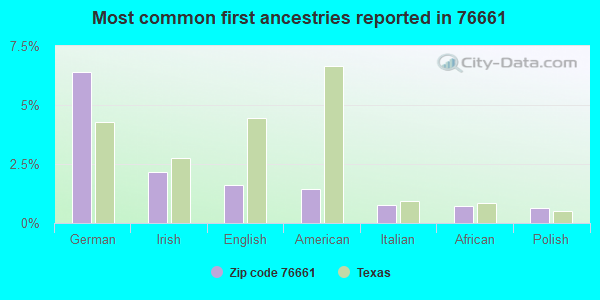
6%German
2%Irish
2%English
1%American
1%Italian
1%African
1%Polish
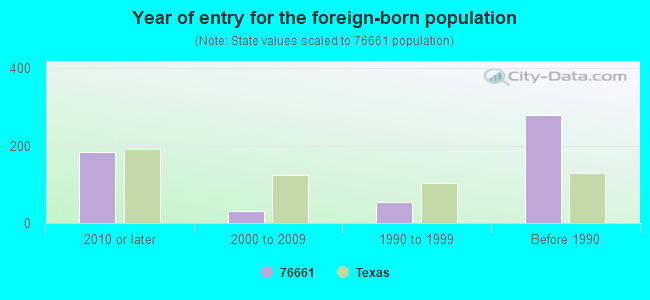
Year of entry for the foreign-born population
1842010 or later
302000 to 2009
541990 to 1999
279Before 1990
Housing units lacking complete plumbing facilities: 22.4% Housing units lacking complete kitchen facilities: 21.3%
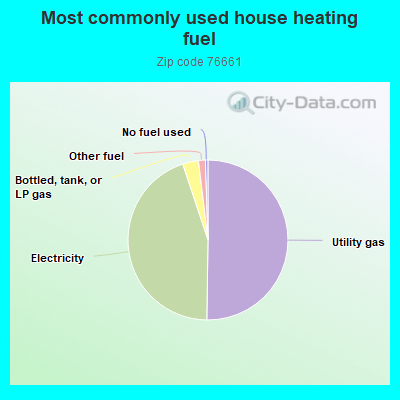
50.3%Utility gas
44.7%Electricity
3.2%Bottled, tank, or LP gas
1.4%Other fuel
0.5%No fuel used
Population in 1990: 8,810. Population change in the 1990s: +708 (+8.0%).
Place of birth for U.S.-born residents:
This state: 4,961
Northeast: 41
Midwest: 209
South: 364
West: 1,197
61% of the 76661 zip code residents lived in the same house 5 years ago. Out of people who lived in different houses, 52% lived in this county. Out of people who lived in different counties, 50% lived in Texas.
83% of the 76661 zip code residents lived in the same house 1 year ago. Out of people who lived in different houses, 13% moved from this county. Out of people who lived in different houses, 83% moved from different county within same state. Out of people who lived in different houses, 5% moved from different state. Out of people who lived in different houses, 1% moved from abroad.
Private vs. public school enrollment:
Students in private schools in grades 1 to 8 (elementary and middle school): 20
Here:
4.5%
Texas:
8.8%
Students in private schools in grades 9 to 12 (high school): 34
Here:
4.5%
Texas:
8.0%
Students in private undergraduate colleges: 101
Here:
32.1%
Texas:
16.2%
Occupation by median earnings in the past 12 months ($)
64,700Health diagnosing and treating practitioners and other technical occupations
55,802Law enforcement workers including supervisors
55,469Management occupations
49,685Office and administrative support occupations
49,184Education, training, and library occupations
35,603Transportation occupations
Top industries in this zip code by the number of employees in 2005:
Administrative and Support and Waste Management and Remediation Services: Temporary Help Services (500-999 employees: 1 establishment)
Health Care and Social Assistance: General Medical and Surgical Hospitals (100-249: 1)
Health Care and Social Assistance: Nursing Care Facilities (50-99: 2)
Accommodation and Food Services: Limited-Service Restaurants (20-49: 1, 10-19: 4)
590 people in local jails and other municipal confinement facilities
93 people in nursing facilities/skilled-nursing facilities
15 people in group homes intended for adults
People in group quarters in 2000:
1,312 people in state prisons
411 people in short-term care, detention or diagnostic centers for delinquent children
208 people in nursing homes
16 people in mental (psychiatric) hospitals or wards
13 people in local jails and other confinement facilities (including police lockups)
11 people in homes for the mentally ill
Fatal accident statistics in 2014:
Fatal accident count: 1
Vehicles involved in fatal accidents: 1
Fatal accidents caused by drunken drivers: 1
Fatalities: 1
Persons involved in fatal accidents: 1
Pedestrians involved in fatal accidents: 0
Fatal accident statistics in 2013:
Fatal accident count: 4
Vehicles involved in fatal accidents: 7
Fatal accidents caused by drunken drivers: 1
Fatalities: 5
Persons involved in fatal accidents: 8
Pedestrians involved in fatal accidents: 0
2002 - 2018 National Fire Incident Reporting System (NFIRS) incidents
Based on the data from the years 2002 - 2018 the average number of fires per year is 46. The highest number of fire incidents - 64 took place in 2011, and the least - 36 in 2016. The data has a dropping trend.
When looking into fire subcategories, the most incidents belonged to: Outside Fires (48.9%), and Structure Fires (28.3%).
Fire incident types reported to NFIRS in Zip Code 76661


 Nearest zip codes: 76680, 76682, 76685, 76632, 76653, 76656.


 Based on the data from the years 2002 - 2018 the average number of fires per year is 46. The highest number of fire incidents - 64 took place in 2011, and the least - 36 in 2016. The data has a dropping trend.
 When looking into fire subcategories, the most incidents belonged to: Outside Fires (48.9%), and Structure Fires (28.3%).