Estimated zip code population in 2022: 6,886 Zip code population in 2010: 6,612 Zip code population in 2000: 7,430
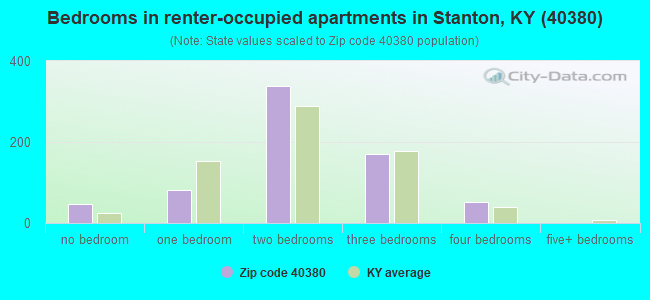
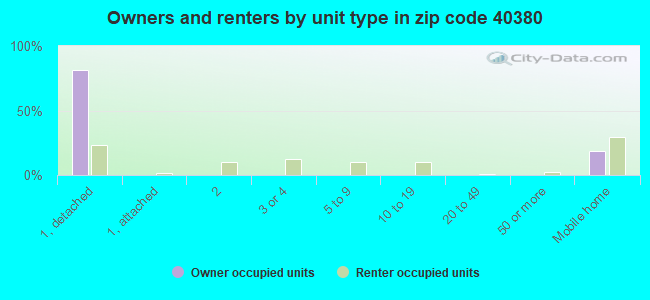
Houses and condos: 2,853 Renter-occupied apartments: 694
% of renters here:
29%
State:
31%
March 2022 cost of living index in zip code 40380: 81.8 (low, U.S. average is 100)
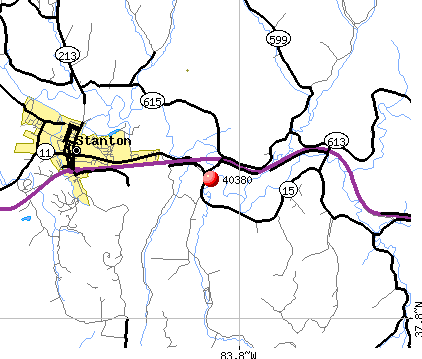
Land area: 114.4 sq. mi. Water area: 0.5 sq. mi.
Population density: 60 people per square mile
(very low).
OSM Map
General Map
Google Map
MSN Map
OSM Map
General Map
Google Map
MSN Map
OSM Map
General Map
Google Map
MSN Map
OSM Map
General Map
Google Map
MSN Map
Please wait while loading the map...
Real estate property taxes paid for housing units in 2022:
This zip code:
0.7% ($888)
Kentucky:
0.7% ($1,456)
Median real estate property taxes paid for housing units with mortgages in 2022: $907 (0.6%) Median real estate property taxes paid for housing units with no mortgage in 2022: $865 (0.7%)
Business Search- 14 Million verified businesses
Males: 3,322
(48.2%)
Females: 3,564
(51.8%)
For population 25 years and over in 40380:
High school or higher: 86.7%
Bachelor's degree or higher: 16.6%
Graduate or professional degree: 5.6%
Unemployed: 8.4%
Mean travel time to work (commute): 26.0 minutes
For population 15 years and over in 40380:
Never married: 23.6%
Now married: 53.9%
Separated: 1.9%
Widowed: 6.6%
Divorced: 13.9%
Zip code 40380 compared to state average:
Unemployed percentage above state average.
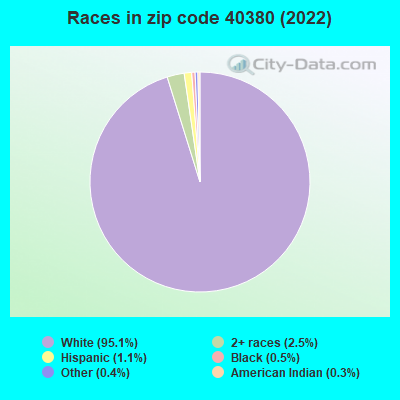
Black race population percentage significantly below state average.
Hispanic race population percentage significantly below state average.
Foreign-born population percentage significantly below state average.
Length of stay since moving in significantly above state average.
Percentage of population with a bachelor's degree or higher below state average.
Averages for the 2020 tax year for zip code 40380, filed in 2021:
Average Adjusted Gross Income (AGI) in 2020: $43,401 (Individual Income Tax Returns)
Here:
$43,401
State:
$61,342
Salary/wage: $38,406 (reported on 80.4% of returns)
Here:
$38,406
State:
$50,827
(% of AGI for various income ranges: 1066.6% for AGIs below $25k, 3445.2% for AGIs $25k-50k, 6224.8% for AGIs $50k-75k, 9415.6% for AGIs $75k-100k, 16551.4% for AGIs $100k-200k)
Taxable interest for individuals: $898 (reported on 19.2% of returns)
This zip code:
$898
Kentucky:
$1,441
(% of AGI for various income ranges: 5.6% for AGIs below $25k, 12.1% for AGIs $25k-50k, 15.2% for AGIs $50k-75k, 19.4% for AGIs $75k-100k, 204.3% for AGIs $100k-200k)
Ordinary dividends: $2,387 (reported on 5.3% of returns)
Here:
$2,387
State:
$7,388
(% of AGI for various income ranges: 5.8% for AGIs below $25k, 2.3% for AGIs $25k-50k, 37.2% for AGIs $50k-75k, 10.0% for AGIs $75k-100k, 120.0% for AGIs $100k-200k)
Net capital gain/loss in AGI: +$16,864 (reported on 5.0% of returns)
Here:
+$16,864
State:
+$19,475
(% of AGI for various income ranges: 4.4% for AGIs below $25k, 60.0% for AGIs $50k-75k, 1534.3% for AGIs $100k-200k)
Profit/loss from business: +$6,814 (reported on 14.9% of returns)
Here:
+$6,814
State:
+$11,386
(% of AGI for various income ranges: 132.9% for AGIs below $25k, 79.8% for AGIs $25k-50k, 181.0% for AGIs $50k-75k, 177.5% for AGIs $75k-100k, 273.6% for AGIs $100k-200k)
Taxable individual retirement arrangement distribution: $16,544 (reported on 5.7% of returns)
40380:
$16,544
Kentucky:
$18,941
(% of AGI for various income ranges: 32.4% for AGIs below $25k, 69.7% for AGIs $25k-50k, 275.9% for AGIs $50k-75k, 810.0% for AGIs $100k-200k)
Total itemized deductions: $24,780 (reported on 1.8% of returns)
Here:
$24,780
State:
$32,473
(% of AGI for various income ranges: 85.1% for AGIs $25k-50k, 514.3% for AGIs $100k-200k)
Charity contributions: $10,800 (reported on 1.1% of returns)
Here:
$10,800
State:
$13,472
(% of AGI for various income ranges: 202.5% for AGIs $75k-100k)
Taxes paid: $6,500 (reported on 1.8% of returns)
40380:
$6,500
State:
$7,830
(% of AGI for various income ranges: 22.5% for AGIs $25k-50k, 134.3% for AGIs $100k-200k)
Earned income credit: $2,545 (reported on 25.3% of returns)
Here:
$2,545
State:
$2,336
(% of AGI for various income ranges: 130.4% for AGIs below $25k, 105.9% for AGIs $25k-50k)
Percentage of individuals using paid preparers for their 2020 taxes: 96.1%
Here:
96%
State:
94%
(% for various income ranges: 95.8% for AGIs below $25k, 96.1% for AGIs $25k-50k, 94.9% for AGIs $50k-75k, 95.7% for AGIs $75k-100k, 100.0% for AGIs $100k-200k, 100.0% for AGIs over 200k)
Averages for the 2012 tax year for zip code 40380, filed in 2013:
Average Adjusted Gross Income (AGI) in 2012: $35,741 (Individual Income Tax Returns)
Here:
$35,741
State:
$50,814
Salary/wage: $32,754 (reported on 84.7% of returns)
Here:
$32,754
State:
$42,723
(% of AGI for various income ranges: 74.0% for AGIs below $25k, 81.6% for AGIs $25k-50k, 81.1% for AGIs $50k-75k, 75.3% for AGIs $75k-100k, 73.5% for AGIs $100k-200k)
Taxable interest for individuals: $917 (reported on 20.1% of returns)
This zip code:
$917
Kentucky:
$1,381
(% of AGI for various income ranges: 0.8% for AGIs below $25k, 0.5% for AGIs $25k-50k, 0.3% for AGIs $50k-75k, 0.4% for AGIs $75k-100k, 0.6% for AGIs $100k-200k)
Ordinary dividends: $1,843 (reported on 5.2% of returns)
Here:
$1,843
State:
$6,239
(% of AGI for various income ranges: 0.3% for AGIs below $25k, 0.4% for AGIs $25k-50k, 0.6% for AGIs $75k-100k)
Net capital gain/loss in AGI: +$4,269 (reported on 6.0% of returns)
Here:
+$4,269
State:
+$11,336
(% of AGI for various income ranges: 0.3% for AGIs $25k-50k, 0.3% for AGIs $50k-75k, 1.2% for AGIs $75k-100k, 2.1% for AGIs $100k-200k)
Profit/loss from business: +$5,764 (reported on 16.8% of returns)
Here:
+$5,764
State:
+$10,862
(% of AGI for various income ranges: 10.9% for AGIs below $25k, 1.9% for AGIs $25k-50k, 1.3% for AGIs $50k-75k, 0.2% for AGIs $75k-100k, 0.3% for AGIs $100k-200k)
Taxable individual retirement arrangement distribution: $9,927 (reported on 5.6% of returns)
40380:
$9,927
Kentucky:
$14,296
(% of AGI for various income ranges: 1.2% for AGIs below $25k, 1.5% for AGIs $25k-50k, 1.1% for AGIs $50k-75k, 4.4% for AGIs $75k-100k)
Total itemized deductions: $16,514 (22% of AGI, reported on 18.3% of returns)
Here:
$16,514
State:
$21,160
Here:
22.2% of AGI
State:
20.0% of AGI
(% of AGI for various income ranges: 3.3% for AGIs below $25k, 5.4% for AGIs $25k-50k, 8.1% for AGIs $50k-75k, 12.6% for AGIs $75k-100k, 14.1% for AGIs $100k-200k)
Charity contributions: $3,185 (reported on 14.6% of returns)
Here:
$3,185
State:
$4,303
(% of AGI for various income ranges: 0.4% for AGIs below $25k, 0.6% for AGIs $25k-50k, 0.9% for AGIs $50k-75k, 2.3% for AGIs $75k-100k, 2.6% for AGIs $100k-200k)
Taxes paid: $5,733 (reported on 18.3% of returns)
40380:
$5,733
State:
$8,496
(% of AGI for various income ranges: 0.5% for AGIs below $25k, 1.4% for AGIs $25k-50k, 2.5% for AGIs $50k-75k, 4.6% for AGIs $75k-100k, 6.2% for AGIs $100k-200k)
Earned income credit: $2,364 (reported on 30.2% of returns)
Here:
$2,364
State:
$2,273
(% of AGI for various income ranges: 9.4% for AGIs below $25k, 1.6% for AGIs $25k-50k)
Percentage of individuals using paid preparers for their 2012 taxes: 74.6%
Here:
75%
State:
60%
(% for various income ranges: 75.8% for AGIs below $25k, 73.9% for AGIs $25k-50k, 71.4% for AGIs $50k-75k, 73.7% for AGIs $75k-100k, 76.9% for AGIs $100k-200k)
Averages for the 2004 tax year for zip code 40380, filed in 2005:
Average Adjusted Gross Income (AGI) in 2004: $30,875 (Individual Income Tax Returns)
Here:
$30,875
State:
$41,540
Salary/wage: $29,095 (reported on 85.9% of returns)
Here:
$29,095
State:
$36,432
(% of AGI for various income ranges: 87.5% for AGIs below $10k, 77.7% for AGIs $10k-25k, 82.4% for AGIs $25k-50k, 89.3% for AGIs $50k-75k, 83.7% for AGIs $75k-100k, 62.6% for AGIs over 100k)
Taxable interest for individuals: $1,388 (reported on 28.7% of returns)
This zip code:
$1,388
Kentucky:
$1,571
(% of AGI for various income ranges: 4.4% for AGIs below $10k, 1.4% for AGIs $10k-25k, 0.9% for AGIs $25k-50k, 0.9% for AGIs $50k-75k, 1.1% for AGIs $75k-100k, 2.2% for AGIs over 100k)
Taxable dividends: $1,022 (reported on 6.8% of returns)
Here:
$1,022
State:
$3,453
(% of AGI for various income ranges: 0.1% for AGIs below $10k, 0.4% for AGIs $10k-25k, 0.2% for AGIs $25k-50k, 0.2% for AGIs $50k-75k, 0.0% for AGIs $75k-100k, 0.6% for AGIs over 100k)
Net capital gain/loss: +$4,648 (reported on 5.3% of returns)
Here:
+$4,648
State:
+$9,663
(% of AGI for various income ranges: 0.6% for AGIs below $10k, 0.4% for AGIs $10k-25k, 0.2% for AGIs $25k-50k, 0.5% for AGIs $50k-75k, 0.7% for AGIs $75k-100k, 3.5% for AGIs over 100k)
Profit/loss from business: +$5,553 (reported on 15.1% of returns)
Here:
+$5,553
State:
+$9,233
(% of AGI for various income ranges: -4.5% for AGIs below $10k, 8.0% for AGIs $10k-25k, 2.7% for AGIs $25k-50k, 1.1% for AGIs $50k-75k, 0.7% for AGIs $75k-100k, 2.6% for AGIs over 100k)
IRA payment deduction: $3,147 (reported on 1.2% of returns)
40380:
$3,147
Kentucky:
$2,955
Total itemized deductions: $14,208 (22% of AGI, reported on 19.3% of returns)
Here:
$14,208
State:
$17,474
Here:
22.0% of AGI
State:
21.0% of AGI
(% of AGI for various income ranges: 6.4% for AGIs below $10k, 3.9% for AGIs $10k-25k, 7.0% for AGIs $25k-50k, 10.4% for AGIs $50k-75k, 13.2% for AGIs $75k-100k, 14.0% for AGIs over 100k)
Charity contributions deductions: $2,723 (4% of AGI, reported on 15.3% of returns)
Here:
$2,723
State:
$3,494
Here:
3.9% of AGI
State:
4.0% of AGI
(% of AGI for various income ranges: 0.5% for AGIs $10k-25k, 0.8% for AGIs $25k-50k, 1.3% for AGIs $50k-75k, 1.9% for AGIs $75k-100k, 3.7% for AGIs over 100k)
Total tax: $3,605 (reported on 68.1% of returns)
40380:
$3,605
State:
$6,162
(% of AGI for various income ranges: 3.5% for AGIs below $10k, 4.0% for AGIs $10k-25k, 6.1% for AGIs $25k-50k, 8.1% for AGIs $50k-75k, 10.7% for AGIs $75k-100k, 16.0% for AGIs over 100k)
Earned income credit: $1,788 (reported on 27.5% of returns)
Here:
$1,788
State:
$1,723
Percentage of individuals using paid preparers for their 2004 taxes: 77.4%
Here:
77%
State:
66%
(% for various income ranges: 75.3% for AGIs below $10k, 79.4% for AGIs $10k-25k, 77.8% for AGIs $25k-50k, 76.5% for AGIs $50k-75k, 72.5% for AGIs $75k-100k, 79.5% for AGIs over 100k)
Likely homosexual households (counted as self-reported same-sex unmarried-partner households)
Lesbian couples: 0.0% of all households
Gay men: 0.6% of all households
Household received Food Stamps/SNAP in the past 12 months: 468 Household did not receive Food Stamps/SNAP in the past 12 months: 1,927
Women who had a birth in the past 12 months: 246 (210 now married, 32 unmarried) Women who did not have a birth in the past 12 months: 1,458 (613 now married, 844 unmarried)
Housing units in zip code 40380 with a mortgage: 802 (35 second mortgage, 35 both second mortgage and home equity loan) Median monthly owner costs for units with a mortgage: $947 Median monthly owner costs for units without a mortgage: $375
Residents with income below the poverty level in 2022:
This zip code:
17.4%
Whole state:
16.5%
Residents with income below 50% of the poverty level in 2022:
This zip code:
9.0%
Whole state:
9.0%
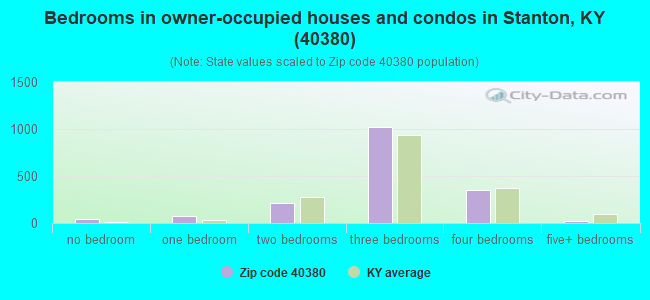
Median number of rooms in houses and condos:
Here:
6.3
State:
6.4
Median number of rooms in apartments:
Here:
4.4
State:
4.4
Notable locations in this zip code not listed on our city pages
Notable locations in zip code 40380: Rogers Chapel (A), Grays Arch Picnic Area (B), The Devils Gulch (C), High Rocks (D), Stanton Fire Department (E), Daniel Boone National Forest Cumberland Ranger District Stanton Office (F), Stanton Fire Department (G), Middlefork Fire Department (H), Stanton Ranger Station (I), Powell County Ambulance Service (J). Display/hide their locations on the map
Churches in zip code 40380 include: Cat Creek Church (A), Cane Creek Church (B), Hatcher Creek Church (C), Wildwood Church (D), Morris Creek (E), Dunwoody Church (F), Tin Town Church (G), South Fork Church (H), Mount Canaan Chapel (I). Display/hide their locations on the map
Streams, rivers, and creeks: Cane Creek (A), Cat Creek (B), Cave Branch (C), Cold Spring Branch (D), Cow Creek (E), Crow Drive Creek (F), Daniel Branch (G), Dunwoody Branch (H), Ewen Branch (I). Display/hide their locations on the map
In group quarters: 313 (-1 institutionalized population)
Size of family households: 686 2-persons, 399 3-persons, 383 4-persons, 125 5-persons, 26 6-persons, 12 7-or-more-persons
Size of nonfamily households: 754 1-person, 8 2-persons
812 married couples with children.
236 single-parent households (43 men, 193 women).
98.8% of residents of 40380 zip code speak English at home.
1.0% of residents speak Spanish at home (25% very well, 70% well, 5% not well).
0.2% of residents speak Asian or Pacific Island language at home (100% very well).
0.1% of residents speak other language at home (100% very well).
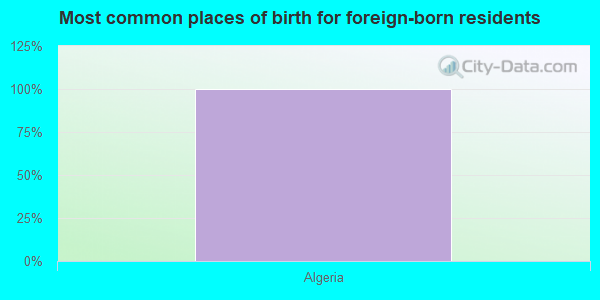
Foreign born population: 54 (0.8%) (100.0% of them are naturalized citizens)
This zip code:
0.8%
Whole state:
4.0%
100%Algeria
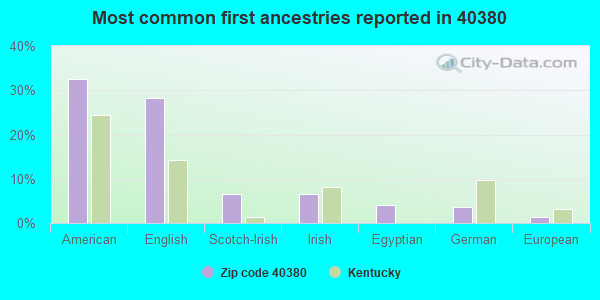
32%American
28%English
7%Scotch-Irish
6%Irish
4%Egyptian
4%German
1%European
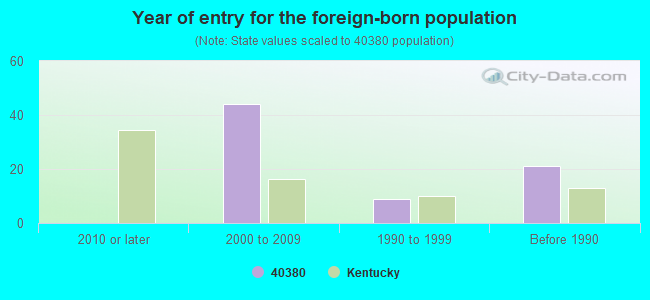
Year of entry for the foreign-born population
02010 or later
442000 to 2009
91990 to 1999
21Before 1990
Major facilities with environmental interests located in this zip code:
BURKE PARSONS BOWLBY CORPORATION (164 MAIN ST. in STANTON, KY)
AIR MAJOR (AIRS/AFS) SUPERFUND (Superfund database) CRITERIA AND HAZARDOUS AIR POLLUTANT INVENTORY (Inventory of air pollution sources) National Pollutant Discharge Elimination System NON-MAJOR (Tracking pollutant discharge elimination systems) - permit Small Quantity Generators, between 100 kg and 1000 kg of hazardous waste/month (Resource Conservation and Recovery Act (tracking hazardous waste)) TRI REPORTER (Tracking of toxic chemicals releasing facilities) Business SIC classification: WOOD PRESERVING Business NAICS classification: WOOD PRESERVATION.; WOOD PRESERVATION. Organizations: THE BURKE PARSONS BOWLBY CORP (CONTACT/OWNER)
, BURKE-PARSONS-BOWLBY CORP. (CONTACT/OWNER)
Alternative names: BURKE-PARSONS BOWLBY CORP, BURKE-PARSONS-BOWLKY CORP
CONTINENTAL METAL SPECIALTY (LYCOMING DRIVE in STANTON, KY)
National Pollutant Discharge Elimination System NON-MAJOR (Tracking pollutant discharge elimination systems) - permit (Resource Conservation and Recovery Act (tracking hazardous waste)) Business SIC classification: ELECTRICAL INDUSTRIAL APPARATUS Organizations: CONTINENTAL METALS (CONTACT/OWNER)
BOWEN ELEMENTARY SCHOOL (5099 CAMPTON RD in STANTON, KY)
(National Center for Education Statistics) - STATE ID-099495010 Organizations: POWELL COUNTY (SCHOOL DISTRICT)
POWELL COUNTY ALTERNATIVE SCHOOL (690 BRECKINRIDGE ST in STANTON, KY)
(National Center for Education Statistics) - STATE ID-099495011
POWELL COUNTY HIGH SCHOOL (700 W COLLEGE AVE in STANTON, KY)
(National Center for Education Statistics) - STATE ID-099495040
POWELL COUNTY MIDDLE SCHOOL (770 W COLLEGE AVE in STANTON, KY)
(National Center for Education Statistics) - STATE ID-099495015
COLUMBIA GULF TRANSMISSION COMPANY STANTON (3066 MORRIS CREEK ROAD in STANTON, KY)
AIR MAJOR (AIRS/AFS) COMPLIANCE ACTIVITY (Tracking inspections of insecticide, fungicide, and rodenticide, and toxic substances) CRITERIA AND HAZARDOUS AIR POLLUTANT INVENTORY (Inventory of air pollution sources) Small Quantity Generators, between 100 kg and 1000 kg of hazardous waste/month (Resource Conservation and Recovery Act (tracking hazardous waste)) Business SIC classification: NATURAL GAS TRANSMISSION Organizations: COLUMBIA GAS TRANSMISSION CORPORATION (CONTACT/OWNER)
Alternative names: COLUMBIA GULF TRANS CO, COLUMBIA GULF TRANS. STANTON STATION
ASHLAND BRANDED MARKETING INC. 428-005 (HIGHWAY 15 & COLLEGE STREET in STANTON, KY)
(Resource Conservation and Recovery Act (tracking hazardous waste))
BOWEN ELEMENTARY SCHOOL (HIGHWAYS 11 & 15 in BOWEN, KY)
National Pollutant Discharge Elimination System NON-MAJOR (Tracking pollutant discharge elimination systems) - permit Business SIC classification: ELEMENTARY AND SECONDARY SCHOOLS Organizations: BOWEN LEME SCHOOL (CONTACT/OWNER)
Alternative names: BOWEN ELEM SCHOOL
BUTCHER OIL & SUPPLY CO INC (4450 CAMPTON RD in STANTON, KY)
National Pollutant Discharge Elimination System NON-MAJOR (Tracking pollutant discharge elimination systems) - permit Business SIC classification: PETROLEUM BULK STATIONS AND TERMINALS
BUTCHER OIL BULK PLANT (107-1/2 COLLEGE ST in STANTON, KY)
(Resource Conservation and Recovery Act (tracking hazardous waste)) Organizations: ARLEN SHEPERD SR (CONTACT/OWNER)
CATRON, TROY (3579 MORRIS CREEK in STANTON, KY)
National Pollutant Discharge Elimination System NON-MAJOR (Tracking pollutant discharge elimination systems) - permit Business SIC classification: SAWMILLS AND PLANING MILLS, GENERAL
COLUMBIA GULF TRANSMISSION CO (1 MI N OF COMPRESSOR STA in STANTON, KY)
(Resource Conservation and Recovery Act (tracking hazardous waste)) Organizations: COLUMBIA GAS TRANSMISSION CORP (CONTACT/OWNER)
Housing units lacking complete plumbing facilities: 9.0% Housing units lacking complete kitchen facilities: 6.4%
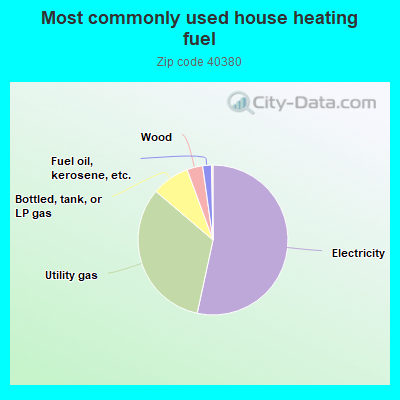
53.5%Electricity
32.9%Utility gas
8.2%Bottled, tank, or LP gas
3.4%Wood
1.9%Fuel oil, kerosene, etc.
Population in 1990: 5,966. Population change in the 1990s: +1,464 (+24.5%).
Place of birth for U.S.-born residents:
This state: 5,400
Northeast: 136
Midwest: 668
South: 452
West: 113
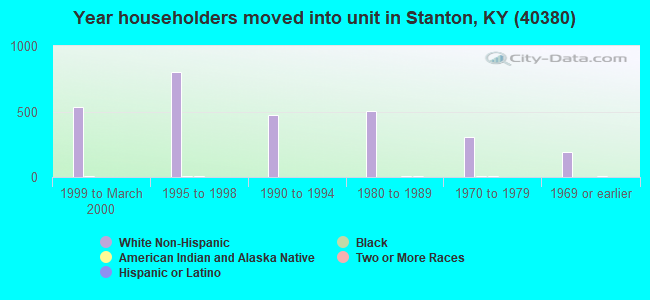
57% of the 40380 zip code residents lived in the same house 5 years ago. Out of people who lived in different houses, 64% lived in this county. Out of people who lived in different counties, 50% lived in Kentucky.
92% of the 40380 zip code residents lived in the same house 1 year ago. Out of people who lived in different houses, 62% moved from this county. Out of people who lived in different houses, 31% moved from different county within same state. Out of people who lived in different houses, 4% moved from different state.
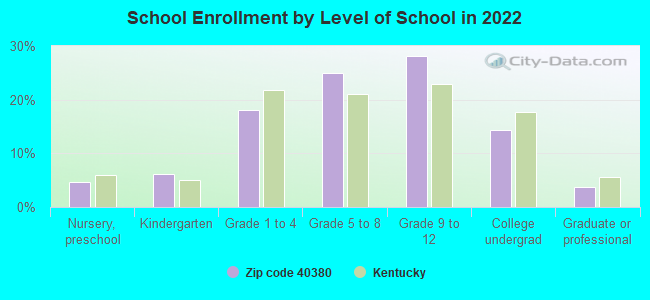
Private vs. public school enrollment:
Students in private schools in grades 1 to 8 (elementary and middle school): 39
Here:
6.3%
Kentucky:
17.2%
Students in private schools in grades 9 to 12 (high school): 74
Here:
17.7%
Kentucky:
15.2%
Students in private undergraduate colleges: 9
Here:
4.4%
Kentucky:
19.6%
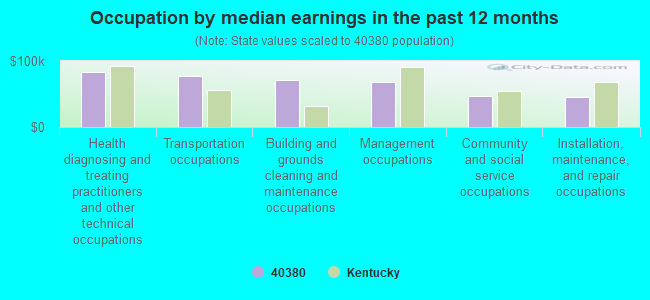
Occupation by median earnings in the past 12 months ($)
83,137Health diagnosing and treating practitioners and other technical occupations
77,237Transportation occupations
71,845Building and grounds cleaning and maintenance occupations
67,557Management occupations
47,431Community and social service occupations
46,175Installation, maintenance, and repair occupations
Top industries in this zip code by the number of employees in 2005:
Health Care and Social Assistance: Nursing Care Facilities (100-249: 1)
Accommodation and Food Services: Limited-Service Restaurants (20-49: 4, 1-4: 1)
Finance and Insurance: Commercial Banking (20-49: 1)
People in group quarters in 2010:
109 people in local jails and other municipal confinement facilities
76 people in nursing facilities/skilled-nursing facilities
2 people in group homes intended for adults
People in group quarters in 2000:
72 people in nursing homes
25 people in local jails and other confinement facilities (including police lockups)
16 people in other group homes
2 people in religious group quarters
Fatal accident statistics in 2014:
Fatal accident count: 2
Vehicles involved in fatal accidents: 3
Fatal accidents caused by drunken drivers: 0
Fatalities: 2
Persons involved in fatal accidents: 4
Pedestrians involved in fatal accidents: 0
Fatal accident statistics in 2013:
Fatal accident count: 2
Vehicles involved in fatal accidents: 2
Fatal accidents caused by drunken drivers: 1
Fatalities: 2
Persons involved in fatal accidents: 2
Pedestrians involved in fatal accidents: 0
2004 - 2018 National Fire Incident Reporting System (NFIRS) incidents
Based on the data from the years 2004 - 2018 the average number of fires per year is 12. The highest number of reported fire incidents - 32 took place in 2004, and the least - 0 in 2006. The data has a decreasing trend.
When looking into fire subcategories, the most incidents belonged to: Structure Fires (54.9%), and Outside Fires (20.1%).
Fire incident types reported to NFIRS in Zip Code 40380


 Nearest zip codes: 40472, 40376, 40337, 40312, 41397, 40346.


 Based on the data from the years 2004 - 2018 the average number of fires per year is 12. The highest number of reported fire incidents - 32 took place in 2004, and the least - 0 in 2006. The data has a decreasing trend.
 When looking into fire subcategories, the most incidents belonged to: Structure Fires (54.9%), and Outside Fires (20.1%).