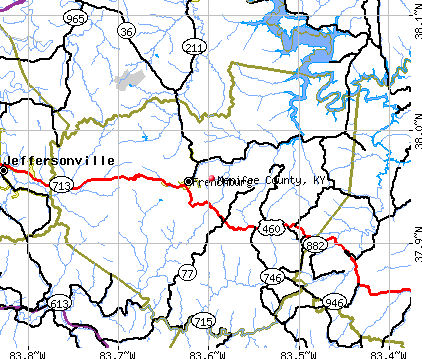
Menifee County, Kentucky (KY)
County owner-occupied free and clear houses and condos in 2010: 876
County owner-occupied houses and condos in 2000: 2,059
Renter-occupied apartments: 516 (it was 478 in 2000)
| % of renters here: | 19% |
| State: | 31% |
Land area: 204 sq. mi.
Water area: 2.1 sq. mi.
Population density: 30 people per square mile (low).
Industries providing employment: Educational, health and social services (23.6%), Manufacturing (20.4%), Retail trade (11.4%), Construction (11.3%).
Type of workers:
- Private wage or salary: 77%
- Government: 13%
- Self-employed, not incorporated: 10%
- Unpaid family work: 0%
- OSM Map
- General Map
- Google Map
- MSN Map

- 5,86795.3%White Non-Hispanic Alone
- 1542.5%Hispanic or Latino
- 1222.0%Two or more races
- 110.2%Black Non-Hispanic Alone

| Median resident age: | 43.7 years |
| Kentucky median age: | 39.4 years |
| Males: 3,282 | |
| Females: 2,904 |

 | Wellington Ky (3 replies) |
| Storm Watch, March 2012 (39 replies) |
| want to start a horse facility (20 replies) |
| Menifee County: | 2.0 people |
| Kentucky: | 2 people |
Estimated median household income in 2022: $43,184 ($22,064 in 1999)
| This county: | $43,184 |
| Kentucky: | $59,341 |
Median contract rent in 2022 for apartments: $362 (lower quartile is $310, upper quartile is $478)
| This county: | $362 |
| State: | $702 |
Estimated median house or condo value in 2022: $116,006 (it was $47,100 in 2000)
| Menifee: | $116,006 |
| Kentucky: | $196,300 |
Mean price in 2022:
Median monthly housing costs for homes and condos with a mortgage: $827Detached houses: $195,443
Here: $195,443 State: $256,452 Townhouses or other attached units: $61,412
Here: $61,412 State: $264,090 Mobile homes: $83,599
Here: $83,599 State: $84,635
Median monthly housing costs for units without a mortgage: $338
Institutionalized population: 75
Crime in 2021 (reported by the sheriff's office or county police, not the county total):
- Murders: 0
- Rapes: 0
- Robberies: 0
- Assaults: 2
- Burglaries: 3
- Thefts: 1
- Auto thefts: 6
Crime in 2020 (reported by the sheriff's office or county police, not the county total):
- Murders: 0
- Rapes: 0
- Robberies: 0
- Assaults: 0
- Burglaries: 2
- Thefts: 5
- Auto thefts: 3
Median real estate property taxes paid for housing units with mortgages in 2022: $677 (0.6%)
Median real estate property taxes paid for housing units with no mortgage in 2022: $492 (0.4%)


| Menifee County: | 27.5% |
| Kentucky: | 16.5% |
Median age of residents in 2022: 43.7 years old
(Males: 41.4 years old, Females: 45.5 years old)
(Median age for: White residents: 44.8 years old, Black residents: 22.1 years old, Hispanic or Latino residents: 33.7 years old)
Fair market rent in 2006 for a 1-bedroom apartment in Menifee County is $365 a month.
Fair market rent for a 2-bedroom apartment is $450 a month.
Fair market rent for a 3-bedroom apartment is $562 a month.
Cities in this county include: Frenchburg.
Neighboring counties: Butler County, Kansas  , Botetourt County, Virginia
  , Las Animas County, Colorado , Northampton County, Virginia , Westmoreland County, Virginia , Harrisonburg city, Virginia .
| Here: | 5.9% |
| Kentucky: | 3.8% |


Current college students: 177
People 25 years of age or older with a high school degree or higher: 79.7%
People 25 years of age or older with a bachelor's degree or higher: 10.8%
Number of foreign born residents: 25 (105.1% naturalized citizens)
| Menifee County: | 0.4% |
| Whole state: | 4.0% |

- Year of entry for the foreign-born population
- 122010 or later
- 122000 to 2009
- 01990 to 1999
- 01980 to 1989
- 01970 to 1979
- 9Before 1970
Mean travel time to work (commute): ) minutes
Percentage of county residents living and working in this county: 100.2%
Housing units in structures:
- One, detached: 2,597
- One, attached: 20
- Two: 6
- 3 or 4: 45
- 5 to 9: 38
- 20 or more: 9
- Mobile homes: 734
- Boats, RVs, vans, etc.: 6
Housing units in Menifee County with a mortgage: 647 (53 second mortgage, 0 home equity loan, 13 both second mortgage and home equity loan)
Houses without a mortgage: 0
| Here: | 100.0% with mortgage |
| State: | 96.8% with mortgage |
Religion statistics for Menifee County
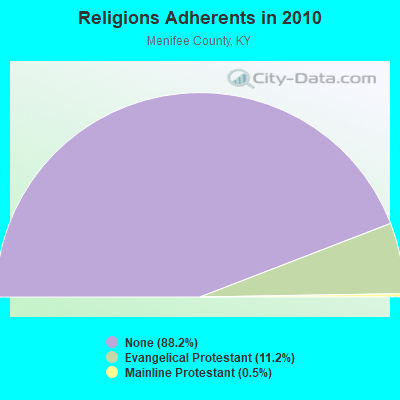
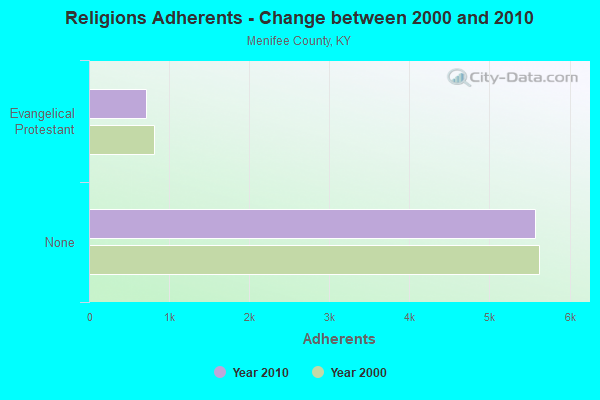
| Religion | Adherents | Congregations |
|---|---|---|
| Evangelical Protestant | 708 | 8 |
| Mainline Protestant | 34 | 1 |
| None | 5,564 | - |
Source: Clifford Grammich, Kirk Hadaway, Richard Houseal, Dale E.Jones, Alexei Krindatch, Richie Stanley and Richard H.Taylor. 2012. 2010 U.S.Religion Census: Religious Congregations & Membership Study. Association of Statisticians of American Religious Bodies. Jones, Dale E., et al. 2002. Congregations and Membership in the United States 2000. Nashville, TN: Glenmary Research Center.
Food Environment Statistics:
| Menifee County: | 5.93 / 10,000 pop. |
| State: | 2.19 / 10,000 pop. |
| Menifee County: | 8.90 / 10,000 pop. |
| Kentucky: | 4.36 / 10,000 pop. |
| Menifee County: | 13.2% |
| Kentucky: | 11.0% |
| Menifee County: | 31.8% |
| State: | 30.0% |
| Here: | 13.2% |
| State: | 15.9% |
Agriculture in Menifee County:
Average size of farms: 111 acresAverage value of agricultural products sold per farm: $7,759
Average value of crops sold per acre for harvested cropland: $249.08
The value of nursery, greenhouse, floriculture, and sod as a percentage of the total market value of agricultural products sold: 0.42%
The value of livestock, poultry, and their products as a percentage of the total market value of agricultural products sold: 33.39%
Average total farm production expenses per farm: $6,896
Harvested cropland as a percentage of land in farms: 18.73%
Irrigated harvested cropland as a percentage of land in farms: 0.25%
Average market value of all machinery and equipment per farm: $16,653
The percentage of farms operated by a family or individual: 94.61%
Average age of principal farm operators: 52 years
Average number of cattle and calves per 100 acres of all land in farms: 10.37
Corn for grain: 324 harvested acres
Vegetables: 23 harvested acres
Land in orchards: 2 acres
Earthquake activity:
Menifee County-area historical earthquake activity is significantly above Kentucky state average. It is 45% greater than the overall U.S. average.On 7/27/1980 at 18:52:21, a magnitude 5.2 (5.1 MB, 4.7 MS, 5.0 UK, 5.2 UK, Class: Moderate, Intensity: VI - VII) earthquake occurred 25.5 miles away from Menifee County center
On 9/7/1988 at 02:28:09, a magnitude 4.6 (4.5 MB, 4.6 LG, Class: Light, Intensity: IV - V) earthquake occurred 20.0 miles away from the county center
On 8/9/2020 at 12:07:37, a magnitude 5.1 (5.1 MW, Depth: 4.7 mi) earthquake occurred 171.8 miles away from the county center
On 8/23/2011 at 17:51:04, a magnitude 5.8 (5.8 MW, Depth: 3.7 mi) earthquake occurred 308.8 miles away from the county center
On 4/18/2008 at 09:36:59, a magnitude 5.4 (5.1 MB, 4.8 MS, 5.4 MW, 5.2 MW) earthquake occurred 235.6 miles away from Menifee County center
On 4/18/2008 at 09:36:59, a magnitude 5.2 (5.2 MW, Depth: 8.9 mi) earthquake occurred 235.6 miles away from the county center
Magnitude types: regional Lg-wave magnitude (LG), body-wave magnitude (MB), surface-wave magnitude (MS), moment magnitude (MW)
Most recent natural disasters:
- Kentucky Severe Storms, Flooding, Landslides, And Mudslides, Incident Period: February 3, 2020 - February 29, 2020, Major Disaster (Presidential) Declared DR-4540-KY: April 24, 2020, FEMA Id: 4540, Natural disaster type: Storm, Mudslide, Landslide, Flood
- Kentucky Covid-19 Pandemic, Incident Period: January 20, 2020, FEMA Id: 4497, Natural disaster type: Other
- Kentucky Severe Storms, Tornadoes, Straight-line Winds, Flooding, Landslides, and Mudslides, Incident Period: July 11, 2015 to July 20, 2015, Major Disaster (Presidential) Declared DR-4239: August 12, 2015, FEMA Id: 4239, Natural disaster type: Storm, Tornado, Mudslide, Landslide, Flood, Wind
- Kentucky Severe Winter Storm, Snowstorm, Flooding, Landslides, and Mudslides, Incident Period: March 03, 2015 to March 09, 2015, Major Disaster (Presidential) Declared DR-4218: May 12, 2015, FEMA Id: 4218, Natural disaster type: Snowstorm, Winter Storm, Mudslide, Landslide, Flood
- Kentucky Severe Winter Storms, Snowstorms, Flooding, Landslides, and Mudslides, Incident Period: February 15, 2015 to February 23, 2015, Major Disaster (Presidential) Declared DR-4216: April 30, 2015, FEMA Id: 4216, Natural disaster type: Snowstorm, Winter Storm, Mudslide, Landslide, Flood
- Kentucky Severe Storms, Tornadoes, Straight-line Winds, and Flooding, Incident Period: February 29, 2012 to March 03, 2012, Major Disaster (Presidential) Declared DR-4057: March 06, 2012, FEMA Id: 4057, Natural disaster type: Storm, Tornado, Flood, Wind
- Kentucky Severe Storms, Tornadoes, and Flooding, Incident Period: April 12, 2011 to May 20, 2011, Major Disaster (Presidential) Declared DR-1976: May 04, 2011, FEMA Id: 1976, Natural disaster type: Storm, Tornado, Flood
- Kentucky Severe Storms, Flooding, Mudslides, and Tornadoes, Incident Period: May 01, 2010 to June 01, 2010, Major Disaster (Presidential) Declared DR-1912: May 11, 2010, FEMA Id: 1912, Natural disaster type: Storm, Tornado, Mudslide, Flood
- Kentucky Severe Winter Storm, Incident Period: January 27, 2009 to February 05, 2009, Emergency Declared EM-3302: January 28, 2009, FEMA Id: 3302, Natural disaster type: Winter Storm
- Kentucky Severe Winter Storm and Flooding, Incident Period: January 26, 2009 to February 13, 2009, Major Disaster (Presidential) Declared DR-1818: February 05, 2009, FEMA Id: 1818, Natural disaster type: Winter Storm, Flood
- 10 other natural disasters have been reported since 1953.
The number of natural disasters in Menifee County (20) is greater than the US average (15).
Major Disasters (Presidential) Declared: 16
Emergencies Declared: 3
Causes of natural disasters: Floods: 12, Storms: 10, Winter Storms: 7, Mudslides: 6, Tornadoes: 5, Landslides: 4, Snowstorms: 2, Winds: 2, Blizzard: 1, Freeze: 1, Hurricane: 1, Snow: 1, Snowfall: 1, Other: 1 (Note: some incidents may be assigned to more than one category).

Means of transportation to work:
- Drove a car alone: 694 (66.8%)
- Carpooled: 73 (7.0%)
- Walked: 5 (0.5%)
- Worked at home: 320 (30.8%)


- Health care and social assistance (26%)
- Manufacturing (14%)
- Retail trade (11%)
- Educational services (6%)
- Wholesale trade (6%)
- Public administration (5%)
- Transportation and warehousing (4%)

- Health care and social assistance (29%)
- Manufacturing (16%)
- Retail trade (13%)
- Educational services (7%)
- Wholesale trade (6%)
- Public administration (5%)
- Transportation and warehousing (5%)

- Construction and extraction occupations (20%)
- Production occupations (15%)
- Management occupations (13%)
- Sales and related occupations (11%)
- Installation, maintenance, and repair occupations (6%)
- Transportation occupations (6%)
- Computer and mathematical occupations (5%)

- Office and administrative support occupations (26%)
- Sales and related occupations (18%)
- Health technologists and technicians (8%)
- Material moving occupations (7%)
- Production occupations (7%)
- Health diagnosing and treating practitioners and other technical occupations (6%)
- Educational instruction, and library occupations (5%)

- Peru (54%)
- Russia (38%)
- Sudan (4%)
- Norway (0%)
- Sweden (0%)
- United Kingdom, excluding England and Scotland (0%)
- England (0%)

- American (71%)
- English (9%)
- Irish (2%)
- German (2%)
- Italian (1%)
- Scottish (1%)
- Scotch-Irish (1%)


People in group quarters in Menifee County, Kentucky in 2010:
- 155 people in workers' group living quarters and job corps centers
- 69 people in nursing facilities/skilled-nursing facilities
- 6 people in correctional facilities intended for juveniles
People in group quarters in Menifee County, Kentucky in 2000:
- 168 people in job corps and vocational training facilities
- 65 people in nursing homes
- 10 people in training schools for juvenile delinquents
9.37% of this county's 2021 resident taxpayers lived in other counties in 2020 ($38,151 average adjusted gross income)
| Here: | 9.37% |
| Kentucky average: | 7.04% |
10 or fewer of this county's residents moved from foreign countries.
7.41% relocated from other counties in Kentucky ($28,182 average AGI)
1.95% relocated from other states ($9,969 average AGI)
Menifee County: 1.95% Kentucky average: 2.87%

Top counties from which taxpayers relocated into this county between 2020 and 2021:
| from Montgomery County, KY | |
| from Bath County, KY |
6.77% of this county's 2020 resident taxpayers moved to other counties in 2021 ($31,911 average adjusted gross income)
| Here: | 6.77% |
| Kentucky average: | 6.89% |
10 or fewer of this county's residents moved to foreign countries.
6.77% relocated to other counties in Kentucky ($31,911 average AGI)
10 or fewer of this county's residents relocated to other states.

Top counties to which taxpayers relocated from this county between 2020 and 2021:
| to Montgomery County, KY |
Births per 1000 population from 1990 to 1999: 12.2
Births per 1000 population from 2000 to 2006: 11.6

Deaths per 1000 population from 1990 to 1999: 9.9
Deaths per 1000 population from 2000 to 2009: 10.0
Deaths per 1000 population from 2010 to 2020: 12.8

Infant deaths per 1000 live births from 1990 to 1999: 9.5
Infant deaths per 1000 live births from 2000 to 2006: 10.1

Persons under 19 years old without health insurance coverage in 2018: 3.9%


Persons enrolled in hospital insurance and/or supplemental medical insurance (Medicare) in July 1, 2007: 1,353 (899 aged, 454 disabled)
Children under 18 without health insurance coverage in 2007: 235 (17%)


Most common underlying causes of death in Menifee County, Kentucky in 1999 - 2019:
- Acute myocardial infarction, unspecified (78)
- Bronchus or lung, unspecified - Malignant neoplasms (55)
- Atherosclerotic heart disease (10)
Population without health insurance coverage in 2000: 19%
Children under 18 without health insurance coverage in 2000: 14%
Medical specialist MDs per 100,000 population in 2005: 925
Total births per 100,000 population, July 2005 - July 2006 : 17
Total deaths per 100,000 population, July 2005 - July 2006: 15
EPA green book nonattainment status in 2004-2006: 1
Crimes per 100,000 population in 1996: 1
Household type by relationship:
Households: 6,186- Male householders: 1,254 (379 living alone), Female householders: 1,073 (267 living alone)
1,212 spouses (1,212 opposite-sex spouses), 104 unmarried partners, (104 opposite-sex unmarried partners), 1,805 children (1,456 natural, 112 adopted, 232 stepchildren), 163 grandchildren, 128 brothers or sisters, 155 parents, 0 foster children, 37 other relatives, 108 non-relatives
- In group quarters: 104
Size of family households: 802 2-persons, 383 3-persons, 199 4-persons, 147 5-persons, 15 6-persons, 19 7-or-more-persons.
Size of nonfamily households: 646 1-person, 127 2-persons.
875 married couples with children.
300 single-parent households (37 men, 263 women).
97.8% of residents of Menifee speak English at home.
2.4% of residents speak Spanish at home (100% speak English very well).
In fiscal year 2004:
Federal Government expenditure: $55,744,000 ($8,239 per capita)
Department of Defense expenditure: $15,935,000
Federal direct payments to individuals for retirement and disability: $18,026,000
Federal other direct payments to individuals: $7,078,000
Federal direct payments not to individuals: $100,000
Federal grants: $10,913,000
Federal procurement contracts: $3,622,000 ($2,081,000 Department of Defense)
Federal salaries and wages: $16,005,000 ($13,569,000 Department of Defense)
Federal Government direct loans: $773,000
Federal guaranteed/insured loans: $1,034,000
Federal Government insurance: $447,000
Population change from April 1, 2000 to July 1, 2005:
Births: 437| Here: | 64 per 1000 residents |
| State: | 69 per 1000 residents |
Deaths: 310
| Here: | 46 per 1000 residents |
| State: | 50 per 1000 residents |
Net international migration: +4
| Here: | +1 per 1000 residents |
| State: | +7 per 1000 residents |
Net internal migration: +135
| Here: | +20 per 1000 residents |
| State: | +8 per 1000 residents |

Total withdrawal of fresh water for public supply: 0.00 millions of gallons per day (all from surface)
| Here: | 5.7 |
| State: | 6.4 |
| Here: | 5.0 |
| State: | 4.4 |

- Year house built in Menifee County, Kentucky
- 152020 or later
- 5272010 to 2019
- 5832000 to 2009
- 5811990 to 1999
- 7061980 to 1989
- 6561970 to 1979
- 1901960 to 1969
- 1001950 to 1959
- 411940 to 1949
- 1181939 or earlier

- Rooms in owner-occupied houses in Menifee County, Kentucky
- 01 room
- 02 rooms
- 583 rooms
- 1994 rooms
- 5145 rooms
- 4686 rooms
- 1777 rooms
- 1508 rooms
- 1769+ rooms

- Rooms in renter-occupied apartments in Menifee County, Kentucky
- 61 room
- 392 rooms
- 633 rooms
- 1014 rooms
- 1955 rooms
- 1146 rooms
- 337 rooms
- 188 rooms
- 269+ rooms

- Bedrooms in owner-occupied houses in Menifee County, Kentucky
- 0no bedroom
- 511 bedroom
- 4502 bedrooms
- 1,0083 bedrooms
- 1864 bedrooms
- 535+ bedrooms

- Bedrooms in renter-occupied apartments in Menifee County, Kentucky
- 7no bedroom
- 841 bedroom
- 1862 bedrooms
- 2493 bedrooms
- 554 bedrooms
- 05+ bedrooms

- Cars and other vehicles available in Menifee County in owner-occupied houses/condos
- 80no vehicle
- 4121 vehicle
- 7172 vehicles
- 3263 vehicles
- 904 vehicles
- 1155+ vehicles

- Cars and other vehicles available in Menifee County in renter-occupied apartments
- 73no vehicle
- 2211 vehicle
- 2552 vehicles
- 133 vehicles
- 244 vehicles
- 05+ vehicles
88.3% of Menifee County residents lived in the same house 1 years ago.
Out of people who lived in different houses, 24% lived in this county.
Out of people who lived in different counties, 85% lived in Kentucky.
| Menifee County: | 88.3% |
| State average: | 87.2% |
Place of birth for U.S.-born residents:
- This state: 4,611
- Other state: 1,539
- Northeast: 215
- Midwest: 783
- South: 432
- West: 105


- 53.7%Electricity
- 21.3%Bottled, tank, or LP gas
- 15.1%Utility gas
- 9.4%Wood
- 0.5%Other fuel

- 55.2%Electricity
- 19.1%Bottled, tank, or LP gas
- 17.2%Utility gas
- 8.5%Wood
Private vs. public school enrollment:
| Here: | 8.9% |
| Kentucky: | 17.2% |
| Here: | 14.2% |
| Kentucky: | 15.2% |
| Here: | 14.1% |
| Kentucky: | 19.6% |


Menifee County government finances - Expenditure in 2017:
- Bond Funds - Cash and Securities: $91,000
- Charges - Solid Waste Management: $187,000
Other: $96,000
Parks and Recreation: $11,000
- Construction - Regular Highways: $45,000
Parks and Recreation: $18,000
- Current Operations - General - Other: $1,163,000
Regular Highways: $773,000
Solid Waste Management: $231,000
Police Protection: $202,000
Central Staff Services: $182,000
General Public Buildings: $84,000
Correctional Institutions: $74,000
Parks and Recreation: $69,000
Financial Administration: $66,000
Health - Other: $41,000
Sewerage: $26,000
Judicial and Legal Services: $24,000
Local Fire Protection: $4,000
- Federal Intergovernmental - Other: $171,000
Health and Hospitals: $4,000
- General - Interest on Debt: $3,000
- Intergovernmental to Local - Other - Correctional Institutions: $142,000
Other - Sewerage: $5,000
- Local Intergovernmental - Highways: $5,000
Other: $5,000
- Long Term Debt - Beginning Outstanding - Unspecified Public Purpose: $85,000
Retired Unspecified Public Purpose: $85,000
- Miscellaneous - Rents: $59,000
General Revenue - Other: $34,000
Donations From Private Sources: $8,000
Sale of Property: $7,000
Interest Earnings: $1,000
- Other Capital Outlay - Solid Waste Management: $36,000
Regular Highways: $32,000
General - Other: $28,000
Central Staff Services: $1,000
- Other Funds - Cash and Securities: $686,000
- State Intergovernmental - Highways: $913,000
Other: $513,000
- Tax - Individual Income: $418,000
Insurance Premiums Sales: $348,000
Property: $228,000
Public Utilities Sales: $61,000
Documentary and Stock Transfer: $13,000
Corporation License: $7,000
- Total Salaries and Wages: $1,020,000
Menifee County government finances - Revenue in 2017:
- Bond Funds - Cash and Securities: $91,000
- Charges - Solid Waste Management: $187,000
Other: $96,000
Parks and Recreation: $11,000
- Construction - Regular Highways: $45,000
Parks and Recreation: $18,000
- Current Operations - General - Other: $1,163,000
Regular Highways: $773,000
Solid Waste Management: $231,000
Police Protection: $202,000
Central Staff Services: $182,000
General Public Buildings: $84,000
Correctional Institutions: $74,000
Parks and Recreation: $69,000
Financial Administration: $66,000
Health - Other: $41,000
Sewerage: $26,000
Judicial and Legal Services: $24,000
Local Fire Protection: $4,000
- Federal Intergovernmental - Other: $171,000
Health and Hospitals: $4,000
- General - Interest on Debt: $3,000
- Intergovernmental to Local - Other - Correctional Institutions: $142,000
Other - Sewerage: $5,000
- Local Intergovernmental - Highways: $5,000
Other: $5,000
- Long Term Debt - Beginning Outstanding - Unspecified Public Purpose: $85,000
Retired Unspecified Public Purpose: $85,000
- Miscellaneous - Rents: $59,000
General Revenue - Other: $34,000
Donations From Private Sources: $8,000
Sale of Property: $7,000
Interest Earnings: $1,000
- Other Capital Outlay - Solid Waste Management: $36,000
Regular Highways: $32,000
General - Other: $28,000
Central Staff Services: $1,000
- Other Funds - Cash and Securities: $686,000
- State Intergovernmental - Highways: $913,000
Other: $513,000
- Tax - Individual Income: $418,000
Insurance Premiums Sales: $348,000
Property: $228,000
Public Utilities Sales: $61,000
Documentary and Stock Transfer: $13,000
Corporation License: $7,000
- Total Salaries and Wages: $1,020,000
Menifee County government finances - Debt in 2017:
- Bond Funds - Cash and Securities: $91,000
- Charges - Solid Waste Management: $187,000
Other: $96,000
Parks and Recreation: $11,000
- Construction - Regular Highways: $45,000
Parks and Recreation: $18,000
- Current Operations - General - Other: $1,163,000
Regular Highways: $773,000
Solid Waste Management: $231,000
Police Protection: $202,000
Central Staff Services: $182,000
General Public Buildings: $84,000
Correctional Institutions: $74,000
Parks and Recreation: $69,000
Financial Administration: $66,000
Health - Other: $41,000
Sewerage: $26,000
Judicial and Legal Services: $24,000
Local Fire Protection: $4,000
- Federal Intergovernmental - Other: $171,000
Health and Hospitals: $4,000
- General - Interest on Debt: $3,000
- Intergovernmental to Local - Other - Correctional Institutions: $142,000
Other - Sewerage: $5,000
- Local Intergovernmental - Highways: $5,000
Other: $5,000
- Long Term Debt - Beginning Outstanding - Unspecified Public Purpose: $85,000
Retired Unspecified Public Purpose: $85,000
- Miscellaneous - Rents: $59,000
General Revenue - Other: $34,000
Donations From Private Sources: $8,000
Sale of Property: $7,000
Interest Earnings: $1,000
- Other Capital Outlay - Solid Waste Management: $36,000
Regular Highways: $32,000
General - Other: $28,000
Central Staff Services: $1,000
- Other Funds - Cash and Securities: $686,000
- State Intergovernmental - Highways: $913,000
Other: $513,000
- Tax - Individual Income: $418,000
Insurance Premiums Sales: $348,000
Property: $228,000
Public Utilities Sales: $61,000
Documentary and Stock Transfer: $13,000
Corporation License: $7,000
- Total Salaries and Wages: $1,020,000
Menifee County government finances - Cash and Securities in 2017:
- Bond Funds - Cash and Securities: $91,000
- Charges - Solid Waste Management: $187,000
Other: $96,000
Parks and Recreation: $11,000
- Construction - Regular Highways: $45,000
Parks and Recreation: $18,000
- Current Operations - General - Other: $1,163,000
Regular Highways: $773,000
Solid Waste Management: $231,000
Police Protection: $202,000
Central Staff Services: $182,000
General Public Buildings: $84,000
Correctional Institutions: $74,000
Parks and Recreation: $69,000
Financial Administration: $66,000
Health - Other: $41,000
Sewerage: $26,000
Judicial and Legal Services: $24,000
Local Fire Protection: $4,000
- Federal Intergovernmental - Other: $171,000
Health and Hospitals: $4,000
- General - Interest on Debt: $3,000
- Intergovernmental to Local - Other - Correctional Institutions: $142,000
Other - Sewerage: $5,000
- Local Intergovernmental - Highways: $5,000
Other: $5,000
- Long Term Debt - Beginning Outstanding - Unspecified Public Purpose: $85,000
Retired Unspecified Public Purpose: $85,000
- Miscellaneous - Rents: $59,000
General Revenue - Other: $34,000
Donations From Private Sources: $8,000
Sale of Property: $7,000
Interest Earnings: $1,000
- Other Capital Outlay - Solid Waste Management: $36,000
Regular Highways: $32,000
General - Other: $28,000
Central Staff Services: $1,000
- Other Funds - Cash and Securities: $686,000
- State Intergovernmental - Highways: $913,000
Other: $513,000
- Tax - Individual Income: $418,000
Insurance Premiums Sales: $348,000
Property: $228,000
Public Utilities Sales: $61,000
Documentary and Stock Transfer: $13,000
Corporation License: $7,000
- Total Salaries and Wages: $1,020,000
Supplemental Security Income (SSI) in 2006:
- Total number of recipients: 595
- Number of aged recipients: 48
- Number of blind and disabled recipients: 547
- Number of recipients under 18: 78
- Number of recipients between 18 and 64: 403
- Number of recipients older than 64: 114
- Number of recipients also receiving OASDI: 202
- Amount of payments (thousands of dollars): 264
| Most common first names in Menifee County, KY among deceased individuals | ||
| Name | Count | Lived (average) |
|---|---|---|
| William | 23 | 75.7 years |
| James | 22 | 70.8 years |
| John | 20 | 79.5 years |
| Charles | 17 | 70.2 years |
| Mary | 13 | 82.3 years |
| Robert | 13 | 70.7 years |
| Paul | 8 | 73.3 years |
| Chester | 7 | 77.8 years |
| Edna | 7 | 80.7 years |
| George | 7 | 87.0 years |
| Most common last names in Menifee County, KY among deceased individuals | ||
| Last name | Count | Lived (average) |
|---|---|---|
| Brown | 30 | 74.9 years |
| Wells | 22 | 78.4 years |
| Ingram | 14 | 79.8 years |
| Williams | 14 | 77.8 years |
| Sorrell | 13 | 77.9 years |
| Conway | 13 | 75.1 years |
| Morrison | 12 | 66.3 years |
| Spencer | 11 | 78.2 years |
| Smith | 11 | 76.6 years |
| Johnson | 10 | 79.1 years |
Businesses in Menifee County, KY
- Subway: 1
Menifee County on our top lists:
- #64 on the list of "Top 101 counties with the smallest number of people without health insurance coverage in 2000"
- #68 on the list of "Top 101 counties with the smallest number of children under 18 without health insurance coverage in 2000"