Estimated zip code population in 2022: 51,803 Zip code population in 2010: 45,023 Zip code population in 2000: 42,671
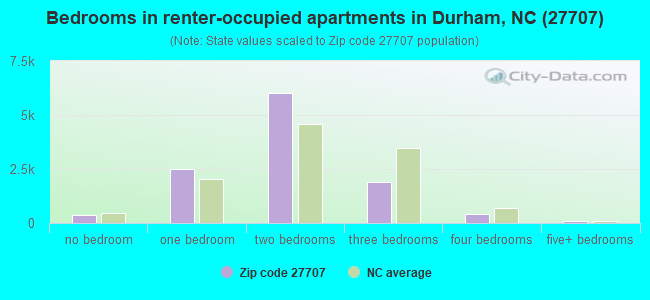
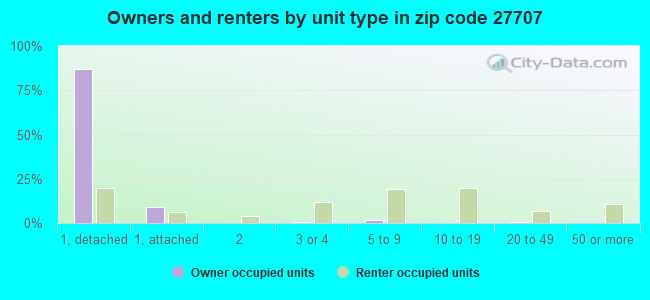
Houses and condos: 23,948 Renter-occupied apartments: 11,327
% of renters here:
51%
State:
33%
March 2022 cost of living index in zip code 27707: 94.9 (less than average, U.S. average is 100)
Land area: 21.3 sq. mi. Water area: 0.1 sq. mi.
Population density: 2,434 people per square mile
(low).
OSM Map
General Map
Google Map
MSN Map
OSM Map
General Map
Google Map
MSN Map
OSM Map
General Map
Google Map
MSN Map
OSM Map
General Map
Google Map
MSN Map
Please wait while loading the map...
Real estate property taxes paid for housing units in 2022:
This zip code:
0.9% ($3,283)
North Carolina:
0.6% ($1,769)
Median real estate property taxes paid for housing units with mortgages in 2022: $3,404 (0.8%) Median real estate property taxes paid for housing units with no mortgage in 2022: $2,871 (0.9%)
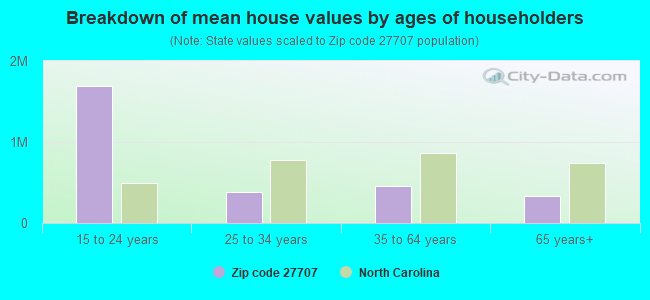
Estimated median house/condo value in 2022: $382,973
27707:
$382,973
North Carolina:
$280,600
According to our research of North Carolina and other state lists, there were 38 registered sex offenders living in 27707 zip code as of July 03, 2024. The ratio of all residents to sex offenders in zip code 27707 is 1,336 to 1. The ratio of registered sex offenders to all residents in this zip code is much lower than the state average.
Median resident age:
This zip code:
34.9 years
North Carolina median age:
39.2 years
Average household size:
This zip code:
2.2 people
North Carolina:
2.4 people
Averages for the 2020 tax year for zip code 27707, filed in 2021:
Average Adjusted Gross Income (AGI) in 2020: $79,193 (Individual Income Tax Returns)
Here:
$79,193
State:
$70,020
Salary/wage: $61,792 (reported on 84.2% of returns)
Here:
$61,792
State:
$58,387
(% of AGI for various income ranges: 1261.3% for AGIs below $25k, 4012.2% for AGIs $25k-50k, 7110.8% for AGIs $50k-75k, 11052.7% for AGIs $75k-100k, 19907.8% for AGIs $100k-200k, 100232.4% for AGIs over 200k)
Taxable interest for individuals: $1,694 (reported on 29.4% of returns)
This zip code:
$1,694
North Carolina:
$1,479
(% of AGI for various income ranges: 7.8% for AGIs below $25k, 12.8% for AGIs $25k-50k, 33.1% for AGIs $50k-75k, 50.8% for AGIs $75k-100k, 158.3% for AGIs $100k-200k, 1738.3% for AGIs over 200k)
Ordinary dividends: $11,336 (reported on 21.8% of returns)
Here:
$11,336
State:
$7,888
(% of AGI for various income ranges: 27.4% for AGIs below $25k, 37.1% for AGIs $25k-50k, 109.5% for AGIs $50k-75k, 261.4% for AGIs $75k-100k, 701.2% for AGIs $100k-200k, 9659.0% for AGIs over 200k)
Net capital gain/loss in AGI: +$32,073 (reported on 19.9% of returns)
Here:
+$32,073
State:
+$23,652
(% of AGI for various income ranges: 12.4% for AGIs below $25k, 29.5% for AGIs $25k-50k, 116.8% for AGIs $50k-75k, 330.9% for AGIs $75k-100k, 851.2% for AGIs $100k-200k, 31371.2% for AGIs over 200k)
Profit/loss from business: +$16,621 (reported on 19.7% of returns)
Here:
+$16,621
State:
+$11,710
(% of AGI for various income ranges: 150.9% for AGIs below $25k, 130.0% for AGIs $25k-50k, 191.8% for AGIs $50k-75k, 402.4% for AGIs $75k-100k, 1103.1% for AGIs $100k-200k, 9300.5% for AGIs over 200k)
Taxable individual retirement arrangement distribution: $25,482 (reported on 6.8% of returns)
27707:
$25,482
North Carolina:
$20,247
(% of AGI for various income ranges: 29.6% for AGIs below $25k, 53.5% for AGIs $25k-50k, 189.0% for AGIs $50k-75k, 393.1% for AGIs $75k-100k, 953.2% for AGIs $100k-200k, 3599.8% for AGIs over 200k)
Self-employed (Keogh) retirement plans: $33,364 (reported on 1.8% of returns)
27707:
$33,364
North Carolina:
$26,749
(% of AGI for various income ranges: 22.7% for AGIs $50k-75k, 111.0% for AGIs $100k-200k, 2923.4% for AGIs over 200k)
Total itemized deductions: $34,607 (reported on 10.0% of returns)
Here:
$34,607
State:
$34,549
(% of AGI for various income ranges: 47.2% for AGIs below $25k, 116.6% for AGIs $25k-50k, 321.7% for AGIs $50k-75k, 735.2% for AGIs $75k-100k, 1356.7% for AGIs $100k-200k, 9672.2% for AGIs over 200k)
Charity contributions: $14,041 (reported on 8.7% of returns)
Here:
$14,041
State:
$13,360
(% of AGI for various income ranges: 4.9% for AGIs below $25k, 23.9% for AGIs $25k-50k, 65.6% for AGIs $50k-75k, 161.6% for AGIs $75k-100k, 377.0% for AGIs $100k-200k, 4579.0% for AGIs over 200k)
Taxes paid: $8,010 (reported on 10.0% of returns)
27707:
$8,010
State:
$7,586
(% of AGI for various income ranges: 7.5% for AGIs below $25k, 19.9% for AGIs $25k-50k, 81.1% for AGIs $50k-75k, 212.0% for AGIs $75k-100k, 417.2% for AGIs $100k-200k, 1889.3% for AGIs over 200k)
Earned income credit: $2,136 (reported on 17.6% of returns)
Here:
$2,136
State:
$2,337
(% of AGI for various income ranges: 105.1% for AGIs below $25k, 58.5% for AGIs $25k-50k, 0.4% for AGIs $50k-75k)
Percentage of individuals using paid preparers for their 2020 taxes: 89.9%
Here:
90%
State:
93%
(% for various income ranges: 87.3% for AGIs below $25k, 90.3% for AGIs $25k-50k, 90.8% for AGIs $50k-75k, 90.1% for AGIs $75k-100k, 92.6% for AGIs $100k-200k, 94.3% for AGIs over 200k)
Averages for the 2012 tax year for zip code 27707, filed in 2013:
Average Adjusted Gross Income (AGI) in 2012: $65,452 (Individual Income Tax Returns)
Here:
$65,452
State:
$54,937
Salary/wage: $50,702 (reported on 86.5% of returns)
Here:
$50,702
State:
$46,336
(% of AGI for various income ranges: 81.8% for AGIs below $25k, 86.0% for AGIs $25k-50k, 78.0% for AGIs $50k-75k, 74.3% for AGIs $75k-100k, 73.3% for AGIs $100k-200k, 50.4% for AGIs over 200k)
Taxable interest for individuals: $1,855 (reported on 30.6% of returns)
This zip code:
$1,855
North Carolina:
$1,298
(% of AGI for various income ranges: 0.5% for AGIs below $25k, 0.4% for AGIs $25k-50k, 0.7% for AGIs $50k-75k, 0.8% for AGIs $75k-100k, 0.6% for AGIs $100k-200k, 1.3% for AGIs over 200k)
Ordinary dividends: $9,041 (reported on 19.7% of returns)
Here:
$9,041
State:
$6,213
(% of AGI for various income ranges: 1.3% for AGIs below $25k, 0.9% for AGIs $25k-50k, 1.8% for AGIs $50k-75k, 2.3% for AGIs $75k-100k, 2.8% for AGIs $100k-200k, 4.0% for AGIs over 200k)
Net capital gain/loss in AGI: +$34,864 (reported on 15.9% of returns)
Here:
+$34,864
State:
+$12,740
(% of AGI for various income ranges: 0.2% for AGIs below $25k, 0.3% for AGIs $25k-50k, 1.2% for AGIs $50k-75k, 1.1% for AGIs $75k-100k, 1.8% for AGIs $100k-200k, 19.3% for AGIs over 200k)
Profit/loss from business: +$15,722 (reported on 17.1% of returns)
Here:
+$15,722
State:
+$10,311
(% of AGI for various income ranges: 6.9% for AGIs below $25k, 2.1% for AGIs $25k-50k, 2.7% for AGIs $50k-75k, 2.5% for AGIs $75k-100k, 3.5% for AGIs $100k-200k, 5.2% for AGIs over 200k)
Taxable individual retirement arrangement distribution: $22,132 (reported on 7.4% of returns)
27707:
$22,132
North Carolina:
$15,575
(% of AGI for various income ranges: 1.4% for AGIs below $25k, 1.3% for AGIs $25k-50k, 2.8% for AGIs $50k-75k, 3.3% for AGIs $75k-100k, 4.2% for AGIs $100k-200k, 2.2% for AGIs over 200k)
Self-employment retirement plans: $27,643 (reported on 1.4% of returns)
27707:
$27,643
North Carolina:
$21,078
(% of AGI for various income ranges: 0.4% for AGIs $100k-200k, 1.3% for AGIs over 200k)
Total itemized deductions: $27,610 (19% of AGI, reported on 32.2% of returns)
Here:
$27,610
State:
$23,438
Here:
18.6% of AGI
State:
21.5% of AGI
(% of AGI for various income ranges: 8.0% for AGIs below $25k, 9.3% for AGIs $25k-50k, 16.0% for AGIs $50k-75k, 17.2% for AGIs $75k-100k, 18.0% for AGIs $100k-200k, 13.1% for AGIs over 200k)
Charity contributions: $5,698 (reported on 27.9% of returns)
Here:
$5,698
State:
$4,687
(% of AGI for various income ranges: 0.9% for AGIs below $25k, 1.6% for AGIs $25k-50k, 2.7% for AGIs $50k-75k, 2.8% for AGIs $75k-100k, 3.1% for AGIs $100k-200k, 2.7% for AGIs over 200k)
Taxes paid: $12,690 (reported on 32.1% of returns)
27707:
$12,690
State:
$8,823
(% of AGI for various income ranges: 1.5% for AGIs below $25k, 2.9% for AGIs $25k-50k, 5.4% for AGIs $50k-75k, 6.7% for AGIs $75k-100k, 8.2% for AGIs $100k-200k, 7.7% for AGIs over 200k)
Earned income credit: $2,443 (reported on 21.6% of returns)
Here:
$2,443
State:
$2,376
(% of AGI for various income ranges: 7.9% for AGIs below $25k, 0.9% for AGIs $25k-50k)
Percentage of individuals using paid preparers for their 2012 taxes: 46.2%
Here:
46%
State:
53%
(% for various income ranges: 48.2% for AGIs below $25k, 39.4% for AGIs $25k-50k, 42.1% for AGIs $50k-75k, 44.9% for AGIs $75k-100k, 48.9% for AGIs $100k-200k, 75.3% for AGIs over 200k)
Averages for the 2004 tax year for zip code 27707, filed in 2005:
Average Adjusted Gross Income (AGI) in 2004: $51,893 (Individual Income Tax Returns)
Here:
$51,893
State:
$45,376
Salary/wage: $43,093 (reported on 85.1% of returns)
Here:
$43,093
State:
$39,442
(% of AGI for various income ranges: 162.8% for AGIs below $10k, 84.8% for AGIs $10k-25k, 86.0% for AGIs $25k-50k, 77.6% for AGIs $50k-75k, 77.2% for AGIs $75k-100k, 58.0% for AGIs over 100k)
Taxable interest for individuals: $1,679 (reported on 39.5% of returns)
This zip code:
$1,679
North Carolina:
$1,515
(% of AGI for various income ranges: 7.2% for AGIs below $10k, 0.9% for AGIs $10k-25k, 0.9% for AGIs $25k-50k, 1.5% for AGIs $50k-75k, 1.2% for AGIs $75k-100k, 1.3% for AGIs over 100k)
Taxable dividends: $6,643 (reported on 24.9% of returns)
Here:
$6,643
State:
$4,016
(% of AGI for various income ranges: 11.2% for AGIs below $10k, 1.1% for AGIs $10k-25k, 1.3% for AGIs $25k-50k, 2.0% for AGIs $50k-75k, 2.3% for AGIs $75k-100k, 4.5% for AGIs over 100k)
Net capital gain/loss: +$12,550 (reported on 20.4% of returns)
Here:
+$12,550
State:
+$11,152
(% of AGI for various income ranges: -0.5% for AGIs below $10k, 0.5% for AGIs $10k-25k, 0.8% for AGIs $25k-50k, 1.4% for AGIs $50k-75k, 1.4% for AGIs $75k-100k, 8.8% for AGIs over 100k)
Profit/loss from business: +$13,510 (reported on 15.4% of returns)
Here:
+$13,510
State:
+$9,490
(% of AGI for various income ranges: 9.4% for AGIs below $10k, 2.9% for AGIs $10k-25k, 1.6% for AGIs $25k-50k, 2.7% for AGIs $50k-75k, 3.3% for AGIs $75k-100k, 5.4% for AGIs over 100k)
Profit/loss from farming: +$1,542 (reported on 0.1% of returns)
Here:
+$1,542
State:
-$3,231
IRA payment deduction: $2,780 (reported on 2.1% of returns)
27707:
$2,780
North Carolina:
$2,967
(% of AGI for various income ranges: 0.6% for AGIs below $10k, 0.1% for AGIs $10k-25k, 0.2% for AGIs $25k-50k, 0.1% for AGIs $50k-75k, 0.1% for AGIs $75k-100k, 0.1% for AGIs over 100k)
Self-employed pension: $17,065 (reported on 1.9% of returns)
Here:
$17,065
North Carolina:
$14,754
(% of AGI for various income ranges: 0.1% for AGIs $25k-50k, 0.1% for AGIs $50k-75k, 0.3% for AGIs $75k-100k, 1.1% for AGIs over 100k)
Total itemized deductions: $21,971 (22% of AGI, reported on 38.3% of returns)
Here:
$21,971
State:
$19,464
Here:
21.6% of AGI
State:
22.7% of AGI
(% of AGI for various income ranges: 23.3% for AGIs below $10k, 10.2% for AGIs $10k-25k, 14.4% for AGIs $25k-50k, 20.0% for AGIs $50k-75k, 20.3% for AGIs $75k-100k, 16.1% for AGIs over 100k)
Charity contributions deductions: $4,888 (5% of AGI, reported on 34.2% of returns)
Here:
$4,888
State:
$4,035
Here:
4.5% of AGI
State:
4.5% of AGI
(% of AGI for various income ranges: 2.2% for AGIs below $10k, 1.3% for AGIs $10k-25k, 2.5% for AGIs $25k-50k, 3.5% for AGIs $50k-75k, 3.8% for AGIs $75k-100k, 3.7% for AGIs over 100k)
Total tax: $10,460 (reported on 69.3% of returns)
27707:
$10,460
State:
$7,257
(% of AGI for various income ranges: 5.0% for AGIs below $10k, 3.3% for AGIs $10k-25k, 6.8% for AGIs $25k-50k, 9.9% for AGIs $50k-75k, 11.0% for AGIs $75k-100k, 20.1% for AGIs over 100k)
Earned income credit: $1,848 (reported on 18.7% of returns)
Here:
$1,848
State:
$1,851
Percentage of individuals using paid preparers for their 2004 taxes: 50.5%
Here:
51%
State:
62%
(% for various income ranges: 45.8% for AGIs below $10k, 55.9% for AGIs $10k-25k, 45.7% for AGIs $25k-50k, 48.7% for AGIs $50k-75k, 47.6% for AGIs $75k-100k, 61.2% for AGIs over 100k)
Likely homosexual households (counted as self-reported same-sex unmarried-partner households)
Lesbian couples: 0.2% of all households
Gay men: 0.3% of all households
Household received Food Stamps/SNAP in the past 12 months: 2,138 Household did not receive Food Stamps/SNAP in the past 12 months: 19,987
Women who had a birth in the past 12 months: 447 (282 now married, 163 unmarried) Women who did not have a birth in the past 12 months: 14,803 (4,411 now married, 10,349 unmarried)
Housing units in zip code 27707 with a mortgage: 7,407 (793 second mortgage, 763 both second mortgage and home equity loan) Houses without a mortgage: 221
Median monthly owner costs for units with a mortgage: $1,647 Median monthly owner costs for units without a mortgage: $572
Residents with income below the poverty level in 2022:
This zip code:
13.7%
Whole state:
12.8%
Residents with income below 50% of the poverty level in 2022:
This zip code:
6.3%
Whole state:
6.8%
Median number of rooms in houses and condos:
Here:
6.5
State:
6.4
Median number of rooms in apartments:
Here:
4.0
State:
4.4
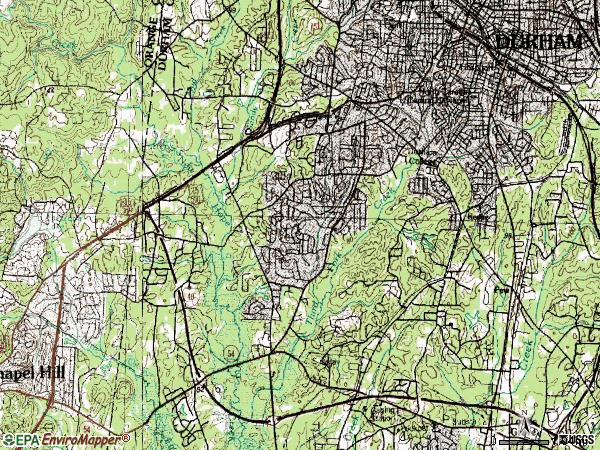
Notable locations in this zip code not listed on our city pages
Notable locations in zip code 27707: Hope Valley Country Club (A), Shannon Plaza (B), Walker Physical Education Complex (C), Cottage One (D), Turner Law Building (E), Childley Hall Dormitory (F), Taylor Education Building (G), Southwest Branch Durham County Public Library (H), Julius L Chambers Biomedical-Biotechnology Research Institute (I), Rush Dormitory (J), Baynes Dormitory (K), B N Duke Auditorium (L), Robinson Science Building (M), Annie Day Shepard Dormitory (N), American Red Cross (O), Alfonso Elder Student Union (P), Alexander-Dunn Building (Q), Lee Biology Building (R), Willis Commerce Building (S), William Jones Building (T). Display/hide their locations on the map
Shopping Centers: Lakewood Shopping Center (1), Forest Hill Shopping Center (2), Westgate Shopping Center (3), The Black Market Shopping Center (4), South Square Mall (5). Display/hide their locations on the map
Churches in zip code 27707 include: Youth Life Foundation of the Triangle (A), Yates Baptist Church (B), World Overcomers Christian Ministries (C), Solid Rock Full Gospel Church (D), Salvation Is Free Holy Church (E), Saint Josephs African Methodist Episcopal Church (F), Resurrection United Methodist Church (G), Pilgrim United Church of Christ (H), Pilgrim Baptist Church (I). Display/hide their locations on the map
5,336 married couples with children.
3,622 single-parent households (902 men, 2,720 women).
79.1% of residents of 27707 zip code speak English at home.
12.9% of residents speak Spanish at home (46% very well, 10% well, 15% not well, 30% not at all).
3.3% of residents speak other Indo-European language at home (90% very well, 8% well, 3% not well).
3.2% of residents speak Asian or Pacific Island language at home (73% very well, 22% well, 4% not well, 2% not at all).
2.2% of residents speak other language at home (64% very well, 19% well, 2% not well, 15% not at all).
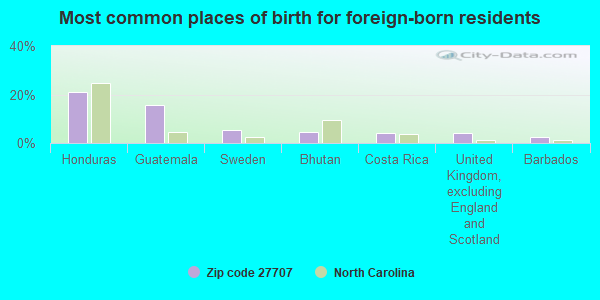
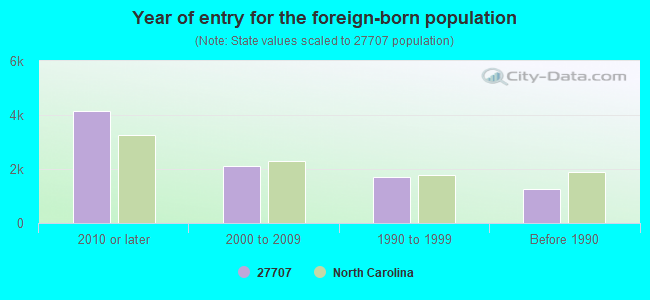
Foreign born population: 8,277 (16.0%) (37.4% of them are naturalized citizens)
Facilities with environmental interests located in this zip code:
BLAZEVICH, MARTIN - RESIDENCE (4522 FARRINGTON RD in DURHAM, NC)
STATE MASTER (North Carolina facility info) - -115DA4YG00M69W84AY3VR5MNSR, WASTEWATER FACILITY National Pollutant Discharge Elimination System NON-MAJOR (Tracking pollutant discharge elimination systems) - permit Business SIC classification: SEWERAGE SYSTEMS
CARY OIL COMPANY, INCORPORATED (1432 LAWSON STREET in DURHAM, NC)
STATE MASTER (North Carolina facility info) - UNDERGROUND STORAGE TANK PROGRAM, -115DA4YG00M69W84AY3YR05K8R, WASTEWATER FACILITY National Pollutant Discharge Elimination System NON-MAJOR (Tracking pollutant discharge elimination systems) - permit Business SIC classification: GASOLINE SERVICE STATIONS; NONCLASSIFIABLE ESTABLISHMENTS Alternative names: CARY OIL CO-TOWN N COUNTRY
CHAO, FENG LAN - RESIDENCE (4317 FARRINGTON ROAD in DURHAM, NC)
STATE MASTER (North Carolina facility info) - -115DA4YG00N29W84AY3V8F8DHX, WASTEWATER FACILITY National Pollutant Discharge Elimination System NON-MAJOR (Tracking pollutant discharge elimination systems) - permit Business SIC classification: SEWERAGE SYSTEMS
STATE MASTER (North Carolina facility info) - -115DA4YG00PXCD64FBEPG8D9H9, WASTEWATER FACILITY National Pollutant Discharge Elimination System NON-MAJOR (Tracking pollutant discharge elimination systems) - permit Business SIC classification: SEWERAGE SYSTEMS
DOUGHERTY-RESISDENCE (5 LITTLEWOODS LANE in DURHAM, NC)
STATE MASTER (North Carolina facility info) - -115DA4YG00TXXW64FBEP020CS8, WASTEWATER FACILITY National Pollutant Discharge Elimination System NON-MAJOR (Tracking pollutant discharge elimination systems) - permit Business SIC classification: SEWERAGE SYSTEMS Alternative names: DOUGHERTY, SDENCE
BICOM (3622 LYCKAN PARKWAY in DURHAM, NC)
(Resource Conservation and Recovery Act (tracking hazardous waste)) Organizations: R DEAN THOMAS (CONTACT/OWNER)
, DENNIS BISSELL (CONTACT/OWNER)
C C SPAULDING ELEMENTARY (1531 S ROXBORO RD in DURHAM, NC)
(National Center for Education Statistics) - STATE ID-374 Organizations: DURHAM PUBLIC SCHOOLS (SCHOOL DISTRICT)
C E JORDAN HIGH (6806 GARRETT RD in DURHAM, NC)
(National Center for Education Statistics) - STATE ID-312 Organizations: DURHAM PUBLIC SCHOOLS (SCHOOL DISTRICT)
DRYCLEAN EXPRESS OF OAK CREEK (OAK CREEK VILLAGE S C in DURHAM, NC)
(Resource Conservation and Recovery Act (tracking hazardous waste)) Organizations: DIEP BRADICK VO (CONTACT/OWNER)
BROWN BROTHERS BODY WORKS (411 ERWIN RD in DURHAM, NC)
Small Quantity Generators, between 100 kg and 1000 kg of hazardous waste/month (Resource Conservation and Recovery Act (tracking hazardous waste)) - notification Organizations: ROBERT E BROWN (CONTACT/OWNER)
DUKE UVIVERSITY MED CTR OB/PEDS CYTOGNTS (TWO UNIVERSITY PL STE 600B in DURHAM, NC)
Conditionally Exempt Small Quantity Generators, less than 100 kg/month of hazardous waste (Resource Conservation and Recovery Act (tracking hazardous waste)) - notification Organizations: DUKE MED CTR (CONTACT/OWNER)
Housing units lacking complete plumbing facilities: 0.5% Housing units lacking complete kitchen facilities: 0.9%
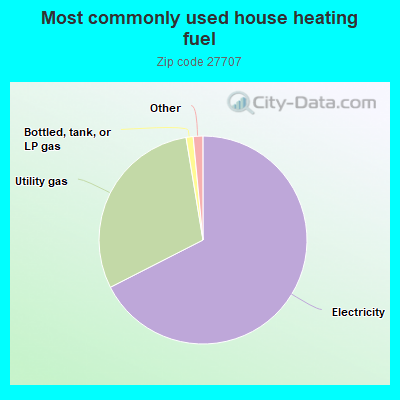
67.5%Electricity
29.9%Utility gas
1.1%Bottled, tank, or LP gas
0.7%Fuel oil, kerosene, etc.
0.5%No fuel used
Population in 1990: 36,264. Population change in the 1990s: +6,407 (+17.7%).
Place of birth for U.S.-born residents:
This state: 23,737
Northeast: 6,017
Midwest: 3,009
South: 8,570
West: 1,676
47% of the 27707 zip code residents lived in the same house 5 years ago. Out of people who lived in different houses, 47% lived in this county. Out of people who lived in different counties, 50% lived in North Carolina.
84% of the 27707 zip code residents lived in the same house 1 year ago. Out of people who lived in different houses, 44% moved from this county. Out of people who lived in different houses, 20% moved from different county within same state. Out of people who lived in different houses, 28% moved from different state. Out of people who lived in different houses, 5% moved from abroad.
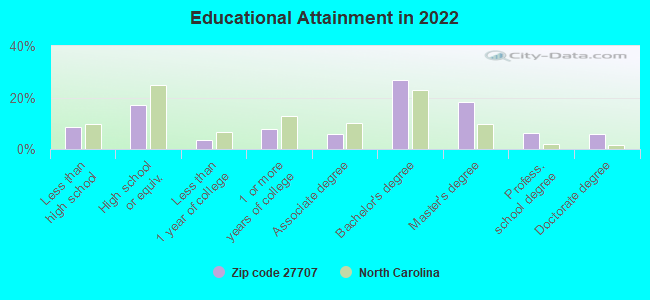
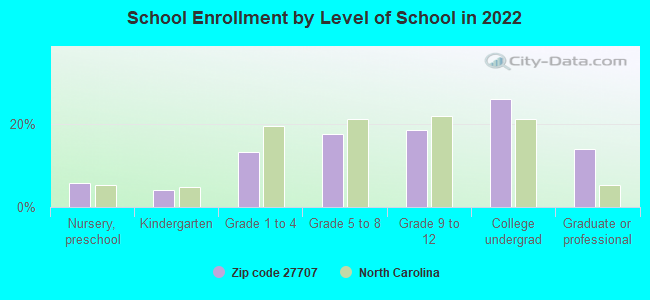
Private vs. public school enrollment:
Students in private schools in grades 1 to 8 (elementary and middle school): 933
Here:
22.9%
North Carolina:
13.8%
Students in private schools in grades 9 to 12 (high school): 292
Here:
12.1%
North Carolina:
11.9%
Students in private undergraduate colleges: 1,121
Here:
32.7%
North Carolina:
19.3%
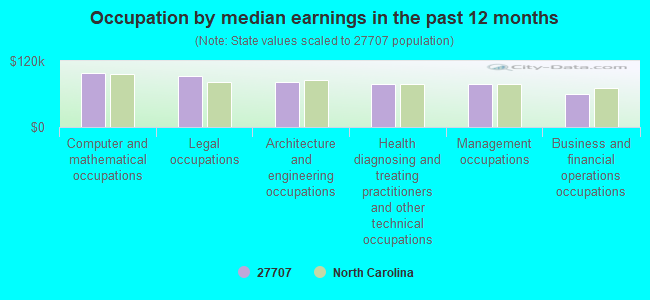
Occupation by median earnings in the past 12 months ($)
97,962Computer and mathematical occupations
93,324Legal occupations
82,387Architecture and engineering occupations
78,307Health diagnosing and treating practitioners and other technical occupations
77,341Management occupations
59,870Business and financial operations occupations
Companies with federal contracts located in this zip code (DURHAM, NC):
APPLIED BUSINESS TECHNOLIGIES (3100 TOWER BLVD STE 500; small business) : $7,875,244 in 51 contractsfrom 2000 to 2006
Contracts for Contract, Procurement, and Acquisition Support Services, Other Professional Services, ADP System Acquisition Support Services. Includes preparation of statement of work, benchmarks, specifications, etc. by Army Signed by year:2000: $745,947; 2001: $954,950; 2002: $1,379,062; 2003: $1,722,185; 2004: $1,756,060; 2005: $1,436,472; 2006: -$119,432.
Biggest contracts:
$1,114,400 with Army for Contract, Procurement, and Acquisition Support Services. Taking place in VA. Signed on 2002-04-24. Completion date: 2003-05-27.
$893,028 with Army for Other Professional Services. Taking place in VA. Signed on 2004-09-22. Completion date: 2005-08-24.
$752,638 with Army for Contract, Procurement, and Acquisition Support Services. Taking place in VA. Signed on 2003-09-16. Completion date: 2004-09-16.
$624,890, same as above.Signed on 2005-09-23. Completion date: 2005-09-24.
R & D ANALYSIS INC (3122 SURREY RD; small business) : $1,086,280 in 5 contractsfrom 2000 to 2004
Contracts for Other Research and Development -- Basic Research (R&D) by Army Signed by year:2000: $192,990; 2001: $272,087; 2002: $285,692; 2003: $299,976; 2004: $35,535; 2005: $0; 2006: $0.
Biggest contracts:
$299,976 with Army for Other Research and Development -- Basic Research (R&D). Signed on 2003-03-14. Completion date: 2004-03-31.
$285,692, same as above.Signed on 2002-03-27. Completion date: 2002-03-31.
$272,087, same as above.Signed on 2001-03-16. Completion date: 2002-03-31.
$192,990, same as above.Signed on 2000-03-27. Completion date: 2001-03-31.
EAGLE EYE RESEARCH, INC (3112 DEVON RD; small business) : $849,991 in 4 contractsfrom 2004 to 2006
$375,000 with Air Force for Other Defense -- Applied Research and Exploratory Development (R&D). Signed on 2005-06-27. Completion date: 2007-06-22.
$274,992, same as above.Signed on 2006-04-13. Completion date: 2007-06-22.
$100,000, same as above.Signed on 2006-02-24. Completion date: 2007-06-22.
$99,999, same as above.Signed on 2004-04-30. Completion date: 2005-04-29.
BLUE SHOE TECHNOLOGIES, INC (1820 JAMES ST STE 2000; small business) : $838,000 in 9 contractsfrom 2002 to 2004
Contracts for Automated Information System Design and Integration Services, Other ADP and Telecommunications Services (includes data storage on tapes, compact disks, etc.), ADP Software, Communications Security Equipment and Components, and moreby Department of Defense, U.S. Special Operations Command, Army Signed by year:2000: $0; 2001: $0; 2002: $394,000; 2003: $231,700; 2004: $212,300; 2005: $0; 2006: $0.
Biggest contracts:
$349,000 with Department of Defense for Automated Information System Design and Integration Services. Signed on 2002-09-18. Completion date: 2003-09-26.
$142,700 with Department of Defense for Other ADP and Telecommunications Services (includes data storage on tapes, compact disks, etc.). Signed on 2003-09-29. Completion date: 2004-09-29.
$89,000 with U.S. Special Operations Command for Other ADP and Telecommunications Services (includes data storage on tapes, compact disks, etc.). Signed on 2004-09-25. Completion date: 2004-10-20.
$73,300 with U.S. Special Operations Command for Automated Information System Design and Integration Services. Signed on 2004-05-02. Completion date: 2004-07-09.
TRAVELERS EMERGENCY NETWORK (4201 UNIVERSITY DRIVE, SUI) : $39,000 in 2 contractsin 2000
$39,000 with Department of Defense for Non-Government Insurance Programs. Signed on 2000-11-10. Completion date: 2001-09-30.
$0, same as above.Signed on 2000-11-10. Completion date: 2001-09-30.
THE TUBA EXCHANGE (1825 CHAPEL HILL RD; small business) : $35,220 in 9 contractsfrom 2002 to 2006
Contracts for Musical Instruments, Musical Instrument Parts and Accessories by Army, Air Force Signed by year:2000: $0; 2001: $0; 2002: $3,695; 2003: $9,700; 2004: $8,395; 2005: $18,630; 2006: -$5,200.
Biggest contracts:
$11,840 with Army for Musical Instruments. Signed on 2005-08-23. Completion date: 2005-09-30.
$9,700 with Army for Musical Instruments. Taking place in AZ. Signed on 2003-06-03. Completion date: 2003-04-11.
$6,790 with Army for Musical Instrument Parts and Accessories. Taking place in AL. Signed on 2005-02-03. Completion date: 2005-03-04.
$4,800 with Army for Musical Instruments. Taking place in AZ. Signed on 2004-01-29. Completion date: 2004-03-22.
CODING PLUS (3600 UNIVERSITY DR STE B; small business)
$14,400 with Army for Other Professional Services. Signed on 2003-12-02. Completion date: 2004-01-08.
JOURNALISTIC, INC (4905 PINE CONE DRIVE C-2; small business) : $9,480 in 2 contractsfrom 2003 to 2004
$4,835 with Army for Newspapers and Periodicals. Signed on 2004-06-23. Completion date: 2004-09-01.
$4,645 with Army for Miscellaneous Printed Matter. Signed on 2003-07-16. Completion date: 2003-09-05.
I T CORPORATION (3710 UNIVERSITY DR)
-$126 with Navy for Other Architect and Engineering Services. Taking place in VA. Signed on 2001-10-01. Completion date: 2001-02-14.
JAMES W GAMBLE CONSULTING (5811 WOODBERRY RD; small business) : -$24,721 in 3 contractsin 2002
$23,164 with Army for Other Education and Training Services. Taking place in VA. Signed on 2002-08-07. Completion date: 2002-09-30.
$0, same as above.Signed on 2002-08-07. Completion date: 2002-09-30.
-$47,885, same as above.Signed on 2002-09-14. Completion date: 2002-09-30.
Top industries in this zip code by the number of employees in 2005:
Finance and Insurance: Direct Health and Medical Insurance Carriers (over 1000 employees: 1 establishment, 250-499 employees: 1 establishment)
Health Care and Social Assistance: Home Health Care Services (250-499: 1, 50-99: 1, 20-49: 2, 10-19: 2, 1-4: 1)
Professional, Scientific, and Technical Services: Research and Development in the Physical, Engineering, and Life Sciences (100-249: 2, 50-99: 2, 20-49: 1, 10-19: 1, 1-4: 3)
Other Services (except Public Administration): Religious Organizations (50-99: 2, 20-49: 6, 10-19: 6, 5-9: 7, 1-4: 17)
People in group quarters in 2010:
2,134 people in college/university student housing
215 people in residential treatment centers for adults
65 people in group homes intended for adults
13 people in group homes for juveniles (non-correctional)
13 people in other noninstitutional facilities
People in group quarters in 2000:
1,834 people in college dormitories (includes college quarters off campus)
72 people in nursing homes
32 people in orthopedic wards and institutions for the physically handicapped
31 people in other noninstitutional group quarters
15 people in homes for the mentally ill
15 people in homes for the mentally retarded
2 people in other nonhousehold living situations
Fatal accident statistics in 2014:
Fatal accident count: 1
Vehicles involved in fatal accidents: 1
Fatal accidents caused by drunken drivers: 1
Fatalities: 1
Persons involved in fatal accidents: 2
Pedestrians involved in fatal accidents: 0
Fatal accident statistics in 2013:
Fatal accident count: 2
Vehicles involved in fatal accidents: 3
Fatal accidents caused by drunken drivers: 0
Fatalities: 2
Persons involved in fatal accidents: 4
Pedestrians involved in fatal accidents: 1
Home Mortgage Disclosure Act Aggregated Statistics For Year 2009 (Based on 7 full and 22 partial tracts)
A) FHA, FSA/RHS & VA Home Purchase Loans
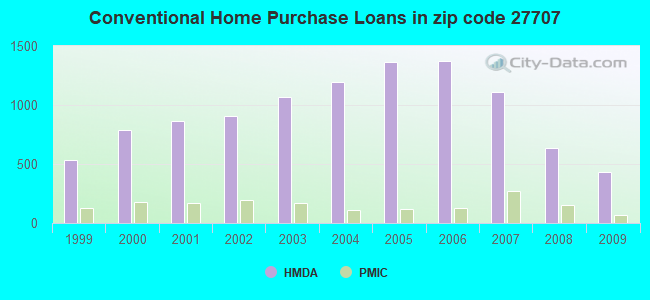
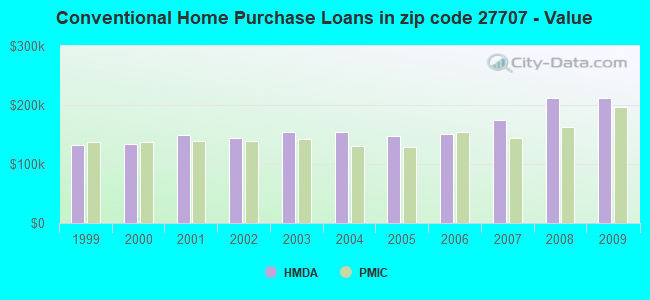
B) Conventional Home Purchase Loans
C) Refinancings
D) Home Improvement Loans
E) Loans on Dwellings For 5+ Families
F) Non-occupant Loans on < 5 Family Dwellings (A B C & D)
G) Loans On Manufactured Home Dwelling (A B C & D)
Number
Average Value
Number
Average Value
Number
Average Value
Number
Average Value
Number
Average Value
Number
Average Value
Number
Average Value
LOANS ORIGINATED
137
$151,738
429
$212,451
1,440
$210,728
41
$184,863
7
$9,634,549
121
$127,599
0
$0
APPLICATIONS APPROVED, NOT ACCEPTED
13
$206,247
30
$238,875
91
$178,558
10
$219,653
0
$0
12
$187,878
0
$0
APPLICATIONS DENIED
22
$130,550
61
$171,321
416
$180,619
46
$29,227
0
$0
57
$124,336
1
$195,020
APPLICATIONS WITHDRAWN
10
$173,142
49
$167,321
272
$180,509
6
$126,490
0
$0
17
$82,611
0
$0
FILES CLOSED FOR INCOMPLETENESS
2
$101,565
17
$219,548
66
$179,541
9
$64,374
0
$0
13
$118,561
0
$0
Aggregated Statistics For Year 2008 (Based on 7 full and 22 partial tracts)
A) FHA, FSA/RHS & VA Home Purchase Loans
B) Conventional Home Purchase Loans
C) Refinancings
D) Home Improvement Loans
E) Loans on Dwellings For 5+ Families
F) Non-occupant Loans on < 5 Family Dwellings (A B C & D)
G) Loans On Manufactured Home Dwelling (A B C & D)
Number
Average Value
Number
Average Value
Number
Average Value
Number
Average Value
Number
Average Value
Number
Average Value
Number
Average Value
LOANS ORIGINATED
101
$150,757
636
$212,053
782
$182,287
67
$96,042
7
$4,085,629
206
$120,494
6
$25,002
APPLICATIONS APPROVED, NOT ACCEPTED
8
$118,679
60
$152,436
112
$149,916
15
$43,908
0
$0
25
$126,366
3
$29,977
APPLICATIONS DENIED
13
$127,221
78
$214,992
484
$141,554
154
$66,967
0
$0
89
$84,320
1
$21,000
APPLICATIONS WITHDRAWN
21
$130,772
95
$209,080
234
$148,123
31
$86,420
0
$0
38
$100,575
0
$0
FILES CLOSED FOR INCOMPLETENESS
0
$0
13
$280,018
58
$160,675
9
$53,328
0
$0
15
$112,070
0
$0
Aggregated Statistics For Year 2007 (Based on 7 full and 22 partial tracts)
A) FHA, FSA/RHS & VA Home Purchase Loans
B) Conventional Home Purchase Loans
C) Refinancings
D) Home Improvement Loans
E) Loans on Dwellings For 5+ Families
F) Non-occupant Loans on < 5 Family Dwellings (A B C & D)
G) Loans On Manufactured Home Dwelling (A B C & D)
Number
Average Value
Number
Average Value
Number
Average Value
Number
Average Value
Number
Average Value
Number
Average Value
Number
Average Value
LOANS ORIGINATED
42
$152,037
1,112
$173,927
854
$153,430
98
$72,188
7
$4,452,911
363
$97,597
2
$133,580
APPLICATIONS APPROVED, NOT ACCEPTED
4
$144,100
103
$140,787
149
$125,087
24
$84,360
0
$0
65
$93,064
1
$35,940
APPLICATIONS DENIED
21
$121,043
200
$145,546
620
$120,142
127
$57,685
2
$506,525
155
$82,045
4
$39,448
APPLICATIONS WITHDRAWN
7
$107,980
123
$176,497
342
$152,054
28
$108,996
2
$662,680
56
$98,880
0
$0
FILES CLOSED FOR INCOMPLETENESS
0
$0
38
$144,214
64
$176,776
3
$55,247
0
$0
18
$88,637
0
$0
Aggregated Statistics For Year 2006 (Based on 7 full and 22 partial tracts)
A) FHA, FSA/RHS & VA Home Purchase Loans
B) Conventional Home Purchase Loans
C) Refinancings
D) Home Improvement Loans
E) Loans on Dwellings For 5+ Families
F) Non-occupant Loans on < 5 Family Dwellings (A B C & D)
G) Loans On Manufactured Home Dwelling (A B C & D)
Number
Average Value
Number
Average Value
Number
Average Value
Number
Average Value
Number
Average Value
Number
Average Value
Number
Average Value
LOANS ORIGINATED
43
$140,284
1,375
$150,666
946
$133,797
133
$60,827
6
$6,990,275
449
$94,567
4
$38,588
APPLICATIONS APPROVED, NOT ACCEPTED
4
$129,840
133
$140,377
221
$117,418
34
$66,352
0
$0
63
$82,979
5
$45,160
APPLICATIONS DENIED
5
$79,104
368
$99,616
665
$122,014
159
$49,614
0
$0
255
$80,937
17
$55,855
APPLICATIONS WITHDRAWN
2
$113,790
133
$132,140
370
$118,525
37
$118,276
0
$0
69
$107,962
1
$21,510
FILES CLOSED FOR INCOMPLETENESS
0
$0
41
$107,408
138
$150,105
3
$39,953
0
$0
19
$113,794
0
$0
Aggregated Statistics For Year 2005 (Based on 7 full and 22 partial tracts)
A) FHA, FSA/RHS & VA Home Purchase Loans
B) Conventional Home Purchase Loans
C) Refinancings
D) Home Improvement Loans
E) Loans on Dwellings For 5+ Families
F) Non-occupant Loans on < 5 Family Dwellings (A B C & D)
G) Loans On Manufactured Home Dwelling (A B C & D)
Number
Average Value
Number
Average Value
Number
Average Value
Number
Average Value
Number
Average Value
Number
Average Value
Number
Average Value
LOANS ORIGINATED
69
$122,360
1,365
$147,718
1,123
$144,850
90
$75,482
3
$9,169,523
458
$95,942
0
$0
APPLICATIONS APPROVED, NOT ACCEPTED
4
$100,132
119
$116,748
223
$130,538
18
$61,968
0
$0
83
$88,346
10
$29,828
APPLICATIONS DENIED
5
$56,842
166
$99,056
782
$127,966
119
$59,481
0
$0
151
$82,808
22
$52,361
APPLICATIONS WITHDRAWN
7
$103,747
178
$137,279
427
$128,625
55
$129,699
0
$0
78
$91,617
4
$89,080
FILES CLOSED FOR INCOMPLETENESS
2
$72,915
44
$139,968
189
$156,758
6
$72,897
0
$0
20
$83,030
0
$0
Aggregated Statistics For Year 2004 (Based on 7 full and 22 partial tracts)
A) FHA, FSA/RHS & VA Home Purchase Loans
B) Conventional Home Purchase Loans
C) Refinancings
D) Home Improvement Loans
E) Loans on Dwellings For 5+ Families
F) Non-occupant Loans on < 5 Family Dwellings (A B C & D)
G) Loans On Manufactured Home Dwelling (A B C & D)
Number
Average Value
Number
Average Value
Number
Average Value
Number
Average Value
Number
Average Value
Number
Average Value
Number
Average Value
LOANS ORIGINATED
51
$123,262
1,191
$154,292
1,297
$143,789
113
$63,407
2
$313,710
395
$95,678
5
$23,570
APPLICATIONS APPROVED, NOT ACCEPTED
5
$128,068
104
$131,952
173
$115,591
24
$59,037
0
$0
59
$94,211
2
$52,565
APPLICATIONS DENIED
14
$123,734
180
$101,856
840
$113,278
144
$52,134
0
$0
115
$87,468
14
$72,704
APPLICATIONS WITHDRAWN
9
$118,283
110
$158,410
448
$125,998
41
$60,783
0
$0
46
$91,690
2
$13,750
FILES CLOSED FOR INCOMPLETENESS
6
$118,268
25
$126,441
134
$109,639
2
$42,915
0
$0
26
$55,330
2
$85,575
Aggregated Statistics For Year 2003 (Based on 7 full and 22 partial tracts)
A) FHA, FSA/RHS & VA Home Purchase Loans
B) Conventional Home Purchase Loans
C) Refinancings
D) Home Improvement Loans
E) Loans on Dwellings For 5+ Families
F) Non-occupant Loans on < 5 Family Dwellings (A B C & D)
Number
Average Value
Number
Average Value
Number
Average Value
Number
Average Value
Number
Average Value
Number
Average Value
LOANS ORIGINATED
92
$136,746
1,071
$153,956
2,924
$153,817
90
$29,741
2
$4,210,660
403
$93,883
APPLICATIONS APPROVED, NOT ACCEPTED
5
$186,490
89
$127,589
262
$120,311
12
$18,338
0
$0
30
$91,539
APPLICATIONS DENIED
6
$133,062
140
$99,296
849
$115,517
93
$28,571
0
$0
111
$93,538
APPLICATIONS WITHDRAWN
16
$112,808
97
$139,439
492
$129,614
32
$40,648
0
$0
47
$89,324
FILES CLOSED FOR INCOMPLETENESS
2
$107,060
14
$170,621
97
$126,786
3
$51,227
0
$0
10
$83,065
Aggregated Statistics For Year 2002 (Based on 7 full and 20 partial tracts)
A) FHA, FSA/RHS & VA Home Purchase Loans
B) Conventional Home Purchase Loans
C) Refinancings
D) Home Improvement Loans
E) Loans on Dwellings For 5+ Families
F) Non-occupant Loans on < 5 Family Dwellings (A B C & D)
Number
Average Value
Number
Average Value
Number
Average Value
Number
Average Value
Number
Average Value
Number
Average Value
LOANS ORIGINATED
141
$123,243
907
$143,929
2,108
$154,063
84
$38,850
9
$893,254
320
$85,640
APPLICATIONS APPROVED, NOT ACCEPTED
14
$121,095
87
$135,375
189
$111,857
18
$15,404
0
$0
26
$85,550
APPLICATIONS DENIED
18
$119,383
150
$93,438
542
$101,528
135
$19,452
0
$0
70
$66,419
APPLICATIONS WITHDRAWN
7
$140,463
88
$131,768
389
$120,261
40
$43,063
0
$0
41
$83,064
FILES CLOSED FOR INCOMPLETENESS
5
$157,062
8
$108,346
108
$121,421
0
$0
0
$0
16
$65,220
Aggregated Statistics For Year 2001 (Based on 7 full and 20 partial tracts)
A) FHA, FSA/RHS & VA Home Purchase Loans
B) Conventional Home Purchase Loans
C) Refinancings
D) Home Improvement Loans
E) Loans on Dwellings For 5+ Families
F) Non-occupant Loans on < 5 Family Dwellings (A B C & D)
Number
Average Value
Number
Average Value
Number
Average Value
Number
Average Value
Number
Average Value
Number
Average Value
LOANS ORIGINATED
161
$113,973
865
$149,840
1,561
$138,919
146
$37,372
4
$383,340
262
$85,544
APPLICATIONS APPROVED, NOT ACCEPTED
3
$166,023
82
$127,514
223
$104,397
28
$45,367
0
$0
36
$88,449
APPLICATIONS DENIED
9
$113,933
197
$78,366
537
$102,714
137
$19,079
0
$0
66
$65,457
APPLICATIONS WITHDRAWN
22
$100,525
79
$135,782
373
$97,310
36
$26,361
0
$0
29
$79,973
FILES CLOSED FOR INCOMPLETENESS
6
$119,543
21
$127,217
68
$124,171
6
$30,720
0
$0
12
$55,752
Aggregated Statistics For Year 2000 (Based on 7 full and 20 partial tracts)
A) FHA, FSA/RHS & VA Home Purchase Loans
B) Conventional Home Purchase Loans
C) Refinancings
D) Home Improvement Loans
E) Loans on Dwellings For 5+ Families
F) Non-occupant Loans on < 5 Family Dwellings (A B C & D)
Number
Average Value
Number
Average Value
Number
Average Value
Number
Average Value
Number
Average Value
Number
Average Value
LOANS ORIGINATED
145
$111,614
791
$134,322
591
$102,794
131
$27,230
1
$3,036,840
160
$71,532
APPLICATIONS APPROVED, NOT ACCEPTED
18
$62,379
79
$92,131
122
$85,953
37
$21,600
0
$0
16
$59,733
APPLICATIONS DENIED
36
$79,463
200
$67,409
476
$87,350
129
$20,049
0
$0
51
$46,347
APPLICATIONS WITHDRAWN
9
$70,801
97
$106,698
275
$81,694
17
$29,185
1
$90,000
28
$56,384
FILES CLOSED FOR INCOMPLETENESS
2
$92,160
22
$91,766
93
$84,400
4
$72,620
0
$0
14
$58,034
Aggregated Statistics For Year 1999 (Based on 5 full and 11 partial tracts)
A) FHA, FSA/RHS & VA Home Purchase Loans
B) Conventional Home Purchase Loans
C) Refinancings
D) Home Improvement Loans
E) Loans on Dwellings For 5+ Families
F) Non-occupant Loans on < 5 Family Dwellings (A B C & D)
2004 - 2018 National Fire Incident Reporting System (NFIRS) incidents
According to the data from the years 2004 - 2018 the average number of fires per year is 107. The highest number of fires - 188 took place in 2013, and the least - 0 in 2008. The data has a rising trend.
When looking into fire subcategories, the most incidents belonged to: Structure Fires (49.8%), and Outside Fires (30.8%).
Fire incident types reported to NFIRS in Zip Code 27707


+$1,542
-$3,231
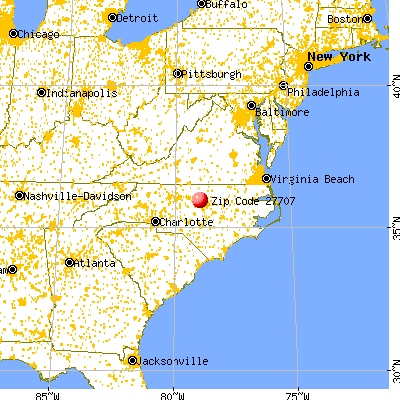
 Nearest zip codes: 27713, 27701, 27705, 27514, 27709, 27517.


 According to the data from the years 2004 - 2018 the average number of fires per year is 107. The highest number of fires - 188 took place in 2013, and the least - 0 in 2008. The data has a rising trend.
 When looking into fire subcategories, the most incidents belonged to: Structure Fires (49.8%), and Outside Fires (30.8%).