Lyon Park neighborhood in Durham, North Carolina (NC), 27707 detailed profile
Settings
X


Business Search - 14 Million verified businesses
Area: 0.116 square miles
Population: 1,031
Population density:
| Lyon Park: | 8,885 people per square mile |
| Durham: | 3,084 people per square mile |

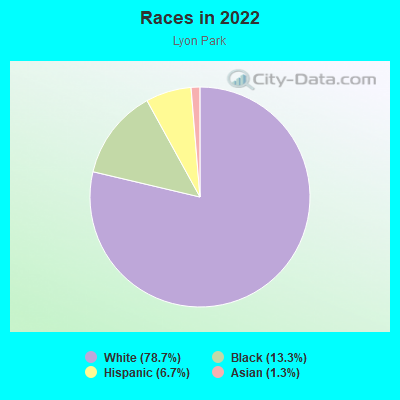
- 59056.8%Black
- 20619.8%Hispanic or Latino
- 14614.1%White
- 737.0%Asian
- 141.3%Two or more races
- 90.9%American Indian
- 10.10%Some other race
Median household income in 2022:
| Lyon Park: | $73,306 |
| Durham: | $78,105 |
Distribution of median household income
![Distribution of median household income]()
- 16Less than $10,000
- 40$10,000 to $19,999
- 67$20,000 to $29,999
- 26$30,000 to $39,999
- 38$40,000 to $49,999
- 3$50,000 to $59,999
- 20$60,000 to $74,999
- 17$75,000 to $99,999
- 16$100,000 to $124,999
- 21$125,000 to $149,999
- 6$150,000 to $199,999
- 35$200,000 or more

Distribution of owner-occupied house/condo value
![Distribution of owner-occupied house/condo value]()
- 21Less than $50,000
- 14$50,000 to $99,999
- 18$100,000 to $149,999
- 19$150,000 to $199,999
- 6$200,000 to $249,999
- 30$250,000 to $299,999
- 8$300,000 to $399,999
- 4$400,000 to $499,999
- 11$500,000 to $749,999
- 24$750,000 to $999,999
- 14$1,000,000 or more

Distribution of rent paid by renters
![Distribution of rent paid by renters]()
- 18$100 to $199
- 18$200 to $299
- 14$300 to $399
- 17$400 to $499
- 58$500 to $599
- 34$600 to $699
- 20$700 to $799
- 25$800 to $899
- 15$900 to $999
- 11$1,000 to $1,249
- 37$1,250 to $1,499
- 7$1,500 to $1,999
- 28$2,000 or more

Median rent in 2022:
| Lyon Park: | $627 |
| Durham: | $1,246 |
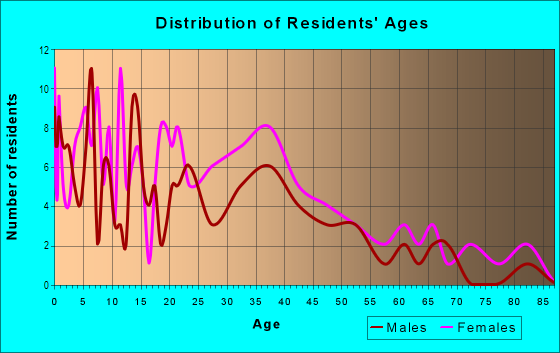
| Males: | 484 |
| Females: | 546 |
Males:
| This neighborhood: | 30.9 years |
| Whole city: | 34.3 years |
| This neighborhood: | 40.7 years |
| Whole city: | 35.8 years |
Average household size:
| Lyon Park: | 2.5 people |
| Durham: | 2.3 people |
Percentage of family households:
| Lyon Park: | 44.2% |
| Durham: | 41.2% |
| Here: | 20.9% |
| Durham: | 36.4% |
Percentage of married-couple families with children (among all households):
| Lyon Park: | 11.0% |
| Durham: | 27.1% |
Percentage of single-mother households (among all households):
| Lyon Park: | 16.9% |
| Durham: | 12.7% |
Percentage of never married males 15 years old and over:
Percentage of never married females 15 years old and over:
| Lyon Park: | 28.7% |
| Durham: | 20.9% |
Percentage of never married females 15 years old and over:
| Lyon Park: | 42.6% |
| city: | 23.2% |
Percentage of people that speak English not well or not at all:
| Lyon Park: | 12.8% |
| Durham: | 4.9% |
Percentage of people born in this state:
Percentage of people born in another U.S. state:
Percentage of native residents but born outside the U.S.:
Percentage of foreign born residents:
| Here: | 50.7% |
| Durham: | 45.4% |
Percentage of people born in another U.S. state:
| Lyon Park: | 31.5% |
| Durham: | 38.2% |
Percentage of native residents but born outside the U.S.:
| Here: | 1.5% |
| city: | 1.6% |
Percentage of foreign born residents:
| Here: | 16.3% |
| Durham: | 14.8% |
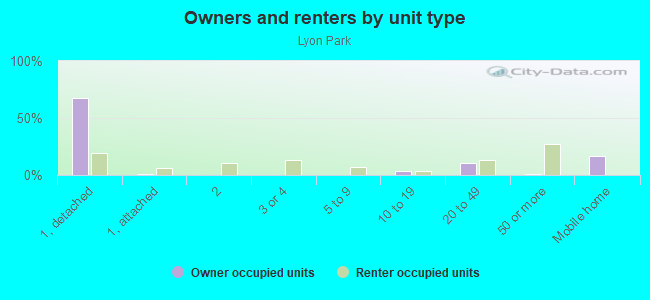
Owner-occupied
Renter-occupied

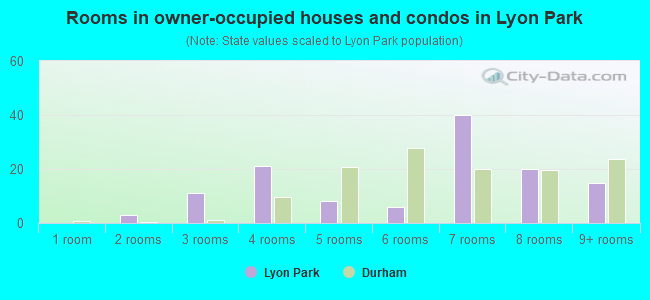
- Rooms in owner-occupied houses and condos in Lyon Park
- 01 room
- 32 rooms
- 113 rooms
- 214 rooms
- 85 rooms
- 66 rooms
- 407 rooms
- 208 rooms
- 159+ rooms
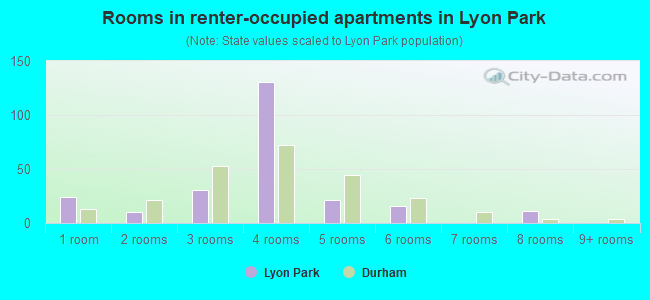
- Rooms in renter-occupied apartments in Lyon Park
- 241 room
- 102 rooms
- 313 rooms
- 1314 rooms
- 215 rooms
- 166 rooms
- 07 rooms
- 118 rooms
- 09+ rooms
Owner-occupied
Renter-occupied
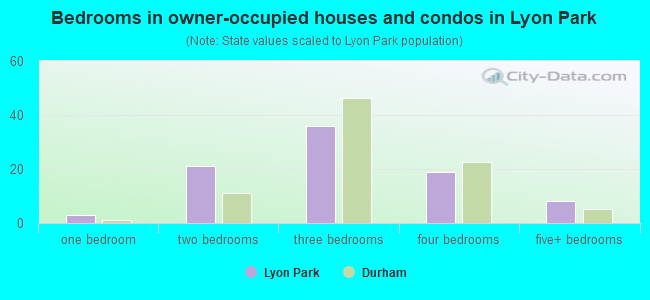
- Bedrooms in owner-occupied houses and condos in Lyon Park
- 0no bedroom
- 31 bedroom
- 212 bedrooms
- 363 bedrooms
- 194 bedrooms
- 85+ bedrooms
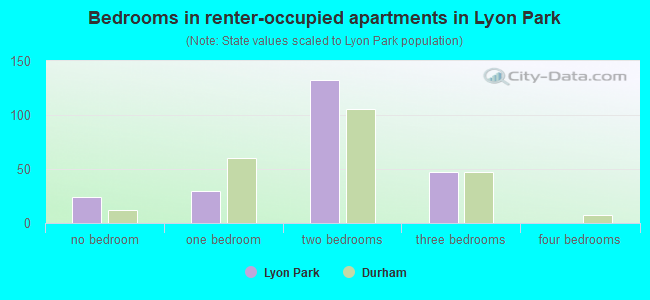
- Bedrooms in renter-occupied apartments in Lyon Park
- 24no bedroom
- 301 bedroom
- 1322 bedrooms
- 473 bedrooms
- 04 bedrooms
- 05+ bedrooms
Average number of cars or other vehicles available in houses/condos:
Average number of cars or other vehicles available in apartments:
| This neighborhood: | 2.0 |
| Durham: | 1.9 |
Average number of cars or other vehicles available in apartments:
| Here: | 1.0 |
| city: | 1.3 |
Percentage of units with a mortgage:
| Lyon Park: | 96.6% |
| Durham: | 74.8% |
Average estimated value of detached houses in 2022 (51.4% of all units):
| Lyon Park: | $211,224 |
| Durham: | $359,544 |
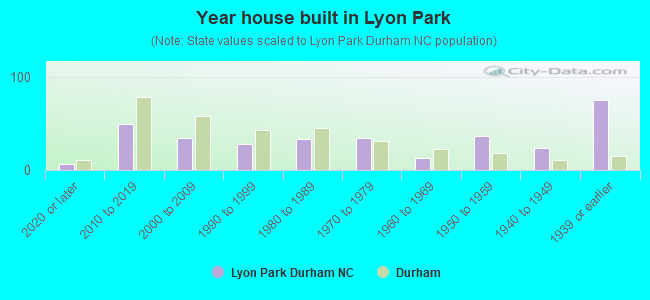
- Year house built in Lyon Park
- 62020 or later
- 492010 to 2019
- 342000 to 2009
- 281990 to 1999
- 331980 to 1989
- 341970 to 1979
- 131960 to 1969
- 361950 to 1959
- 241940 to 1949
- 751939 or earlier
City-data.com crime index for city in 2020 (higher means more crime):
| City: | 425.9 |
| U.S. average: | 219.5 |
Travel time to work (commute)
![Travel time to work (commute)]()
- 3Less than 5 minutes
- 455 to 9 minutes
- 7410 to 14 minutes
- 3715 to 19 minutes
- 3120 to 24 minutes
- 525 to 29 minutes
- 2630 to 34 minutes
- 235 to 39 minutes
- 6345 to 59 minutes
- 260 to 89 minutes
- 290 or more minutes

Means of transportation to work
![Means of transportation to work]()
- 49.0%165Drove a car alone
- 8.9%30Carpooled
- 22.3%75Bus
- 0.6%2Long-distance train or commuter rail
- 3.0%10Taxi
- 5.6%19Bicycle
- 1.5%5Walked
- 0.9%3Other means
- 11.9%40Worked at home

Time leaving home to go to work
![Time leaving home to go to work]()
- 2212:00 a.m. to 4:59 a.m.
- 35:00 a.m. to 5:29 a.m.
- 185:30 a.m. to 5:59 a.m.
- 106:00 a.m. to 6:29 a.m.
- 126:30 a.m. to 6:59 a.m.
- 277:00 a.m. to 7:29 a.m.
- 277:30 a.m. to 7:59 a.m.
- 238:00 a.m. to 8:29 a.m.
- 358:30 a.m. to 8:59 a.m.
- 339:00 a.m. to 9:59 a.m.
- 1210:00 a.m. to 10:59 a.m.
- 511:00 a.m. to 11:59 a.m.
- 2312:00 p.m. to 3:59 p.m.
- 134:00 p.m. to 11:59 p.m.

Occupations of males:
- Percentage of males in management occupations (except farmers):
Here: 9.7% city: 13.6%
- Percentage of males in business and financial operations occupations:
Here: 3.4% city: 6.2%
- Percentage of males in computer and mathematical occupations:
Here: 1.7% city: 9.2%
- Percentage of males in life, physical, and social science occupations:
Here: 9.7% city: 2.7%
- Percentage of males in community and social services occupations:
Here: 10.5% city: 1.3%
- Percentage of males in education, training, and library occupations:
Here: 14.4% city: 6.0%
- Percentage of males in arts, design, entertainment, sports, and media occupations:
Here: 3.0% city: 2.2%
- Percentage of males in service occupations:
Here: 13.5% city: 13.7%
- Percentage of males in sales and office occupations:
Here: 5.1% city: 12.9%
- Percentage of males in construction, extraction, and maintenance occupations:
Here: 23.6% city: 8.8%
- Percentage of males in production occupations:
Here: 5.5% city: 3.9%
Occupations of females:
- Percentage of females in management occupations (except farmers):
Here: 15.4% city: 11.0%
- Percentage of females in life, physical, and social science occupations:
Here: 12.6% city: 4.4%
- Percentage of females in education, training, and library occupations:
Here: 6.0% city: 11.8%
- Percentage of females in arts, design, entertainment, sports, and media occupations:
Here: 2.7% city: 2.1%
- Percentage of females in healthcare practitioners and technical occupations:
Here: 1.7% city: 13.6%
- Percentage of females in service occupations:
Here: 28.0% city: 16.8%
- Percentage of females in sales and office occupations:
Here: 33.6% city: 19.6%
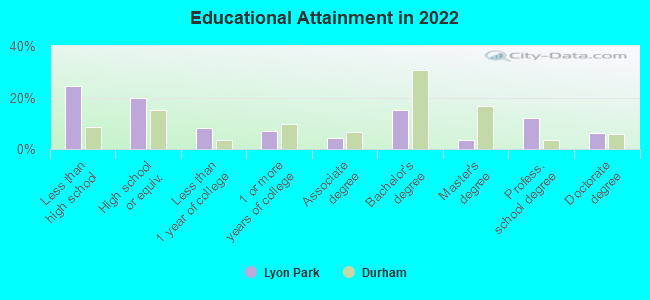
Education in this neighborhood (subdivision or community):
- Percentage of people 3 years and older in K-12 schools:
Lyon Park: 31.3% Durham: 14.4%
- Percentage of people 3 years and older in undergraduate colleges:
Lyon Park: 3.5% Durham: 5.8%
- Percentage of people 3 years and older in grad. or professional schools:
Lyon Park: 4.1% Durham: 4.6%
- Percentage of students K-12 enrolled in private schools:
Lyon Park: 12.2% Durham: 16.9%
Percentage of population below poverty level:
| Lyon Park: | 27.2% |
| Durham: | 11.2% |
Median year owner moved in (as recorded in 2022):
Median year renter moved in (as recorded in 2022):
| Lyon Park: | 2011 |
| Durham: | 2013 |
Median year renter moved in (as recorded in 2022):
| Lyon Park: | 2018 |
| Durham: | 2020 |
Percentage of married-couple families with both working:
| Lyon Park: | 100.0% |
| Durham: | 68.9% |
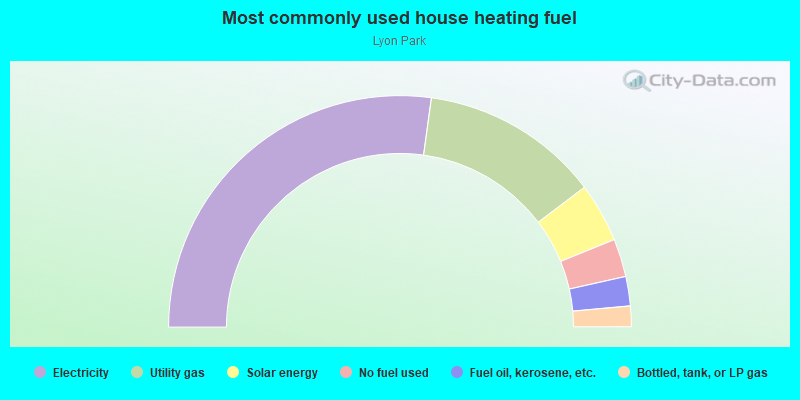
- 54.3%Electricity
- 25.0%Utility gas
- 8.3%Solar energy
- 5.3%No fuel used
- 4.1%Fuel oil, kerosene, etc.
- 2.9%Bottled, tank, or LP gas
Roads and streets:
Carroll St
Length: 0.24 miles
Directions: N-S, SW-NE
Address range: 1100 to 1299
Directions: N-S, SW-NE
Address range: 1100 to 1299
Halley St
Length: 0.19 miles
Direction: E-W
Address range: 1200 to 1499
Direction: E-W
Address range: 1200 to 1499
W Lakewood Ave
Length: 0.14 miles
Directions: E-W, SW-NE
Address range: 1100 to 1199
Directions: E-W, SW-NE
Address range: 1100 to 1199
Fairview St
Length: 0.09 miles
Direction: N-S
Address range: 1100 to 1199
Direction: N-S
Address range: 1100 to 1199
W Proctor St
Length: 0.08 miles
Direction: E-W
Address range: 1100 to 1199
Direction: E-W
Address range: 1100 to 1199
Kent St
Length: 0.07 miles
Direction: N-S
Address range: 1100 to 1199
Direction: N-S
Address range: 1100 to 1199
Moreland Ave
Length: 0.07 miles
Direction: N-S
Address range: 1100 to 1199
Direction: N-S
Address range: 1100 to 1199
Gunter St
Length: 0.06 miles
Direction: E-W
Address range: 1400 to 1499
Direction: E-W
Address range: 1400 to 1499
Forestview St
Length: 0.04 miles
Direction: N-S
Address range: 1200 to 1209
Direction: N-S
Address range: 1200 to 1209
Rock St
Length: 0.01 miles
Direction: N-S
Address range: 1164 to 1199
Direction: N-S
Address range: 1164 to 1199