Estimated median house/condo value in 2022: $682,681
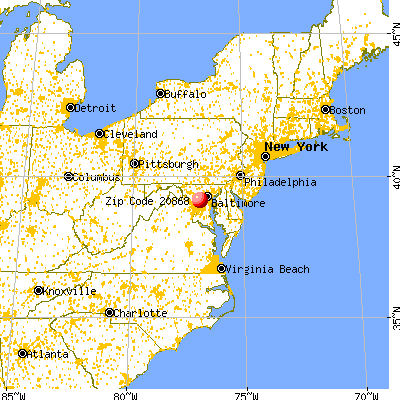
20868:
$682,681
Maryland:
$398,100
According to our research of Maryland and other state lists, there was 1 registered sex offender living in 20868 zip code as of July 03, 2024. The ratio of all residents to sex offenders in zip code 20868 is 838 to 1. The ratio of registered sex offenders to all residents in this zip code is near the state average.
Median resident age:
This zip code:
28.2 years
Maryland median age:
39.7 years
Average household size:
This zip code:
4.0 people
Maryland:
2.5 people
Averages for the 2020 tax year for zip code 20868, filed in 2021:
Average Adjusted Gross Income (AGI) in 2020: $152,891 (Individual Income Tax Returns)
Here:
$152,891
State:
$86,905
Salary/wage: $86,943 (reported on 80.0% of returns)
Here:
$86,943
State:
$73,953
(% of AGI for various income ranges: 1088.3% for AGIs below $25k, 3838.0% for AGIs $25k-50k, 5662.5% for AGIs $50k-75k, 14572.5% for AGIs $100k-200k)
Taxable interest for individuals: $2,300 (reported on 45.7% of returns)
This zip code:
$2,300
Maryland:
$1,528
(% of AGI for various income ranges: 13.3% for AGIs below $25k, 40.0% for AGIs $50k-75k, 87.5% for AGIs $100k-200k)
Ordinary dividends: $5,862 (reported on 22.9% of returns)
Here:
$5,862
State:
$8,028
(% of AGI for various income ranges: )
Net capital gain/loss in AGI: +$23,443 (reported on 20.0% of returns)
Here:
+$23,443
State:
+$25,238
(% of AGI for various income ranges: 517.5% for AGIs $100k-200k)
Profit/loss from business: +$12,680 (reported on 28.6% of returns)
Here:
+$12,680
State:
+$11,398
(% of AGI for various income ranges: 403.3% for AGIs below $25k, 262.0% for AGIs $25k-50k, 2237.5% for AGIs $100k-200k)
Taxable individual retirement arrangement distribution: $14,525 (reported on 11.4% of returns)
20868:
$14,525
Maryland:
$20,944
(% of AGI for various income ranges: 1452.5% for AGIs $100k-200k)
Total itemized deductions: $40,100 (reported on 25.7% of returns)
Here:
$40,100
State:
$30,672
(% of AGI for various income ranges: 2355.0% for AGIs $50k-75k, 2552.5% for AGIs $100k-200k)
Charity contributions: $11,071 (reported on 20.0% of returns)
Here:
$11,071
State:
$9,065
(% of AGI for various income ranges: 527.5% for AGIs $100k-200k)
Taxes paid: $8,989 (reported on 25.7% of returns)
20868:
$8,989
State:
$8,475
(% of AGI for various income ranges: 522.5% for AGIs $50k-75k, 697.5% for AGIs $100k-200k)
Earned income credit: $2,467 (reported on 8.6% of returns)
Here:
$2,467
State:
$2,151
(% of AGI for various income ranges: 123.3% for AGIs below $25k)
Percentage of individuals using paid preparers for their 2020 taxes: 91.4%
Here:
91%
State:
90%
(% for various income ranges: 88.9% for AGIs below $25k, 100.0% for AGIs $25k-50k, 100.0% for AGIs $50k-75k, 66.7% for AGIs $75k-100k, 83.3% for AGIs $100k-200k, 100.0% for AGIs over 200k)
Averages for the 2012 tax year for zip code 20868, filed in 2013:
Average Adjusted Gross Income (AGI) in 2012: $76,805 (Individual Income Tax Returns)
Here:
$76,805
State:
$72,703
Salary/wage: $67,530 (reported on 81.1% of returns)
Here:
$67,530
State:
$62,228
(% of AGI for various income ranges: 59.9% for AGIs below $25k, 70.2% for AGIs $25k-50k, 54.6% for AGIs $50k-75k, 80.3% for AGIs $75k-100k, 76.9% for AGIs $100k-200k, 69.4% for AGIs over 200k)
Taxable interest for individuals: $1,047 (reported on 45.9% of returns)
This zip code:
$1,047
Maryland:
$1,413
(% of AGI for various income ranges: 1.6% for AGIs below $25k, 0.8% for AGIs $25k-50k, 1.1% for AGIs $50k-75k, 0.1% for AGIs $75k-100k, 0.6% for AGIs $100k-200k, 0.4% for AGIs over 200k)
Ordinary dividends: $3,575 (reported on 21.6% of returns)
Here:
$3,575
State:
$6,933
Profit/loss from business: +$8,433 (reported on 24.3% of returns)
Here:
+$8,433
State:
+$12,606
(% of AGI for various income ranges: 20.3% for AGIs below $25k, 16.7% for AGIs $25k-50k, 1.0% for AGIs $100k-200k)
Taxable individual retirement arrangement distribution: $8,500 (reported on 10.8% of returns)
20868:
$8,500
Maryland:
$17,065
Total itemized deductions: $30,686 (27% of AGI, reported on 56.8% of returns)
Here:
$30,686
State:
$27,886
Here:
27.1% of AGI
State:
22.8% of AGI
(% of AGI for various income ranges: 33.5% for AGIs $25k-50k, 22.2% for AGIs $50k-75k, 24.9% for AGIs $75k-100k, 24.8% for AGIs $100k-200k, 19.7% for AGIs over 200k)
Charity contributions: $3,576 (reported on 45.9% of returns)
Here:
$3,576
State:
$4,452
(% of AGI for various income ranges: 3.5% for AGIs $25k-50k, 2.2% for AGIs $50k-75k, 2.7% for AGIs $75k-100k, 2.5% for AGIs $100k-200k, 1.4% for AGIs over 200k)
Taxes paid: $12,471 (reported on 56.8% of returns)
20868:
$12,471
State:
$11,690
(% of AGI for various income ranges: 8.7% for AGIs $25k-50k, 6.1% for AGIs $50k-75k, 9.3% for AGIs $75k-100k, 10.5% for AGIs $100k-200k, 10.4% for AGIs over 200k)
Earned income credit: $1,950 (reported on 10.8% of returns)
Here:
$1,950
State:
$2,199
(% of AGI for various income ranges: 6.2% for AGIs below $25k)
Percentage of individuals using paid preparers for their 2012 taxes: 54.1%
Here:
54%
State:
52%
(% for various income ranges: 54.5% for AGIs below $25k, 57.1% for AGIs $25k-50k, 60.0% for AGIs $50k-75k, 50.0% for AGIs $75k-100k, 71.4% for AGIs $100k-200k)
Averages for the 2004 tax year for zip code 20868, filed in 2005:
Average Adjusted Gross Income (AGI) in 2004: $70,908 (Individual Income Tax Returns)
Here:
$70,908
State:
$60,339
Salary/wage: $61,124 (reported on 86.7% of returns)
Here:
$61,124
State:
$52,211
(% of AGI for various income ranges: 240.2% for AGIs below $10k, 87.8% for AGIs $10k-25k, 78.2% for AGIs $25k-50k, 67.3% for AGIs $50k-75k, 91.2% for AGIs $75k-100k, 69.0% for AGIs over 100k)
Taxable interest for individuals: $1,158 (reported on 57.9% of returns)
This zip code:
$1,158
Maryland:
$1,701
(% of AGI for various income ranges: 8.2% for AGIs below $10k, 0.6% for AGIs $10k-25k, 0.5% for AGIs $25k-50k, 0.9% for AGIs $50k-75k, 0.5% for AGIs $75k-100k, 1.1% for AGIs over 100k)
Taxable dividends: $3,275 (reported on 25.3% of returns)
Here:
$3,275
State:
$4,235
(% of AGI for various income ranges: 2.3% for AGIs $10k-25k, 0.6% for AGIs $50k-75k, 1.8% for AGIs over 100k)
Net capital gain/loss: +$5,438 (reported on 20.3% of returns)
Here:
+$5,438
State:
+$15,888
Profit/loss from business: +$9,699 (reported on 23.1% of returns)
Here:
+$9,699
State:
+$12,221
(% of AGI for various income ranges: 10.3% for AGIs $10k-25k, 6.4% for AGIs $25k-50k, 12.1% for AGIs $50k-75k, -2.2% for AGIs $75k-100k, 1.5% for AGIs over 100k)
Total itemized deductions: $26,989 (25% of AGI, reported on 57.0% of returns)
Here:
$26,989
State:
$22,960
Here:
25.2% of AGI
State:
23.3% of AGI
(% of AGI for various income ranges: 21.6% for AGIs $25k-50k, 22.5% for AGIs $50k-75k, 31.9% for AGIs $75k-100k, 20.6% for AGIs over 100k)
Charity contributions deductions: $3,938 (3% of AGI, reported on 50.6% of returns)
Here:
$3,938
State:
$4,031
Here:
3.5% of AGI
State:
3.9% of AGI
(% of AGI for various income ranges: 3.1% for AGIs $25k-50k, 3.1% for AGIs $50k-75k, 3.1% for AGIs $75k-100k, 2.8% for AGIs over 100k)
Total tax: $10,857 (reported on 86.1% of returns)
20868:
$10,857
State:
$10,167
(% of AGI for various income ranges: 9.0% for AGIs below $10k, 4.5% for AGIs $10k-25k, 7.4% for AGIs $25k-50k, 9.8% for AGIs $50k-75k, 9.3% for AGIs $75k-100k, 16.7% for AGIs over 100k)
Earned income credit: $1,636 (reported on 10.4% of returns)
Here:
$1,636
State:
$1,700
Percentage of individuals using paid preparers for their 2004 taxes: 54.1%
Here:
54%
State:
55%
(% for various income ranges: 55.8% for AGIs below $10k, 55.1% for AGIs $10k-25k, 39.7% for AGIs $25k-50k, 61.4% for AGIs $50k-75k, 59.5% for AGIs $75k-100k, 60.0% for AGIs over 100k)
Size of family households: 22 2-persons, 46 4-persons, 68 5-persons, 13 6-persons
223 married couples with children.
0 single-parent households ().
37.5% of residents of 20868 zip code speak English at home.
43.5% of residents speak Spanish at home (55% very well, 26% well, 19% not well).
14.6% of residents speak other Indo-European language at home (100% very well).
4.0% of residents speak Asian or Pacific Island language at home (100% well).
Foreign born population: 167 (26.5%) (42.8% of them are naturalized citizens)
This zip code:
26.5%
Whole state:
16.7%
46%Costa Rica
21%El Salvador
13%St. Vincent and the Grenadines
11%Haiti
7%Singapore
28%American
5%Trinidadian and Tobagonian
4%Jamaican
Year of entry for the foreign-born population
02010 or later
382000 to 2009
01990 to 1999
145Before 1990
47.9%Fuel oil, kerosene, etc.
35.3%Electricity
18.0%Utility gas
Population in 1990: 278.
Place of birth for U.S.-born residents:
This state: 209
Northeast: 61
South: 162
77% of the 20868 zip code residents lived in the same house 5 years ago. Out of people who lived in different houses, 41% lived in this county. Out of people who lived in different counties, 50% lived in Maryland.
101% of the 20868 zip code residents lived in the same house 1 year ago.
Private vs. public school enrollment:
Students in private schools in grades 1 to 8 (elementary and middle school): 19
Here:
18.3%
Maryland:
15.2%
Students in private schools in grades 9 to 12 (high school): 32
Here:
100.0%
Maryland:
14.4%
Students in private undergraduate colleges:
Here:
0.0%
Maryland:
20.2%
Occupation by median earnings in the past 12 months ($)
24,959Building and grounds cleaning and maintenance occupations
19,176Construction and extraction occupations
Top industries in this zip code by the number of employees in 2005:
Administrative and Support and Waste Management and Remediation Services: Landscaping Services (100-249 employees: 1 establishment, 20-49 employees: 2 establishments, 5-9 employees: 3 establishments, 1-4 employees: 3 establishments)
Other Services (except Public Administration): Professional Organizations (20-49: 1)
Construction: Electrical Contractors (10-19: 1)
Construction: Masonry Contractors (10-19: 1)
Construction: Residential Remodelers (1-4: 2)
Information: Internet Service Providers (1-4: 1)
Wholesale Trade: Fresh Fruit and Vegetable Merchant Wholesalers (1-4: 1)
Finance and Insurance: Trust, Fiduciary, and Custody Activities (1-4: 1)
Construction: Land Subdivision (1-4: 1)
Home Mortgage Disclosure Act Aggregated Statistics For Year 2009 (Based on 2 partial tracts)
A) FHA, FSA/RHS & VA Home Purchase Loans
B) Conventional Home Purchase Loans
C) Refinancings
D) Home Improvement Loans
F) Non-occupant Loans on < 5 Family Dwellings (A B C & D)
Number
Average Value
Number
Average Value
Number
Average Value
Number
Average Value
Number
Average Value
LOANS ORIGINATED
3
$431,457
3
$498,120
33
$348,544
1
$199,130
1
$236,580
APPLICATIONS APPROVED, NOT ACCEPTED
0
$0
1
$187,390
2
$239,130
0
$0
0
$0
APPLICATIONS DENIED
0
$0
1
$153,010
10
$412,037
1
$24,510
1
$284,570
APPLICATIONS WITHDRAWN
1
$277,430
2
$519,110
8
$386,375
0
$0
0
$0
FILES CLOSED FOR INCOMPLETENESS
0
$0
0
$0
4
$321,338
0
$0
0
$0
Aggregated Statistics For Year 2008 (Based on 2 partial tracts)
A) FHA, FSA/RHS & VA Home Purchase Loans
B) Conventional Home Purchase Loans
C) Refinancings
D) Home Improvement Loans
F) Non-occupant Loans on < 5 Family Dwellings (A B C & D)
Number
Average Value
Number
Average Value
Number
Average Value
Number
Average Value
Number
Average Value
LOANS ORIGINATED
1
$603,020
6
$449,073
12
$361,249
3
$115,340
1
$198,110
APPLICATIONS APPROVED, NOT ACCEPTED
0
$0
1
$421,590
4
$307,850
0
$0
0
$0
APPLICATIONS DENIED
0
$0
1
$313,850
8
$471,944
2
$176,925
0
$0
APPLICATIONS WITHDRAWN
0
$0
2
$286,020
4
$466,560
1
$206,960
1
$114,540
FILES CLOSED FOR INCOMPLETENESS
0
$0
0
$0
2
$426,350
0
$0
0
$0
Aggregated Statistics For Year 2007 (Based on 2 partial tracts)
B) Conventional Home Purchase Loans
C) Refinancings
D) Home Improvement Loans
F) Non-occupant Loans on < 5 Family Dwellings (A B C & D)
Number
Average Value
Number
Average Value
Number
Average Value
Number
Average Value
LOANS ORIGINATED
13
$497,769
23
$407,030
3
$192,497
1
$132,420
APPLICATIONS APPROVED, NOT ACCEPTED
4
$394,395
6
$344,400
1
$122,880
0
$0
APPLICATIONS DENIED
5
$586,986
15
$496,621
3
$128,670
1
$403,540
APPLICATIONS WITHDRAWN
3
$591,843
7
$353,506
1
$153,180
1
$441,330
FILES CLOSED FOR INCOMPLETENESS
0
$0
3
$406,550
0
$0
0
$0
Aggregated Statistics For Year 2006 (Based on 2 partial tracts)
B) Conventional Home Purchase Loans
C) Refinancings
D) Home Improvement Loans
F) Non-occupant Loans on < 5 Family Dwellings (A B C & D)
Number
Average Value
Number
Average Value
Number
Average Value
Number
Average Value
LOANS ORIGINATED
20
$386,210
33
$407,789
4
$221,600
1
$248,490
APPLICATIONS APPROVED, NOT ACCEPTED
2
$406,265
7
$291,820
0
$0
0
$0
APPLICATIONS DENIED
5
$443,064
16
$464,614
2
$239,300
0
$0
APPLICATIONS WITHDRAWN
3
$389,643
12
$483,183
1
$113,520
0
$0
FILES CLOSED FOR INCOMPLETENESS
1
$496,640
2
$410,780
0
$0
0
$0
Aggregated Statistics For Year 2005 (Based on 2 partial tracts)
B) Conventional Home Purchase Loans
C) Refinancings
D) Home Improvement Loans
F) Non-occupant Loans on < 5 Family Dwellings (A B C & D)
Number
Average Value
Number
Average Value
Number
Average Value
Number
Average Value
LOANS ORIGINATED
25
$423,498
43
$367,584
5
$210,436
2
$303,975
APPLICATIONS APPROVED, NOT ACCEPTED
2
$500,305
5
$342,442
1
$88,670
0
$0
APPLICATIONS DENIED
5
$415,084
11
$424,881
3
$244,690
0
$0
APPLICATIONS WITHDRAWN
5
$432,206
14
$405,112
1
$191,650
1
$160,840
FILES CLOSED FOR INCOMPLETENESS
1
$625,490
4
$338,910
0
$0
0
$0
Aggregated Statistics For Year 2004 (Based on 2 partial tracts)
B) Conventional Home Purchase Loans
C) Refinancings
D) Home Improvement Loans
F) Non-occupant Loans on < 5 Family Dwellings (A B C & D)
Number
Average Value
Number
Average Value
Number
Average Value
Number
Average Value
LOANS ORIGINATED
23
$401,946
50
$320,548
3
$181,603
2
$237,175
APPLICATIONS APPROVED, NOT ACCEPTED
2
$464,730
7
$338,893
1
$133,610
0
$0
APPLICATIONS DENIED
4
$461,072
15
$386,978
2
$98,885
0
$0
APPLICATIONS WITHDRAWN
2
$362,695
18
$370,006
1
$166,970
1
$416,140
FILES CLOSED FOR INCOMPLETENESS
1
$219,390
5
$395,000
0
$0
1
$128,330
Aggregated Statistics For Year 2003 (Based on 2 partial tracts)
B) Conventional Home Purchase Loans
C) Refinancings
D) Home Improvement Loans
F) Non-occupant Loans on < 5 Family Dwellings (A B C & D)
Number
Average Value
Number
Average Value
Number
Average Value
Number
Average Value
LOANS ORIGINATED
22
$368,011
125
$292,800
2
$89,185
2
$321,935
APPLICATIONS APPROVED, NOT ACCEPTED
1
$327,630
12
$325,734
2
$37,615
0
$0
APPLICATIONS DENIED
3
$254,733
21
$384,214
2
$26,805
1
$144,500
APPLICATIONS WITHDRAWN
2
$314,275
17
$298,231
1
$188,580
1
$175,140
FILES CLOSED FOR INCOMPLETENESS
0
$0
3
$529,607
0
$0
0
$0
Aggregated Statistics For Year 2002 (Based on 2 partial tracts)
B) Conventional Home Purchase Loans
C) Refinancings
D) Home Improvement Loans
F) Non-occupant Loans on < 5 Family Dwellings (A B C & D)
Number
Average Value
Number
Average Value
Number
Average Value
Number
Average Value
LOANS ORIGINATED
31
$339,154
75
$270,652
3
$17,303
2
$137,180
APPLICATIONS APPROVED, NOT ACCEPTED
3
$343,067
9
$266,949
1
$41,020
1
$92,930
APPLICATIONS DENIED
2
$265,340
12
$266,122
2
$21,190
0
$0
APPLICATIONS WITHDRAWN
4
$396,992
11
$288,891
0
$0
0
$0
FILES CLOSED FOR INCOMPLETENESS
2
$414,350
3
$281,283
0
$0
0
$0
Aggregated Statistics For Year 2001 (Based on 2 partial tracts)
A) FHA, FSA/RHS & VA Home Purchase Loans
B) Conventional Home Purchase Loans
C) Refinancings
D) Home Improvement Loans
F) Non-occupant Loans on < 5 Family Dwellings (A B C & D)
Number
Average Value
Number
Average Value
Number
Average Value
Number
Average Value
Number
Average Value
LOANS ORIGINATED
1
$118,970
31
$281,972
48
$249,960
2
$45,360
1
$235,730
APPLICATIONS APPROVED, NOT ACCEPTED
0
$0
5
$303,842
5
$234,026
1
$21,620
0
$0
APPLICATIONS DENIED
0
$0
3
$358,780
9
$228,768
2
$66,635
0
$0
APPLICATIONS WITHDRAWN
0
$0
4
$306,360
10
$181,961
1
$32,680
0
$0
FILES CLOSED FOR INCOMPLETENESS
0
$0
1
$217,350
2
$269,170
1
$26,040
0
$0
Aggregated Statistics For Year 2000 (Based on 2 partial tracts)
A) FHA, FSA/RHS & VA Home Purchase Loans
B) Conventional Home Purchase Loans
C) Refinancings
D) Home Improvement Loans
F) Non-occupant Loans on < 5 Family Dwellings (A B C & D)
Number
Average Value
Number
Average Value
Number
Average Value
Number
Average Value
Number
Average Value
LOANS ORIGINATED
1
$236,750
25
$249,166
9
$176,951
2
$51,995
1
$63,310
APPLICATIONS APPROVED, NOT ACCEPTED
0
$0
2
$179,220
2
$254,365
1
$14,300
0
$0
APPLICATIONS DENIED
0
$0
5
$217,108
6
$216,552
2
$40,420
0
$0
APPLICATIONS WITHDRAWN
0
$0
4
$241,982
4
$168,795
1
$47,490
0
$0
FILES CLOSED FOR INCOMPLETENESS
0
$0
1
$407,460
2
$146,885
0
$0
0
$0
Aggregated Statistics For Year 1999 (Based on 1 partial tract)


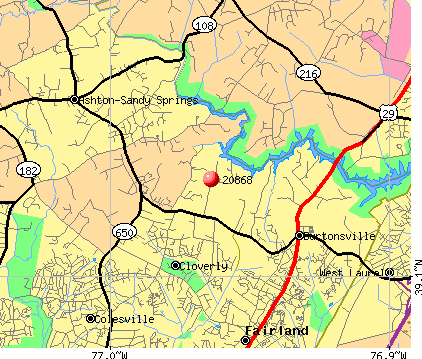 Nearest zip codes: 20905, 20861, 20866, 20759, 20777, 20860.


