Estimated zip code population in 2022: 2,280 Zip code population in 2010: 2,396 Zip code population in 2000: 1,251
Houses and condos: 820 Renter-occupied apartments: 137
% of renters here:
17%
State:
32%
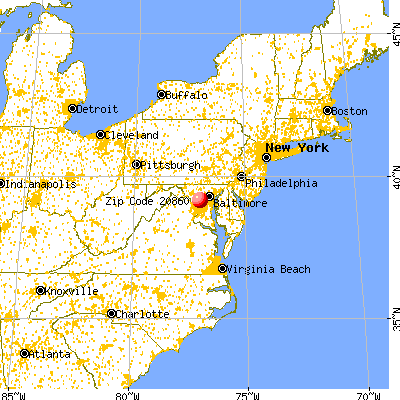
March 2022 cost of living index in zip code 20860: 178.8 (very high, U.S. average is 100)
Land area: 3.8 sq. mi. Water area: 0.0 sq. mi.
Population density: 599 people per square mile
(low).
OSM Map
General Map
Google Map
MSN Map
OSM Map
General Map
Google Map
MSN Map
OSM Map
General Map
Google Map
MSN Map
OSM Map
General Map
Google Map
MSN Map
Please wait while loading the map...
Real estate property taxes paid for housing units in 2022:
This zip code:
0.8% ($6,248)
Maryland:
0.9% ($3,777)
Median real estate property taxes paid for housing units with mortgages in 2022: $5,644 (0.7%) Median real estate property taxes paid for housing units with no mortgage in 2022: $8,530 (1.0%)
Business Search- 14 Million verified businesses
Males: 1,141
(50.1%)
Females: 1,138
(49.9%)
For population 25 years and over in 20860:
High school or higher: 83.9%
Bachelor's degree or higher: 53.9%
Graduate or professional degree: 28.0%
Unemployed: 4.5%
Mean travel time to work (commute): 39.7 minutes
For population 15 years and over in 20860:
Never married: 29.2%
Now married: 48.3%
Separated: 0.4%
Widowed: 7.0%
Divorced: 15.0%
Zip code 20860 compared to state average:
Median household income above state average.
Median house value above state average.
Black race population percentage below state average.
Median age significantly above state average.
Renting percentage below state average.
House age below state average.
Number of college students significantly below state average.
Estimated median house/condo value in 2022: $743,364
20860:
$743,364
Maryland:
$398,100
According to our research of Maryland and other state lists, there was 1 registered sex offender living in 20860 zip code as of July 03, 2024. The ratio of all residents to sex offenders in zip code 20860 is 2,780 to 1. The ratio of registered sex offenders to all residents in this zip code is much lower than the state average.
Median resident age:
This zip code:
51.7 years
Maryland median age:
39.7 years
Average household size:
This zip code:
2.4 people
Maryland:
2.5 people
Averages for the 2020 tax year for zip code 20860, filed in 2021:
Average Adjusted Gross Income (AGI) in 2020: $182,411 (Individual Income Tax Returns)
Here:
$182,411
State:
$86,905
Salary/wage: $144,670 (reported on 69.0% of returns)
Here:
$144,670
State:
$73,953
(% of AGI for various income ranges: 1022.7% for AGIs below $25k, 3496.0% for AGIs $25k-50k, 6098.8% for AGIs $50k-75k, 7952.0% for AGIs $75k-100k, 16821.2% for AGIs $100k-200k, 144960.0% for AGIs over 200k)
Taxable interest for individuals: $1,782 (reported on 55.0% of returns)
This zip code:
$1,782
Maryland:
$1,528
(% of AGI for various income ranges: 22.7% for AGIs below $25k, 15.0% for AGIs $25k-50k, 17.5% for AGIs $50k-75k, 120.0% for AGIs $75k-100k, 352.5% for AGIs $100k-200k, 1150.0% for AGIs over 200k)
Ordinary dividends: $12,803 (reported on 39.0% of returns)
Here:
$12,803
State:
$8,028
(% of AGI for various income ranges: 72.0% for AGIs below $25k, 127.0% for AGIs $25k-50k, 176.2% for AGIs $50k-75k, 696.0% for AGIs $75k-100k, 1492.5% for AGIs $100k-200k, 6150.0% for AGIs over 200k)
Net capital gain/loss in AGI: +$34,370 (reported on 40.0% of returns)
Here:
+$34,370
State:
+$25,238
(% of AGI for various income ranges: 61.3% for AGIs below $25k, 28.0% for AGIs $25k-50k, 111.2% for AGIs $50k-75k, 398.0% for AGIs $75k-100k, 1065.0% for AGIs $100k-200k, 24976.0% for AGIs over 200k)
Profit/loss from business: +$16,777 (reported on 22.0% of returns)
Here:
+$16,777
State:
+$11,398
(% of AGI for various income ranges: 203.3% for AGIs below $25k, 297.0% for AGIs $25k-50k, 690.0% for AGIs $50k-75k, 220.0% for AGIs $100k-200k, 4722.0% for AGIs over 200k)
Taxable individual retirement arrangement distribution: $22,694 (reported on 16.0% of returns)
20860:
$22,694
Maryland:
$20,944
(% of AGI for various income ranges: 589.0% for AGIs $25k-50k, 1336.0% for AGIs $75k-100k, 1128.8% for AGIs $100k-200k, 2942.0% for AGIs over 200k)
Self-employed (Keogh) retirement plans: $31,467 (reported on 3.0% of returns)
20860:
$31,467
Maryland:
$29,558
(% of AGI for various income ranges: 1888.0% for AGIs over 200k)
Total itemized deductions: $43,006 (reported on 34.0% of returns)
Here:
$43,006
State:
$30,672
(% of AGI for various income ranges: 621.0% for AGIs $25k-50k, 967.5% for AGIs $50k-75k, 1822.0% for AGIs $75k-100k, 3767.5% for AGIs $100k-200k, 18604.0% for AGIs over 200k)
Charity contributions: $12,380 (reported on 30.0% of returns)
Here:
$12,380
State:
$9,065
(% of AGI for various income ranges: 245.0% for AGIs $50k-75k, 328.0% for AGIs $75k-100k, 682.5% for AGIs $100k-200k, 5616.0% for AGIs over 200k)
Taxes paid: $8,873 (reported on 33.0% of returns)
20860:
$8,873
State:
$8,475
(% of AGI for various income ranges: 128.0% for AGIs $25k-50k, 220.0% for AGIs $50k-75k, 458.0% for AGIs $75k-100k, 865.0% for AGIs $100k-200k, 3406.0% for AGIs over 200k)
Earned income credit: $2,638 (reported on 8.0% of returns)
Here:
$2,638
State:
$2,151
(% of AGI for various income ranges: 102.0% for AGIs below $25k, 58.0% for AGIs $25k-50k)
Percentage of individuals using paid preparers for their 2020 taxes: 89.0%
Here:
89%
State:
90%
(% for various income ranges: 84.6% for AGIs below $25k, 92.9% for AGIs $25k-50k, 91.7% for AGIs $50k-75k, 88.9% for AGIs $75k-100k, 88.2% for AGIs $100k-200k, 90.9% for AGIs over 200k)
Averages for the 2012 tax year for zip code 20860, filed in 2013:
Average Adjusted Gross Income (AGI) in 2012: $130,230 (Individual Income Tax Returns)
Here:
$130,230
State:
$72,703
Salary/wage: $113,510 (reported on 69.7% of returns)
Here:
$113,510
State:
$62,228
(% of AGI for various income ranges: 59.6% for AGIs below $25k, 62.5% for AGIs $25k-50k, 53.9% for AGIs $50k-75k, 50.2% for AGIs $75k-100k, 58.0% for AGIs $100k-200k, 62.7% for AGIs over 200k)
Taxable interest for individuals: $1,598 (reported on 58.4% of returns)
This zip code:
$1,598
Maryland:
$1,413
(% of AGI for various income ranges: 1.4% for AGIs below $25k, 1.2% for AGIs $25k-50k, 1.7% for AGIs $50k-75k, 1.2% for AGIs $75k-100k, 1.0% for AGIs $100k-200k, 0.5% for AGIs over 200k)
Ordinary dividends: $10,211 (reported on 42.7% of returns)
Here:
$10,211
State:
$6,933
(% of AGI for various income ranges: 5.1% for AGIs below $25k, 2.6% for AGIs $25k-50k, 3.8% for AGIs $50k-75k, 3.4% for AGIs $75k-100k, 4.6% for AGIs $100k-200k, 3.0% for AGIs over 200k)
Net capital gain/loss in AGI: +$10,074 (reported on 39.3% of returns)
Here:
+$10,074
State:
+$14,830
(% of AGI for various income ranges: 0.5% for AGIs below $25k, 0.7% for AGIs $50k-75k, 0.9% for AGIs $75k-100k, 2.9% for AGIs $100k-200k, 3.8% for AGIs over 200k)
Profit/loss from business: +$19,760 (reported on 16.9% of returns)
Here:
+$19,760
State:
+$12,606
(% of AGI for various income ranges: 10.1% for AGIs below $25k, 7.0% for AGIs $50k-75k, 2.6% for AGIs $100k-200k, 2.3% for AGIs over 200k)
Taxable individual retirement arrangement distribution: $19,033 (reported on 16.9% of returns)
20860:
$19,033
Maryland:
$17,065
(% of AGI for various income ranges: 7.9% for AGIs below $25k, 4.1% for AGIs $25k-50k, 2.9% for AGIs $50k-75k, 6.5% for AGIs $75k-100k, 4.5% for AGIs $100k-200k, 1.2% for AGIs over 200k)
Self-employment retirement plans: $28,900 (reported on 2.2% of returns)
20860:
$28,900
Maryland:
$24,439
(% of AGI for various income ranges: 2.8% for AGIs $100k-200k)
Total itemized deductions: $45,102 (21% of AGI, reported on 56.2% of returns)
Here:
$45,102
State:
$27,886
Here:
21.5% of AGI
State:
22.8% of AGI
(% of AGI for various income ranges: 21.6% for AGIs below $25k, 18.5% for AGIs $25k-50k, 20.9% for AGIs $50k-75k, 24.9% for AGIs $75k-100k, 22.4% for AGIs $100k-200k, 18.1% for AGIs over 200k)
Charity contributions: $7,186 (reported on 49.4% of returns)
Here:
$7,186
State:
$4,452
(% of AGI for various income ranges: 1.8% for AGIs below $25k, 2.5% for AGIs $25k-50k, 2.1% for AGIs $50k-75k, 5.4% for AGIs $75k-100k, 2.7% for AGIs $100k-200k, 2.6% for AGIs over 200k)
Taxes paid: $20,130 (reported on 56.2% of returns)
20860:
$20,130
State:
$11,690
(% of AGI for various income ranges: 4.2% for AGIs below $25k, 3.2% for AGIs $25k-50k, 6.2% for AGIs $50k-75k, 8.0% for AGIs $75k-100k, 8.9% for AGIs $100k-200k, 9.4% for AGIs over 200k)
Earned income credit: $1,988 (reported on 9.0% of returns)
Here:
$1,988
State:
$2,199
(% of AGI for various income ranges: 3.9% for AGIs below $25k, 1.0% for AGIs $25k-50k)
Percentage of individuals using paid preparers for their 2012 taxes: 58.4%
Here:
58%
State:
52%
(% for various income ranges: 51.9% for AGIs below $25k, 57.1% for AGIs $25k-50k, 60.0% for AGIs $50k-75k, 57.1% for AGIs $75k-100k, 60.0% for AGIs $100k-200k, 68.8% for AGIs over 200k)
Averages for the 2004 tax year for zip code 20860, filed in 2005:
Average Adjusted Gross Income (AGI) in 2004: $90,391 (Individual Income Tax Returns)
Here:
$90,391
State:
$60,339
Salary/wage: $78,726 (reported on 70.3% of returns)
Here:
$78,726
State:
$52,211
(% of AGI for various income ranges: 74.8% for AGIs below $10k, 56.8% for AGIs $10k-25k, 70.6% for AGIs $25k-50k, 59.6% for AGIs $50k-75k, 56.5% for AGIs $75k-100k, 60.7% for AGIs over 100k)
Taxable interest for individuals: $2,069 (reported on 59.5% of returns)
This zip code:
$2,069
Maryland:
$1,701
(% of AGI for various income ranges: 8.1% for AGIs below $10k, 3.5% for AGIs $10k-25k, 1.1% for AGIs $25k-50k, 2.3% for AGIs $50k-75k, 2.4% for AGIs $75k-100k, 1.0% for AGIs over 100k)
Taxable dividends: $6,026 (reported on 39.8% of returns)
Here:
$6,026
State:
$4,235
(% of AGI for various income ranges: 8.3% for AGIs below $10k, 4.4% for AGIs $10k-25k, 2.8% for AGIs $25k-50k, 2.5% for AGIs $50k-75k, 2.5% for AGIs $75k-100k, 2.5% for AGIs over 100k)
Net capital gain/loss: +$19,500 (reported on 31.8% of returns)
Here:
+$19,500
State:
+$15,888
(% of AGI for various income ranges: -4.1% for AGIs below $10k, 0.0% for AGIs $10k-25k, 0.0% for AGIs $25k-50k, -0.3% for AGIs $50k-75k, 0.2% for AGIs $75k-100k, 9.5% for AGIs over 100k)
Profit/loss from business: +$20,409 (reported on 16.8% of returns)
Here:
+$20,409
State:
+$12,221
(% of AGI for various income ranges: 13.3% for AGIs below $10k, 6.1% for AGIs $10k-25k, 2.8% for AGIs $25k-50k, -0.2% for AGIs $50k-75k, 0.1% for AGIs $75k-100k, 4.5% for AGIs over 100k)
Self-employed pension: $30,062 (reported on 2.3% of returns)
Here:
$30,062
Maryland:
$17,155
Total itemized deductions: $33,528 (23% of AGI, reported on 54.4% of returns)
Here:
$33,528
State:
$22,960
Here:
22.7% of AGI
State:
23.3% of AGI
(% of AGI for various income ranges: 26.4% for AGIs $10k-25k, 23.0% for AGIs $25k-50k, 26.1% for AGIs $50k-75k, 27.0% for AGIs $75k-100k, 18.5% for AGIs over 100k)
Charity contributions deductions: $6,049 (4% of AGI, reported on 50.1% of returns)
Here:
$6,049
State:
$4,031
Here:
3.9% of AGI
State:
3.9% of AGI
(% of AGI for various income ranges: 2.3% for AGIs $10k-25k, 3.8% for AGIs $25k-50k, 3.5% for AGIs $50k-75k, 6.1% for AGIs $75k-100k, 3.1% for AGIs over 100k)
Total tax: $19,913 (reported on 78.6% of returns)
20860:
$19,913
State:
$10,167
(% of AGI for various income ranges: 3.0% for AGIs below $10k, 4.2% for AGIs $10k-25k, 7.5% for AGIs $25k-50k, 8.9% for AGIs $50k-75k, 10.1% for AGIs $75k-100k, 20.9% for AGIs over 100k)
Earned income credit: $1,650 (reported on 8.7% of returns)
Here:
$1,650
State:
$1,700
Percentage of individuals using paid preparers for their 2004 taxes: 56.0%
Here:
56%
State:
55%
(% for various income ranges: 44.9% for AGIs below $10k, 52.3% for AGIs $10k-25k, 56.6% for AGIs $25k-50k, 49.2% for AGIs $50k-75k, 65.6% for AGIs $75k-100k, 65.3% for AGIs over 100k)
Household received Food Stamps/SNAP in the past 12 months: 0 Household did not receive Food Stamps/SNAP in the past 12 months: 803
Women who had a birth in the past 12 months: 38 (39 now married, 0 unmarried) Women who did not have a birth in the past 12 months: 262 (151 now married, 111 unmarried)
Housing units in zip code 20860 with a mortgage: 534 (80 second mortgage, 29 both second mortgage and home equity loan) Houses without a mortgage: 17
Median monthly owner costs for units with a mortgage: $3,108 Median monthly owner costs for units without a mortgage: $1,407
Residents with income below the poverty level in 2022:
This zip code:
4.0%
Whole state:
9.6%
Residents with income below 50% of the poverty level in 2022:
This zip code:
1.0%
Whole state:
4.7%
Median number of rooms in houses and condos:
Here:
6.7
State:
7.3
Median number of rooms in apartments:
Here:
4.3
State:
4.2
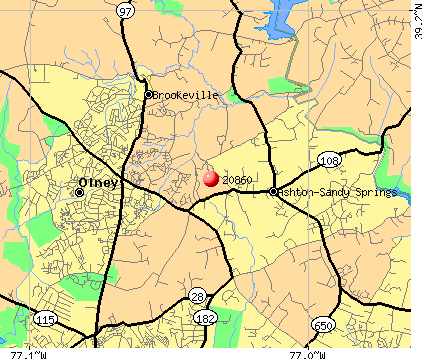
Notable locations in this zip code not listed on our city pages
Notable locations in zip code 20860: Fire Station Company 4 (A), Sandy Spring Community Center (B), Sherwood Library (C), The Meadows Assisted Living Center (D), Brooke Grove Rehabilitation and Nursing Center (E), Sandy Spring Volunteer Fire Department Station 4 (F). Display/hide their locations on the map
Churches in zip code 20860 include: Sandy Spring Friends Meeting House Church (A), Sharp Street United Methodist Church (B). Display/hide their locations on the map
In group quarters: 323 (-1 institutionalized population)
Size of family households: 232 2-persons, 269 3-persons, 105 4-persons, 19 5-persons, 25 6-persons, 8 7-or-more-persons
Size of nonfamily households: 112 1-person, 36 2-persons
412 married couples with children.
0 single-parent households ().
75.5% of residents of 20860 zip code speak English at home.
12.6% of residents speak Spanish at home (36% very well, 64% not well).
7.5% of residents speak other Indo-European language at home (64% very well, 36% well).
2.6% of residents speak Asian or Pacific Island language at home (71% well, 29% not at all).
0.9% of residents speak other language at home (100% well).
Foreign born population: 519 (22.8%) (73.4% of them are naturalized citizens)
This zip code:
22.8%
Whole state:
16.7%
36%Costa Rica
25%Afghanistan
9%India
7%Thailand
6%Nepal
5%Sweden
5%Cabo Verde
9%German
7%English
4%Eastern European
4%Ghanaian
3%Italian
3%Irish
2%Swedish
Year of entry for the foreign-born population
1442010 or later
222000 to 2009
1341990 to 1999
231Before 1990
Facilities with environmental interests located in this zip code:
BROOKE ROAD 18529 (18529 BROOKE ROAD in SANDY SPRING, MD)
AIR MINOR (AIRS/AFS) STATE MASTER (Maryland Air Emissions Database) - AIR MINOR Business SIC classification: OPERATORS OF APARTMENT BUILDINGS
EXXON RAS #21823 (1640 LAYHILL RD in SANDY SPRING, MD)
Conditionally Exempt Small Quantity Generators, less than 100 kg/month of hazardous waste (Resource Conservation and Recovery Act (tracking hazardous waste)) - notification Organizations: OPERNAME (CONTACT/OPERATOR)
, EXXON MOBIL (CONTACT/OWNER)
Alternative names: EXXON CO USA #21823
LOWEST COST (501 OLNEY SANDY SPRING RD. in SANDY SPRING, MD)
AIR MINOR (AIRS/AFS) Business SIC classification: GASOLINE SERVICE STATIONS Alternative names: AMOCO 501 OLNEY SANDY SPRING ROAD
MSP AVIATION NORWOOD DIV (16501 NORWOOD RD in SANDY SPRING, MD)
Small Quantity Generators, between 100 kg and 1000 kg of hazardous waste/month (Resource Conservation and Recovery Act (tracking hazardous waste)) - notification Organizations: MARYLAND STATE POLICE (CONTACT/OWNER)
Housing units lacking complete kitchen facilities: 1.8%
46.5%Electricity
41.7%Utility gas
10.0%Fuel oil, kerosene, etc.
2.0%Bottled, tank, or LP gas
Population in 1990: 1,890.
Place of birth for U.S.-born residents:
This state: 991
Northeast: 252
Midwest: 77
South: 415
West: 3
52% of the 20860 zip code residents lived in the same house 5 years ago. Out of people who lived in different houses, 64% lived in this county. Out of people who lived in different counties, 50% lived in Maryland.
91% of the 20860 zip code residents lived in the same house 1 year ago. Out of people who lived in different houses, 26% moved from this county. Out of people who lived in different houses, 26% moved from different county within same state. Out of people who lived in different houses, 48% moved from different state.
Private vs. public school enrollment:
Students in private schools in grades 1 to 8 (elementary and middle school): 26
Here:
23.6%
Maryland:
15.2%
Students in private schools in grades 9 to 12 (high school): 65
Here:
34.8%
Maryland:
14.4%
Students in private undergraduate colleges:
Here:
0.0%
Maryland:
20.2%
Occupation by median earnings in the past 12 months ($)
246,026Management occupations
242,944Sales and related occupations
214,241Health diagnosing and treating practitioners and other technical occupations
111,734Computer and mathematical occupations
90,083Business and financial operations occupations
61,566Health technologists and technicians
Companies with federal contracts located in this zip code:
PHIL'S FONTS (501 OLNEY SANDY SPRING RD in SANDY SPRING, MD; small business) : $14,860 in 3 contractsfrom 2003 to 2005
$11,935 with Department of State for Other Professional Services. Taking place in DC. Signed on 2003-09-30. Completion date: 2003-09-30.
$2,925 with Army for ADP Software. Taking place in VA. Signed on 2005-09-20. Completion date: 2005-10-31.
$0 with Department of State for Other Professional Services. Taking place in DC. Signed on 2003-10-03. Completion date: 2003-10-03.
Top industries in this zip code by the number of employees in 2005:
Health Care and Social Assistance: Nursing Care Facilities (100-249 employees: 2 establishments, 20-49 employees: 1 establishment)
Educational Services: Elementary and Secondary Schools (100-249: 1)
Health Care and Social Assistance: Homes for the Elderly (50-99: 1, 20-49: 1, 5-9: 1, 1-4: 1)
Construction: Electrical Contractors (50-99: 1)
Health Care and Social Assistance: Child Day Care Services (20-49: 1)
Construction: Commercial and Institutional Building Construction (20-49: 1)
Management of Companies and Enterprises: Corporate, Subsidiary, and Regional Managing Offices (20-49: 1)
Real Estate and Rental and Leasing: Lessors of Residential Buildings and Dwellings (20-49: 1)
Professional, Scientific, and Technical Services: Veterinary Services (20-49: 1)
Other Services (except Public Administration): Religious Organizations (10-19: 1, 1-4: 2)
People in group quarters in 2010:
216 people in nursing facilities/skilled-nursing facilities
43 people in workers' group living quarters and job corps centers
2 people in group homes intended for adults
People in group quarters in 2000:
121 people in nursing homes
71 people in other noninstitutional group quarters
Fatal accident statistics in 2010:
Fatal accident count: 2
Vehicles involved in fatal accidents: 2
Fatal accidents caused by drunken drivers: 1
Fatalities: 2
Persons involved in fatal accidents: 6
Pedestrians involved in fatal accidents: 0
Home Mortgage Disclosure Act Aggregated Statistics For Year 2009 (Based on 2 partial tracts)
A) FHA, FSA/RHS & VA Home Purchase Loans
B) Conventional Home Purchase Loans
C) Refinancings
D) Home Improvement Loans
F) Non-occupant Loans on < 5 Family Dwellings (A B C & D)
Number
Average Value
Number
Average Value
Number
Average Value
Number
Average Value
Number
Average Value
LOANS ORIGINATED
5
$422,742
15
$400,544
130
$379,489
3
$268,053
1
$296,070
APPLICATIONS APPROVED, NOT ACCEPTED
0
$0
1
$241,920
9
$373,628
1
$20,740
0
$0
APPLICATIONS DENIED
1
$344,830
2
$563,180
30
$460,297
1
$33,680
1
$207,710
APPLICATIONS WITHDRAWN
1
$428,620
3
$387,307
21
$429,898
0
$0
1
$239,770
FILES CLOSED FOR INCOMPLETENESS
0
$0
2
$191,545
7
$420,803
0
$0
1
$129,310
Aggregated Statistics For Year 2008 (Based on 2 partial tracts)
A) FHA, FSA/RHS & VA Home Purchase Loans
B) Conventional Home Purchase Loans
C) Refinancings
D) Home Improvement Loans
F) Non-occupant Loans on < 5 Family Dwellings (A B C & D)
Number
Average Value
Number
Average Value
Number
Average Value
Number
Average Value
Number
Average Value
LOANS ORIGINATED
3
$420,173
16
$477,579
43
$374,955
4
$125,945
2
$315,735
APPLICATIONS APPROVED, NOT ACCEPTED
1
$373,390
2
$573,150
8
$450,235
1
$8,080
0
$0
APPLICATIONS DENIED
1
$234,110
1
$451,250
17
$530,559
4
$209,122
0
$0
APPLICATIONS WITHDRAWN
0
$0
5
$424,466
11
$406,549
0
$0
1
$266,170
FILES CLOSED FOR INCOMPLETENESS
0
$0
1
$192,620
3
$242,280
1
$59,270
1
$155,170
Aggregated Statistics For Year 2007 (Based on 2 partial tracts)
B) Conventional Home Purchase Loans
C) Refinancings
D) Home Improvement Loans
F) Non-occupant Loans on < 5 Family Dwellings (A B C & D)
Number
Average Value
Number
Average Value
Number
Average Value
Number
Average Value
LOANS ORIGINATED
36
$422,195
55
$414,803
7
$341,753
3
$286,373
APPLICATIONS APPROVED, NOT ACCEPTED
5
$510,944
12
$437,483
2
$219,155
1
$251,080
APPLICATIONS DENIED
3
$470,553
28
$588,620
2
$73,410
1
$263,200
APPLICATIONS WITHDRAWN
6
$399,385
13
$512,917
1
$510,780
1
$290,410
FILES CLOSED FOR INCOMPLETENESS
1
$226,830
4
$455,622
0
$0
0
$0
Aggregated Statistics For Year 2006 (Based on 2 partial tracts)
B) Conventional Home Purchase Loans
C) Refinancings
D) Home Improvement Loans
F) Non-occupant Loans on < 5 Family Dwellings (A B C & D)
Number
Average Value
Number
Average Value
Number
Average Value
Number
Average Value
LOANS ORIGINATED
50
$517,695
89
$467,542
9
$244,914
5
$380,178
APPLICATIONS APPROVED, NOT ACCEPTED
9
$597,410
16
$362,040
2
$81,225
1
$118,000
APPLICATIONS DENIED
11
$498,267
29
$556,385
4
$243,538
1
$211,210
APPLICATIONS WITHDRAWN
8
$501,656
26
$480,827
2
$308,600
1
$222,790
FILES CLOSED FOR INCOMPLETENESS
4
$627,230
5
$447,636
1
$189,930
0
$0
Aggregated Statistics For Year 2005 (Based on 2 partial tracts)
B) Conventional Home Purchase Loans
C) Refinancings
D) Home Improvement Loans
F) Non-occupant Loans on < 5 Family Dwellings (A B C & D)
Number
Average Value
Number
Average Value
Number
Average Value
Number
Average Value
LOANS ORIGINATED
71
$473,822
109
$414,565
9
$251,680
5
$324,680
APPLICATIONS APPROVED, NOT ACCEPTED
5
$371,180
10
$364,848
1
$688,320
0
$0
APPLICATIONS DENIED
13
$541,888
26
$420,606
4
$166,692
2
$556,580
APPLICATIONS WITHDRAWN
7
$370,233
33
$456,527
3
$454,567
1
$209,320
FILES CLOSED FOR INCOMPLETENESS
3
$457,710
7
$435,273
1
$393,050
0
$0
Aggregated Statistics For Year 2004 (Based on 2 partial tracts)
B) Conventional Home Purchase Loans
C) Refinancings
D) Home Improvement Loans
F) Non-occupant Loans on < 5 Family Dwellings (A B C & D)
Number
Average Value
Number
Average Value
Number
Average Value
Number
Average Value
LOANS ORIGINATED
67
$429,030
122
$349,200
6
$282,107
6
$271,107
APPLICATIONS APPROVED, NOT ACCEPTED
4
$297,215
14
$318,739
1
$102,640
1
$102,910
APPLICATIONS DENIED
9
$385,152
30
$447,509
4
$140,425
3
$351,117
APPLICATIONS WITHDRAWN
5
$432,980
23
$359,216
1
$269,130
1
$136,050
FILES CLOSED FOR INCOMPLETENESS
2
$222,255
5
$374,682
1
$165,680
0
$0
Aggregated Statistics For Year 2003 (Based on 2 partial tracts)
A) FHA, FSA/RHS & VA Home Purchase Loans
B) Conventional Home Purchase Loans
C) Refinancings
D) Home Improvement Loans
F) Non-occupant Loans on < 5 Family Dwellings (A B C & D)
Number
Average Value
Number
Average Value
Number
Average Value
Number
Average Value
Number
Average Value
LOANS ORIGINATED
1
$123,390
71
$361,914
320
$293,052
4
$98,532
5
$236,156
APPLICATIONS APPROVED, NOT ACCEPTED
0
$0
8
$356,652
35
$290,013
1
$97,250
0
$0
APPLICATIONS DENIED
0
$0
9
$487,584
38
$301,182
3
$128,593
1
$377,160
APPLICATIONS WITHDRAWN
0
$0
11
$437,799
43
$323,762
1
$64,930
1
$225,220
FILES CLOSED FOR INCOMPLETENESS
0
$0
2
$684,005
9
$343,096
0
$0
0
$0
Aggregated Statistics For Year 2002 (Based on 2 partial tracts)
A) FHA, FSA/RHS & VA Home Purchase Loans
B) Conventional Home Purchase Loans
C) Refinancings
D) Home Improvement Loans
F) Non-occupant Loans on < 5 Family Dwellings (A B C & D)
Number
Average Value
Number
Average Value
Number
Average Value
Number
Average Value
Number
Average Value
LOANS ORIGINATED
1
$224,410
68
$314,643
216
$280,963
4
$75,902
4
$168,915
APPLICATIONS APPROVED, NOT ACCEPTED
0
$0
4
$356,282
23
$250,202
2
$48,355
0
$0
APPLICATIONS DENIED
0
$0
5
$274,464
29
$344,665
3
$29,363
2
$151,540
APPLICATIONS WITHDRAWN
0
$0
6
$319,913
29
$306,493
2
$36,640
1
$202,050
FILES CLOSED FOR INCOMPLETENESS
0
$0
1
$176,460
5
$268,538
0
$0
0
$0
Aggregated Statistics For Year 2001 (Based on 2 partial tracts)
A) FHA, FSA/RHS & VA Home Purchase Loans
B) Conventional Home Purchase Loans
C) Refinancings
D) Home Improvement Loans
F) Non-occupant Loans on < 5 Family Dwellings (A B C & D)
Number
Average Value
Number
Average Value
Number
Average Value
Number
Average Value
Number
Average Value
LOANS ORIGINATED
2
$230,335
53
$241,952
131
$261,731
4
$39,265
3
$232,583
APPLICATIONS APPROVED, NOT ACCEPTED
0
$0
3
$226,923
12
$194,642
4
$47,078
0
$0
APPLICATIONS DENIED
0
$0
2
$326,650
21
$234,365
4
$52,198
0
$0
APPLICATIONS WITHDRAWN
0
$0
4
$341,128
22
$237,060
2
$58,865
0
$0
FILES CLOSED FOR INCOMPLETENESS
0
$0
1
$462,560
3
$290,233
1
$40,950
0
$0
Aggregated Statistics For Year 2000 (Based on 2 partial tracts)
A) FHA, FSA/RHS & VA Home Purchase Loans
B) Conventional Home Purchase Loans
C) Refinancings
D) Home Improvement Loans
F) Non-occupant Loans on < 5 Family Dwellings (A B C & D)
Number
Average Value
Number
Average Value
Number
Average Value
Number
Average Value
Number
Average Value
LOANS ORIGINATED
2
$167,835
58
$253,691
23
$204,018
4
$29,432
2
$162,585
APPLICATIONS APPROVED, NOT ACCEPTED
0
$0
7
$215,597
7
$160,716
2
$27,885
0
$0
APPLICATIONS DENIED
0
$0
4
$248,252
15
$143,536
3
$15,447
1
$144,940
APPLICATIONS WITHDRAWN
0
$0
5
$254,960
7
$158,561
1
$24,780
0
$0
FILES CLOSED FOR INCOMPLETENESS
0
$0
3
$280,087
2
$198,145
0
$0
0
$0
Aggregated Statistics For Year 1999 (Based on 1 partial tract)
A) FHA, FSA/RHS & VA Home Purchase Loans
B) Conventional Home Purchase Loans
C) Refinancings
D) Home Improvement Loans
F) Non-occupant Loans on < 5 Family Dwellings (A B C & D)


 Nearest zip codes: 20861, 20862, 20832, 20905, 20868, 20906.


