Averages for the 2020 tax year for zip code 19436, filed in 2021:
Average Adjusted Gross Income (AGI) in 2020: $141,997 (Individual Income Tax Returns)
Here:
$141,997
State:
$75,707
Salary/wage: $50,280 (reported on 15.2% of returns)
Here:
$50,280
State:
$62,806
(% of AGI for various income ranges: 1792.5% for AGIs $50k-75k)
Taxable interest for individuals: $2,722 (reported on 81.8% of returns)
This zip code:
$2,722
Pennsylvania:
$1,633
(% of AGI for various income ranges: 132.5% for AGIs $50k-75k, 722.0% for AGIs $100k-200k)
Ordinary dividends: $29,132 (reported on 84.8% of returns)
Here:
$29,132
State:
$7,382
(% of AGI for various income ranges: 770.0% for AGIs $50k-75k, 5026.0% for AGIs $100k-200k)
Net capital gain/loss in AGI: +$24,504 (reported on 81.8% of returns)
Here:
+$24,504
State:
+$23,522
(% of AGI for various income ranges: 165.0% for AGIs below $25k, 400.0% for AGIs $50k-75k, 3614.0% for AGIs $100k-200k)
Profit/loss from business: +$56,350 (reported on 6.1% of returns)
Here:
+$56,350
State:
+$16,274
(% of AGI for various income ranges: 2254.0% for AGIs $100k-200k)
Taxable individual retirement arrangement distribution: $34,172 (reported on 54.5% of returns)
19436:
$34,172
Pennsylvania:
$18,583
(% of AGI for various income ranges: 1320.0% for AGIs $50k-75k, 5038.0% for AGIs $100k-200k)
Total itemized deductions: $54,500 (reported on 78.8% of returns)
Here:
$54,500
State:
$34,850
(% of AGI for various income ranges: 4830.0% for AGIs $50k-75k, 10200.0% for AGIs $100k-200k)
Charity contributions: $9,879 (reported on 72.7% of returns)
Here:
$9,879
State:
$12,392
(% of AGI for various income ranges: 280.0% for AGIs below $25k, 315.0% for AGIs $50k-75k, 1538.0% for AGIs $100k-200k)
Taxes paid: $3,532 (reported on 75.8% of returns)
19436:
$3,532
State:
$8,200
(% of AGI for various income ranges: 130.0% for AGIs below $25k, 190.0% for AGIs $50k-75k, 708.0% for AGIs $100k-200k)
Percentage of individuals using paid preparers for their 2020 taxes: 90.9%
Here:
91%
State:
92%
(% for various income ranges: 100.0% for AGIs below $25k, 66.7% for AGIs $25k-50k, 100.0% for AGIs $50k-75k, 80.0% for AGIs $75k-100k, 90.9% for AGIs $100k-200k, 100.0% for AGIs over 200k)
Averages for the 2012 tax year for zip code 19436, filed in 2013:
Average Adjusted Gross Income (AGI) in 2012: $264,127 (Individual Income Tax Returns)
Here:
$264,127
State:
$61,346
Salary/wage: $112,600 (reported on 21.6% of returns)
Here:
$112,600
State:
$51,902
(% of AGI for various income ranges: 50.2% for AGIs below $25k, 36.4% for AGIs $75k-100k, 9.5% for AGIs over 200k)
Taxable interest for individuals: $5,303 (reported on 78.4% of returns)
This zip code:
$5,303
Pennsylvania:
$1,588
(% of AGI for various income ranges: 6.6% for AGIs below $25k, 7.8% for AGIs $25k-50k, 4.3% for AGIs $50k-75k, 1.9% for AGIs $75k-100k, 3.4% for AGIs $100k-200k, 0.9% for AGIs over 200k)
Ordinary dividends: $33,657 (reported on 75.7% of returns)
Here:
$33,657
State:
$5,827
(% of AGI for various income ranges: 23.4% for AGIs below $25k, 17.1% for AGIs $25k-50k, 22.9% for AGIs $50k-75k, 9.5% for AGIs $75k-100k, 19.5% for AGIs $100k-200k, 7.2% for AGIs over 200k)
Net capital gain/loss in AGI: +$29,314 (reported on 78.4% of returns)
Here:
+$29,314
State:
+$14,495
(% of AGI for various income ranges: 2.7% for AGIs $50k-75k, 4.0% for AGIs $75k-100k, 6.5% for AGIs $100k-200k, 10.0% for AGIs over 200k)
Profit/loss from business: +$9,967 (reported on 8.1% of returns)
Here:
+$9,967
State:
+$16,268
Taxable individual retirement arrangement distribution: $28,036 (reported on 59.5% of returns)
19436:
$28,036
Pennsylvania:
$14,550
(% of AGI for various income ranges: 17.5% for AGIs $25k-50k, 11.0% for AGIs $50k-75k, 16.8% for AGIs $75k-100k, 21.2% for AGIs $100k-200k, 3.2% for AGIs over 200k)
Total itemized deductions: $56,228 (19% of AGI, reported on 86.5% of returns)
Here:
$56,228
State:
$23,538
Here:
18.8% of AGI
State:
18.4% of AGI
(% of AGI for various income ranges: 120.8% for AGIs below $25k, 65.9% for AGIs $25k-50k, 46.0% for AGIs $50k-75k, 35.6% for AGIs $75k-100k, 41.4% for AGIs $100k-200k, 10.5% for AGIs over 200k)
Charity contributions: $10,977 (reported on 81.1% of returns)
Here:
$10,977
State:
$4,025
(% of AGI for various income ranges: 5.3% for AGIs below $25k, 5.3% for AGIs $25k-50k, 6.0% for AGIs $50k-75k, 2.9% for AGIs $75k-100k, 5.9% for AGIs $100k-200k, 2.8% for AGIs over 200k)
Taxes paid: $10,647 (reported on 81.1% of returns)
19436:
$10,647
State:
$9,982
(% of AGI for various income ranges: 4.2% for AGIs below $25k, 1.6% for AGIs $25k-50k, 3.0% for AGIs $50k-75k, 3.2% for AGIs $75k-100k, 4.2% for AGIs $100k-200k, 3.2% for AGIs over 200k)
Percentage of individuals using paid preparers for their 2012 taxes: 73.0%
Here:
73%
State:
53%
(% for various income ranges: 50.0% for AGIs below $25k, 60.0% for AGIs $25k-50k, 85.7% for AGIs $50k-75k, 80.0% for AGIs $75k-100k, 75.0% for AGIs $100k-200k, 83.3% for AGIs over 200k)
Averages for the 2004 tax year for zip code 19436, filed in 2005:
Average Adjusted Gross Income (AGI) in 2004: $170,591 (Individual Income Tax Returns)
Here:
$170,591
State:
$48,049
Salary/wage: $81,349 (reported on 33.3% of returns)
Here:
$81,349
State:
$42,646
(% of AGI for various income ranges: 58.6% for AGIs below $10k, 20.6% for AGIs $10k-25k, 24.3% for AGIs $25k-50k, 11.3% for AGIs $50k-75k, 8.0% for AGIs $75k-100k, 16.1% for AGIs over 100k)
Taxable interest for individuals: $8,680 (reported on 87.5% of returns)
This zip code:
$8,680
Pennsylvania:
$1,657
(% of AGI for various income ranges: 15.7% for AGIs below $10k, 15.7% for AGIs $10k-25k, 9.6% for AGIs $25k-50k, 7.6% for AGIs $50k-75k, 5.6% for AGIs $75k-100k, 3.7% for AGIs over 100k)
Taxable dividends: $21,168 (reported on 79.6% of returns)
Here:
$21,168
State:
$3,566
(% of AGI for various income ranges: 21.7% for AGIs below $10k, 17.6% for AGIs $10k-25k, 14.4% for AGIs $25k-50k, 16.0% for AGIs $50k-75k, 13.8% for AGIs $75k-100k, 8.8% for AGIs over 100k)
Net capital gain/loss: +$21,978 (reported on 69.4% of returns)
Here:
+$21,978
State:
+$9,716
(% of AGI for various income ranges: -17.7% for AGIs below $10k, -0.7% for AGIs $10k-25k, 8.6% for AGIs $25k-50k, 7.5% for AGIs $50k-75k, 11.9% for AGIs $75k-100k, 9.1% for AGIs over 100k)
Profit/loss from business: +$42,690 (reported on 9.2% of returns)
Here:
+$42,690
State:
+$14,267
Self-employed pension: $26,167 (reported on 2.6% of returns)
Here:
$26,167
Pennsylvania:
$14,674
Total itemized deductions: $39,565 (20% of AGI, reported on 82.1% of returns)
Here:
$39,565
State:
$18,804
Here:
19.7% of AGI
State:
19.5% of AGI
(% of AGI for various income ranges: 132.3% for AGIs below $10k, 66.5% for AGIs $10k-25k, 44.1% for AGIs $25k-50k, 46.1% for AGIs $50k-75k, 38.5% for AGIs $75k-100k, 13.5% for AGIs over 100k)
Charity contributions deductions: $10,025 (5% of AGI, reported on 77.2% of returns)
Here:
$10,025
State:
$3,337
Here:
4.7% of AGI
State:
3.3% of AGI
(% of AGI for various income ranges: 5.6% for AGIs $10k-25k, 6.1% for AGIs $25k-50k, 6.6% for AGIs $50k-75k, 5.8% for AGIs $75k-100k, 4.2% for AGIs over 100k)
Total tax: $27,019 (reported on 79.0% of returns)
19436:
$27,019
State:
$8,008
(% of AGI for various income ranges: 1.0% for AGIs below $10k, 2.2% for AGIs $10k-25k, 6.0% for AGIs $25k-50k, 7.9% for AGIs $50k-75k, 9.0% for AGIs $75k-100k, 13.6% for AGIs over 100k)
Percentage of individuals using paid preparers for their 2004 taxes: 73.1%
Here:
73%
State:
56%
(% for various income ranges: 57.1% for AGIs below $10k, 58.3% for AGIs $10k-25k, 71.6% for AGIs $25k-50k, 81.2% for AGIs $50k-75k, 82.1% for AGIs $75k-100k, 80.0% for AGIs over 100k)
In group quarters: 62 (-1 institutionalized population)
Size of family households: 103 2-persons
Size of nonfamily households: 225 1-person
102.5% of residents of 19436 zip code speak English at home.
0.6% of residents speak other Indo-European language at home (100% very well).
Foreign born population: 94 (19.4%) (100.0% of them are naturalized citizens)
This zip code:
19.4%
Whole state:
7.5%
77%Iraq
12%Sweden
21%Irish
16%Israeli
10%American
9%English
9%Scotch-Irish
4%Italian
3%Norwegian
Year of entry for the foreign-born population
02010 or later
02000 to 2009
111990 to 1999
69Before 1990
Private school in in zip code 19436 not listed on the city page:
GWYNEDD FRIENDS PRESCHOOL & KINDERGARTEN (Students: 13, Location: RR 202 & SUMNEYTOWN PIKE, Grades: KG)
Housing units lacking complete kitchen facilities: 7.4%
40.0%Electricity
37.4%Utility gas
11.3%Other fuel
4.7%Solar energy
3.8%Bottled, tank, or LP gas
3.5%No fuel used
Population in 1990: 540.
Place of birth for U.S.-born residents:
This state: 166
Northeast: 133
Midwest: 43
South: 31
West: 26
58% of the 19436 zip code residents lived in the same house 5 years ago. Out of people who lived in different houses, 45% lived in this county. Out of people who lived in different counties, 50% lived in Pennsylvania.
97% of the 19436 zip code residents lived in the same house 1 year ago. Out of people who lived in different houses, 41% moved from this county. Out of people who lived in different houses, 59% moved from different county within same state.
Top industries in this zip code by the number of employees in 2005:
Accommodation and Food Services: Full-Service Restaurants (250-499 employees: 1 establishment)
Health Care and Social Assistance: Continuing Care Retirement Communities (250-499: 1)
Administrative and Support and Waste Management and Remediation Services: Landscaping Services (20-49: 1)
Other Services (except Public Administration): Religious Organizations (10-19: 1, 5-9: 1, 1-4: 3)
Wholesale Trade: Other Grocery and Related Products Merchant Wholesalers (5-9: 1)
Finance and Insurance: Commercial Banking (1-4: 1)
Accommodation and Food Services: Food Service Contractors (1-4: 1)
Wholesale Trade: Jewelry, Watch, Precious Stone, and Precious Metal Merchant Wholesalers (1-4: 1)
People in group quarters in 2010:
41 people in nursing facilities/skilled-nursing facilities
People in group quarters in 2000:
56 people in nursing homes
Home Mortgage Disclosure Act Aggregated Statistics For Year 2009 (Based on 2 partial tracts)
B) Conventional Home Purchase Loans
C) Refinancings
D) Home Improvement Loans
Number
Average Value
Number
Average Value
Number
Average Value
LOANS ORIGINATED
7
$503,517
31
$339,108
1
$155,760
APPLICATIONS APPROVED, NOT ACCEPTED
1
$306,020
2
$256,210
0
$0
APPLICATIONS DENIED
0
$0
6
$429,312
1
$306,440
APPLICATIONS WITHDRAWN
2
$527,075
6
$333,337
0
$0
FILES CLOSED FOR INCOMPLETENESS
0
$0
1
$263,500
0
$0
Aggregated Statistics For Year 2008 (Based on 2 partial tracts)
B) Conventional Home Purchase Loans
C) Refinancings
D) Home Improvement Loans
F) Non-occupant Loans on < 5 Family Dwellings (A B C & D)
Number
Average Value
Number
Average Value
Number
Average Value
Number
Average Value
LOANS ORIGINATED
7
$454,080
11
$363,602
2
$76,095
1
$284,280
APPLICATIONS APPROVED, NOT ACCEPTED
1
$673,000
2
$336,295
0
$0
0
$0
APPLICATIONS DENIED
1
$243,550
5
$503,918
0
$0
0
$0
APPLICATIONS WITHDRAWN
0
$0
2
$359,620
0
$0
0
$0
FILES CLOSED FOR INCOMPLETENESS
0
$0
0
$0
0
$0
0
$0
Aggregated Statistics For Year 2007 (Based on 2 partial tracts)
B) Conventional Home Purchase Loans
C) Refinancings
D) Home Improvement Loans
F) Non-occupant Loans on < 5 Family Dwellings (A B C & D)
Number
Average Value
Number
Average Value
Number
Average Value
Number
Average Value
LOANS ORIGINATED
13
$438,626
10
$424,620
2
$169,590
1
$470,450
APPLICATIONS APPROVED, NOT ACCEPTED
1
$699,700
3
$271,257
1
$50,640
0
$0
APPLICATIONS DENIED
1
$253,320
4
$634,472
1
$83,940
0
$0
APPLICATIONS WITHDRAWN
1
$431,510
2
$518,750
0
$0
0
$0
FILES CLOSED FOR INCOMPLETENESS
0
$0
1
$382,120
0
$0
0
$0
Aggregated Statistics For Year 2006 (Based on 2 partial tracts)
B) Conventional Home Purchase Loans
C) Refinancings
D) Home Improvement Loans
F) Non-occupant Loans on < 5 Family Dwellings (A B C & D)
Number
Average Value
Number
Average Value
Number
Average Value
Number
Average Value
LOANS ORIGINATED
9
$456,113
9
$359,411
3
$140,627
0
$0
APPLICATIONS APPROVED, NOT ACCEPTED
2
$536,435
2
$274,510
0
$0
0
$0
APPLICATIONS DENIED
1
$619,340
6
$415,667
1
$171,310
1
$161,400
APPLICATIONS WITHDRAWN
1
$417,340
5
$320,718
0
$0
0
$0
FILES CLOSED FOR INCOMPLETENESS
0
$0
1
$413,900
0
$0
0
$0
Aggregated Statistics For Year 2005 (Based on 2 partial tracts)
B) Conventional Home Purchase Loans
C) Refinancings
D) Home Improvement Loans
F) Non-occupant Loans on < 5 Family Dwellings (A B C & D)
Number
Average Value
Number
Average Value
Number
Average Value
Number
Average Value
LOANS ORIGINATED
10
$404,847
14
$354,438
4
$78,225
0
$0
APPLICATIONS APPROVED, NOT ACCEPTED
1
$681,670
3
$249,743
1
$47,060
0
$0
APPLICATIONS DENIED
1
$507,880
4
$461,235
1
$109,940
1
$131,410
APPLICATIONS WITHDRAWN
2
$214,930
4
$326,698
1
$100,450
0
$0
FILES CLOSED FOR INCOMPLETENESS
0
$0
1
$296,390
0
$0
0
$0
Aggregated Statistics For Year 2004 (Based on 2 partial tracts)
B) Conventional Home Purchase Loans
C) Refinancings
D) Home Improvement Loans
F) Non-occupant Loans on < 5 Family Dwellings (A B C & D)
Number
Average Value
Number
Average Value
Number
Average Value
Number
Average Value
LOANS ORIGINATED
10
$489,815
19
$287,635
3
$172,687
1
$178,330
APPLICATIONS APPROVED, NOT ACCEPTED
1
$478,300
2
$294,120
1
$71,550
0
$0
APPLICATIONS DENIED
1
$259,650
4
$322,500
0
$0
0
$0
APPLICATIONS WITHDRAWN
1
$430,960
3
$382,343
0
$0
0
$0
FILES CLOSED FOR INCOMPLETENESS
0
$0
2
$294,810
0
$0
0
$0
Aggregated Statistics For Year 2003 (Based on 2 partial tracts)
B) Conventional Home Purchase Loans
C) Refinancings
D) Home Improvement Loans
F) Non-occupant Loans on < 5 Family Dwellings (A B C & D)
Number
Average Value
Number
Average Value
Number
Average Value
Number
Average Value
LOANS ORIGINATED
14
$297,540
55
$274,427
4
$156,760
1
$162,920
APPLICATIONS APPROVED, NOT ACCEPTED
2
$339,735
5
$231,224
1
$67,420
0
$0
APPLICATIONS DENIED
1
$268,180
10
$366,209
0
$0
0
$0
APPLICATIONS WITHDRAWN
2
$393,740
6
$477,702
0
$0
0
$0
FILES CLOSED FOR INCOMPLETENESS
1
$243,830
2
$345,375
0
$0
0
$0
Aggregated Statistics For Year 2002 (Based on 2 partial tracts)
B) Conventional Home Purchase Loans
C) Refinancings
D) Home Improvement Loans
F) Non-occupant Loans on < 5 Family Dwellings (A B C & D)
Number
Average Value
Number
Average Value
Number
Average Value
Number
Average Value
LOANS ORIGINATED
9
$2,039,018
43
$364,950
3
$70,313
1
$130,440
APPLICATIONS APPROVED, NOT ACCEPTED
1
$483,940
5
$228,140
1
$68,250
0
$0
APPLICATIONS DENIED
0
$0
6
$303,247
1
$65,220
0
$0
APPLICATIONS WITHDRAWN
1
$455,730
3
$314,280
0
$0
0
$0
FILES CLOSED FOR INCOMPLETENESS
0
$0
2
$382,045
0
$0
0
$0
Aggregated Statistics For Year 2001 (Based on 2 partial tracts)
B) Conventional Home Purchase Loans
C) Refinancings
D) Home Improvement Loans
F) Non-occupant Loans on < 5 Family Dwellings (A B C & D)
Number
Average Value
Number
Average Value
Number
Average Value
Number
Average Value
LOANS ORIGINATED
9
$294,388
23
$271,311
3
$73,480
1
$220,300
APPLICATIONS APPROVED, NOT ACCEPTED
1
$351,020
2
$301,000
1
$100,450
0
$0
APPLICATIONS DENIED
1
$189,750
3
$205,573
1
$80,220
0
$0
APPLICATIONS WITHDRAWN
1
$118,890
3
$235,937
0
$0
0
$0
FILES CLOSED FOR INCOMPLETENESS
0
$0
1
$194,290
0
$0
0
$0
Aggregated Statistics For Year 2000 (Based on 2 partial tracts)
B) Conventional Home Purchase Loans
C) Refinancings
D) Home Improvement Loans
Number
Average Value
Number
Average Value
Number
Average Value
LOANS ORIGINATED
15
$349,981
4
$210,425
3
$58,113
APPLICATIONS APPROVED, NOT ACCEPTED
2
$190,440
1
$165,400
1
$30,820
APPLICATIONS DENIED
1
$480,090
1
$153,560
0
$0
APPLICATIONS WITHDRAWN
1
$175,440
3
$160,533
0
$0
FILES CLOSED FOR INCOMPLETENESS
0
$0
0
$0
0
$0
Aggregated Statistics For Year 1999 (Based on 1 partial tract)

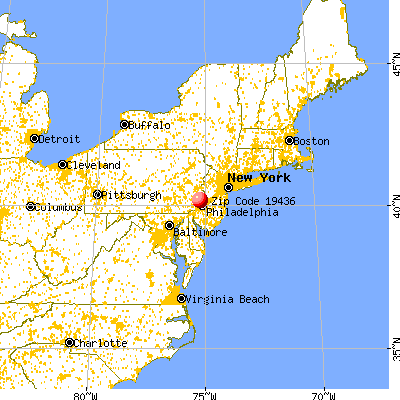


 Nearest zip codes: 19454, 19437, 19477, 18936, 19002, 19422.


 (Students: 13, Location: RR 202 & SUMNEYTOWN PIKE, Grades: KG)


