Estimated zip code population in 2022: 20,023 Zip code population in 2010: 18,506 Zip code population in 2000: 18,246
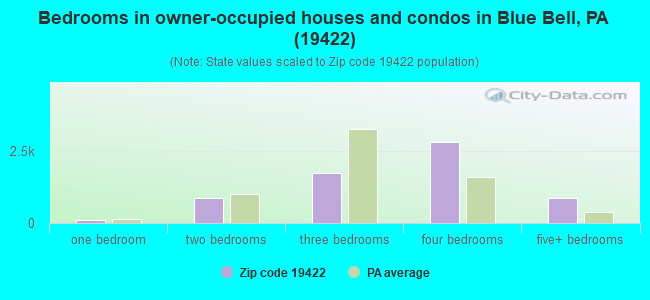
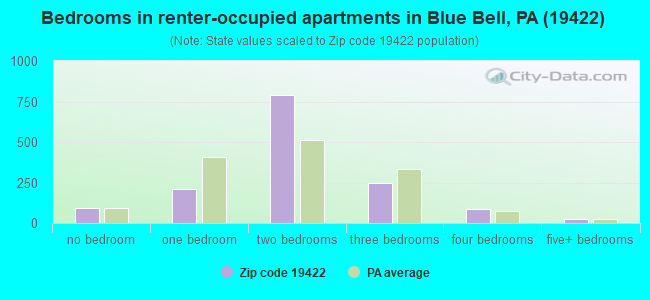
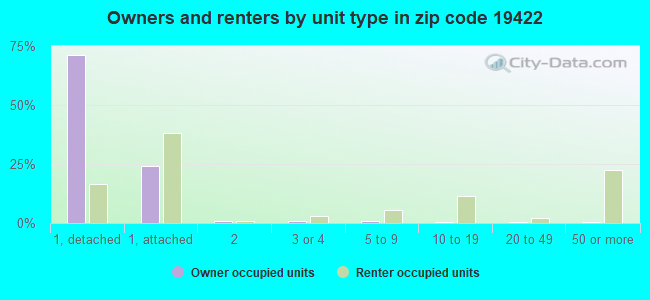
Houses and condos: 8,092 Renter-occupied apartments: 1,447
% of renters here:
18%
State:
31%
March 2022 cost of living index in zip code 19422: 107.2 (more than average, U.S. average is 100)
Land area: 12.7 sq. mi. Water area: 0.0 sq. mi.
Population density: 1,578 people per square mile
(low).
OSM Map
General Map
Google Map
MSN Map
OSM Map
General Map
Google Map
MSN Map
OSM Map
General Map
Google Map
MSN Map
OSM Map
General Map
Google Map
MSN Map
Please wait while loading the map...
Real estate property taxes paid for housing units in 2022:
This zip code:
1.0% ($5,452)
Pennsylvania:
1.3% ($3,094)
Median real estate property taxes paid for housing units with mortgages in 2022: $5,697 (1.0%) Median real estate property taxes paid for housing units with no mortgage in 2022: $4,852 (0.9%)
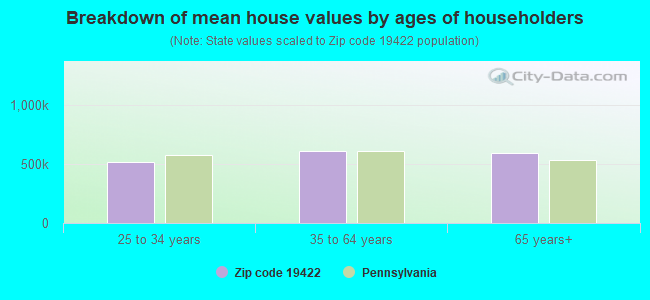
Estimated median house/condo value in 2022: $566,864
19422:
$566,864
Pennsylvania:
$245,500
According to our research of Pennsylvania and other state lists, there were 10 registered sex offenders living in 19422 zip code as of July 18, 2024. The ratio of all residents to sex offenders in zip code 19422 is 1,908 to 1. The ratio of registered sex offenders to all residents in this zip code is much lower than the state average.
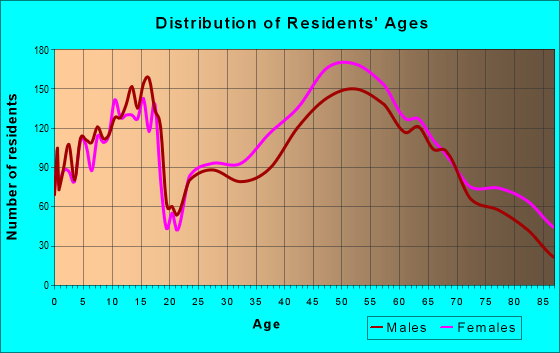
Median resident age:
This zip code:
44.0 years
Pennsylvania median age:
40.9 years
Average household size:
This zip code:
2.5 people
Pennsylvania:
2.4 people
Averages for the 2020 tax year for zip code 19422, filed in 2021:
Average Adjusted Gross Income (AGI) in 2020: $174,239 (Individual Income Tax Returns)
Here:
$174,239
State:
$75,707
Salary/wage: $136,518 (reported on 75.5% of returns)
Here:
$136,518
State:
$62,806
(% of AGI for various income ranges: 1104.9% for AGIs below $25k, 3493.0% for AGIs $25k-50k, 6358.2% for AGIs $50k-75k, 9305.1% for AGIs $75k-100k, 18605.0% for AGIs $100k-200k, 120995.6% for AGIs over 200k)
Taxable interest for individuals: $3,033 (reported on 53.4% of returns)
This zip code:
$3,033
Pennsylvania:
$1,633
(% of AGI for various income ranges: 39.1% for AGIs below $25k, 57.5% for AGIs $25k-50k, 126.6% for AGIs $50k-75k, 200.8% for AGIs $75k-100k, 232.7% for AGIs $100k-200k, 1878.8% for AGIs over 200k)
Ordinary dividends: $13,204 (reported on 48.3% of returns)
Here:
$13,204
State:
$7,382
(% of AGI for various income ranges: 131.2% for AGIs below $25k, 206.7% for AGIs $25k-50k, 398.7% for AGIs $50k-75k, 571.2% for AGIs $75k-100k, 1021.9% for AGIs $100k-200k, 7625.9% for AGIs over 200k)
Net capital gain/loss in AGI: +$49,718 (reported on 43.9% of returns)
Here:
+$49,718
State:
+$23,522
(% of AGI for various income ranges: 48.6% for AGIs below $25k, 141.8% for AGIs $25k-50k, 270.0% for AGIs $50k-75k, 542.9% for AGIs $75k-100k, 1163.5% for AGIs $100k-200k, 35069.3% for AGIs over 200k)
Profit/loss from business: +$41,844 (reported on 17.3% of returns)
Here:
+$41,844
State:
+$16,274
(% of AGI for various income ranges: 122.7% for AGIs below $25k, 314.3% for AGIs $25k-50k, 299.0% for AGIs $50k-75k, 493.4% for AGIs $75k-100k, 1032.4% for AGIs $100k-200k, 9171.5% for AGIs over 200k)
Taxable individual retirement arrangement distribution: $31,966 (reported on 17.0% of returns)
19422:
$31,966
Pennsylvania:
$18,583
(% of AGI for various income ranges: 108.5% for AGIs below $25k, 283.8% for AGIs $25k-50k, 473.8% for AGIs $50k-75k, 916.4% for AGIs $75k-100k, 1603.5% for AGIs $100k-200k, 4326.1% for AGIs over 200k)
Self-employed (Keogh) retirement plans: $31,782 (reported on 2.7% of returns)
19422:
$31,782
Pennsylvania:
$25,407
(% of AGI for various income ranges: 28.8% for AGIs $50k-75k, 75.0% for AGIs $100k-200k, 1326.9% for AGIs over 200k)
Total itemized deductions: $39,203 (reported on 23.1% of returns)
Here:
$39,203
State:
$34,850
(% of AGI for various income ranges: 228.2% for AGIs below $25k, 505.3% for AGIs $25k-50k, 701.0% for AGIs $50k-75k, 1207.3% for AGIs $75k-100k, 1866.9% for AGIs $100k-200k, 9008.6% for AGIs over 200k)
Charity contributions: $12,245 (reported on 19.9% of returns)
Here:
$12,245
State:
$12,392
(% of AGI for various income ranges: 10.1% for AGIs below $25k, 37.3% for AGIs $25k-50k, 63.6% for AGIs $50k-75k, 145.9% for AGIs $75k-100k, 319.7% for AGIs $100k-200k, 3376.6% for AGIs over 200k)
Taxes paid: $8,232 (reported on 22.9% of returns)
19422:
$8,232
State:
$8,200
(% of AGI for various income ranges: 27.9% for AGIs below $25k, 73.6% for AGIs $25k-50k, 118.8% for AGIs $50k-75k, 278.6% for AGIs $75k-100k, 480.4% for AGIs $100k-200k, 1796.8% for AGIs over 200k)
Earned income credit: $1,649 (reported on 4.3% of returns)
Here:
$1,649
State:
$2,100
(% of AGI for various income ranges: 36.8% for AGIs below $25k, 33.8% for AGIs $25k-50k)
Percentage of individuals using paid preparers for their 2020 taxes: 90.5%
Here:
90%
State:
92%
(% for various income ranges: 86.8% for AGIs below $25k, 90.7% for AGIs $25k-50k, 91.1% for AGIs $50k-75k, 90.4% for AGIs $75k-100k, 91.2% for AGIs $100k-200k, 93.0% for AGIs over 200k)
Averages for the 2012 tax year for zip code 19422, filed in 2013:
Average Adjusted Gross Income (AGI) in 2012: $133,122 (Individual Income Tax Returns)
Here:
$133,122
State:
$61,346
Salary/wage: $106,213 (reported on 77.3% of returns)
Here:
$106,213
State:
$51,902
(% of AGI for various income ranges: 62.7% for AGIs below $25k, 68.5% for AGIs $25k-50k, 64.5% for AGIs $50k-75k, 64.5% for AGIs $75k-100k, 70.9% for AGIs $100k-200k, 57.1% for AGIs over 200k)
Taxable interest for individuals: $3,706 (reported on 55.3% of returns)
This zip code:
$3,706
Pennsylvania:
$1,588
(% of AGI for various income ranges: 3.7% for AGIs below $25k, 1.4% for AGIs $25k-50k, 1.5% for AGIs $50k-75k, 1.2% for AGIs $75k-100k, 1.2% for AGIs $100k-200k, 1.7% for AGIs over 200k)
Ordinary dividends: $11,137 (reported on 47.3% of returns)
Here:
$11,137
State:
$5,827
(% of AGI for various income ranges: 7.3% for AGIs below $25k, 3.2% for AGIs $25k-50k, 4.7% for AGIs $50k-75k, 3.6% for AGIs $75k-100k, 3.5% for AGIs $100k-200k, 4.0% for AGIs over 200k)
Net capital gain/loss in AGI: +$24,759 (reported on 40.9% of returns)
Here:
+$24,759
State:
+$14,495
(% of AGI for various income ranges: 1.4% for AGIs $25k-50k, 1.1% for AGIs $50k-75k, 1.2% for AGIs $75k-100k, 1.7% for AGIs $100k-200k, 11.8% for AGIs over 200k)
Profit/loss from business: +$37,020 (reported on 17.3% of returns)
Here:
+$37,020
State:
+$16,268
(% of AGI for various income ranges: 8.9% for AGIs below $25k, 6.5% for AGIs $25k-50k, 4.7% for AGIs $50k-75k, 4.8% for AGIs $75k-100k, 4.6% for AGIs $100k-200k, 4.6% for AGIs over 200k)
Taxable individual retirement arrangement distribution: $27,033 (reported on 18.9% of returns)
19422:
$27,033
Pennsylvania:
$14,550
(% of AGI for various income ranges: 6.7% for AGIs below $25k, 5.3% for AGIs $25k-50k, 4.7% for AGIs $50k-75k, 5.2% for AGIs $75k-100k, 4.9% for AGIs $100k-200k, 3.0% for AGIs over 200k)
Self-employment retirement plans: $26,517 (reported on 3.0% of returns)
19422:
$26,517
Pennsylvania:
$20,922
(% of AGI for various income ranges: 0.6% for AGIs $50k-75k, 0.4% for AGIs $100k-200k, 0.8% for AGIs over 200k)
Total itemized deductions: $34,012 (16% of AGI, reported on 56.0% of returns)
Here:
$34,012
State:
$23,538
Here:
16.3% of AGI
State:
18.4% of AGI
(% of AGI for various income ranges: 29.7% for AGIs below $25k, 18.0% for AGIs $25k-50k, 17.6% for AGIs $50k-75k, 17.0% for AGIs $75k-100k, 16.7% for AGIs $100k-200k, 12.0% for AGIs over 200k)
Charity contributions: $5,164 (reported on 49.2% of returns)
Here:
$5,164
State:
$4,025
(% of AGI for various income ranges: 1.6% for AGIs below $25k, 1.4% for AGIs $25k-50k, 1.8% for AGIs $50k-75k, 1.7% for AGIs $75k-100k, 1.9% for AGIs $100k-200k, 2.0% for AGIs over 200k)
Taxes paid: $15,177 (reported on 55.7% of returns)
19422:
$15,177
State:
$9,982
(% of AGI for various income ranges: 5.2% for AGIs below $25k, 4.6% for AGIs $25k-50k, 5.2% for AGIs $50k-75k, 6.1% for AGIs $75k-100k, 7.0% for AGIs $100k-200k, 6.4% for AGIs over 200k)
Earned income credit: $1,623 (reported on 4.7% of returns)
Here:
$1,623
State:
$2,106
(% of AGI for various income ranges: 2.0% for AGIs below $25k, 0.5% for AGIs $25k-50k)
Percentage of individuals using paid preparers for their 2012 taxes: 57.8%
Here:
58%
State:
53%
(% for various income ranges: 51.6% for AGIs below $25k, 51.3% for AGIs $25k-50k, 56.3% for AGIs $50k-75k, 55.8% for AGIs $75k-100k, 59.8% for AGIs $100k-200k, 73.3% for AGIs over 200k)
Averages for the 2004 tax year for zip code 19422, filed in 2005:
Average Adjusted Gross Income (AGI) in 2004: $109,604 (Individual Income Tax Returns)
Here:
$109,604
State:
$48,049
Salary/wage: $91,197 (reported on 75.6% of returns)
Here:
$91,197
State:
$42,646
(% of AGI for various income ranges: 56.6% for AGIs $10k-25k, 65.6% for AGIs $25k-50k, 67.1% for AGIs $50k-75k, 68.5% for AGIs $75k-100k, 61.2% for AGIs over 100k)
Taxable interest for individuals: $3,746 (reported on 68.5% of returns)
This zip code:
$3,746
Pennsylvania:
$1,657
(% of AGI for various income ranges: 6.1% for AGIs $10k-25k, 3.7% for AGIs $25k-50k, 2.9% for AGIs $50k-75k, 2.4% for AGIs $75k-100k, 1.9% for AGIs over 100k)
Taxable dividends: $7,612 (reported on 55.2% of returns)
Here:
$7,612
State:
$3,566
(% of AGI for various income ranges: 7.0% for AGIs $10k-25k, 4.8% for AGIs $25k-50k, 3.4% for AGIs $50k-75k, 3.7% for AGIs $75k-100k, 3.6% for AGIs over 100k)
Net capital gain/loss: +$20,759 (reported on 46.5% of returns)
Here:
+$20,759
State:
+$9,716
(% of AGI for various income ranges: 0.2% for AGIs $10k-25k, 1.1% for AGIs $25k-50k, 1.7% for AGIs $50k-75k, 1.4% for AGIs $75k-100k, 10.8% for AGIs over 100k)
Profit/loss from business: +$32,292 (reported on 17.7% of returns)
Here:
+$32,292
State:
+$14,267
(% of AGI for various income ranges: 7.2% for AGIs $10k-25k, 6.7% for AGIs $25k-50k, 5.8% for AGIs $50k-75k, 5.6% for AGIs $75k-100k, 5.0% for AGIs over 100k)
IRA payment deduction: $3,560 (reported on 4.1% of returns)
19422:
$3,560
Pennsylvania:
$2,903
(% of AGI for various income ranges: 0.4% for AGIs $10k-25k, 0.4% for AGIs $25k-50k, 0.3% for AGIs $50k-75k, 0.3% for AGIs $75k-100k, 0.1% for AGIs over 100k)
Self-employed pension: $18,325 (reported on 3.5% of returns)
Here:
$18,325
Pennsylvania:
$14,674
(% of AGI for various income ranges: 0.2% for AGIs $25k-50k, 0.3% for AGIs $50k-75k, 0.5% for AGIs $75k-100k, 0.7% for AGIs over 100k)
Total itemized deductions: $28,597 (16% of AGI, reported on 55.5% of returns)
Here:
$28,597
State:
$18,804
Here:
16.2% of AGI
State:
19.5% of AGI
(% of AGI for various income ranges: 25.3% for AGIs $10k-25k, 19.7% for AGIs $25k-50k, 18.7% for AGIs $50k-75k, 20.6% for AGIs $75k-100k, 12.7% for AGIs over 100k)
Charity contributions deductions: $5,330 (3% of AGI, reported on 51.5% of returns)
Here:
$5,330
State:
$3,337
Here:
2.9% of AGI
State:
3.3% of AGI
(% of AGI for various income ranges: 1.7% for AGIs $10k-25k, 2.2% for AGIs $25k-50k, 2.2% for AGIs $50k-75k, 2.8% for AGIs $75k-100k, 2.5% for AGIs over 100k)
Total tax: $25,557 (reported on 81.7% of returns)
19422:
$25,557
State:
$8,008
(% of AGI for various income ranges: 4.9% for AGIs $10k-25k, 8.3% for AGIs $25k-50k, 10.4% for AGIs $50k-75k, 11.1% for AGIs $75k-100k, 21.6% for AGIs over 100k)
Earned income credit: $1,329 (reported on 3.7% of returns)
Here:
$1,329
State:
$1,643
Percentage of individuals using paid preparers for their 2004 taxes: 59.7%
Here:
60%
State:
56%
(% for various income ranges: 53.6% for AGIs below $10k, 56.4% for AGIs $10k-25k, 56.6% for AGIs $25k-50k, 58.1% for AGIs $50k-75k, 60.3% for AGIs $75k-100k, 67.0% for AGIs over 100k)
Household received Food Stamps/SNAP in the past 12 months: 188 Household did not receive Food Stamps/SNAP in the past 12 months: 7,581
Women who had a birth in the past 12 months: 186 (190 now married, 6 unmarried) Women who did not have a birth in the past 12 months: 3,924 (2,027 now married, 1,880 unmarried)
Housing units in zip code 19422 with a mortgage: 4,010 (503 second mortgage, 16 home equity loan, 454 both second mortgage and home equity loan) Houses without a mortgage: 254
Median monthly owner costs for units with a mortgage: $2,675 Median monthly owner costs for units without a mortgage: $927
Residents with income below the poverty level in 2022:
This zip code:
3.5%
Whole state:
11.8%
Residents with income below 50% of the poverty level in 2022:
This zip code:
1.2%
Whole state:
6.1%
Median number of rooms in houses and condos:
Here:
8.3
State:
6.8
Median number of rooms in apartments:
Here:
4.7
State:
4.3
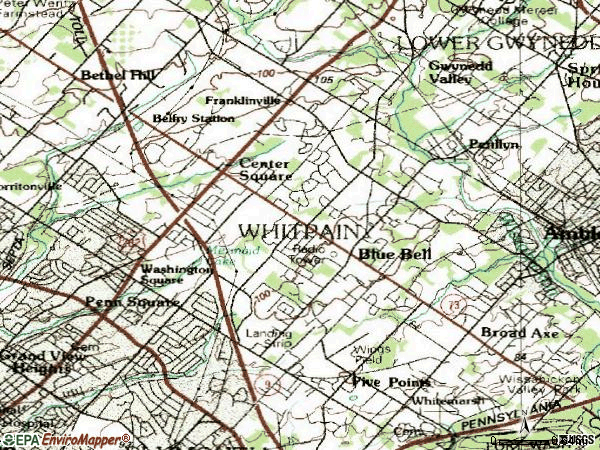
Notable locations in this zip code not listed on our city pages
Notable locations in zip code 19422: Mermaid Swim and Golf Club (A), Belfry Station (B), Meadowlands Country Club (C), Blue Bell Country Club (D), Blue Bell Office Camp (E), Mermaid Swim and Golf Course (F), Penllyn Station (G), Whitpain Business and Professional Park (H), Whitpain Industrial Center (I), Valley Square Campus Industrial Park (J), Centre Square Fire Company Station 33B (K), Centre Square Fire Company Station 33A Headquarters (L), Whitpain Township Hall (M), Whitpain Township Police Station (N), Wissahickon Valley Library (O). Display/hide their locations on the map
Shopping Centers: Clover Mall Shopping Center (1), Center Square Plaza Shopping Center (2), Whitpain Shopping Center (3). Display/hide their locations on the map
Churches in zip code 19422 include: Saint Johns Church (A), Tiferet Bet Israel (B), North Penn Korean Church (C), Boehms Church (D). Display/hide their locations on the map
In group quarters: 182 (-1 institutionalized population)
Size of family households: 2,375 2-persons, 1,427 3-persons, 1,186 4-persons, 512 5-persons, 69 6-persons, 65 7-or-more-persons
Size of nonfamily households: 1,876 1-person, 255 2-persons, 6 3-persons
3,802 married couples with children.
706 single-parent households (237 men, 469 women).
85.4% of residents of 19422 zip code speak English at home.
1.9% of residents speak Spanish at home (88% very well, 12% well).
4.2% of residents speak other Indo-European language at home (82% very well, 18% well).
8.5% of residents speak Asian or Pacific Island language at home (57% very well, 23% well, 19% not well, 1% not at all).
0.1% of residents speak other language at home (100% very well).
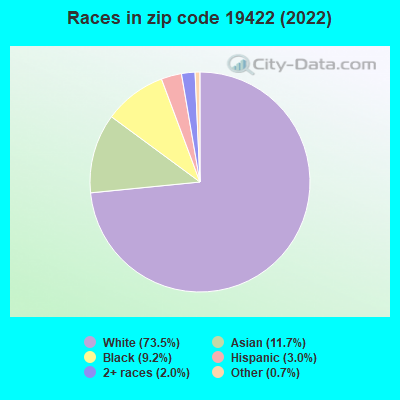
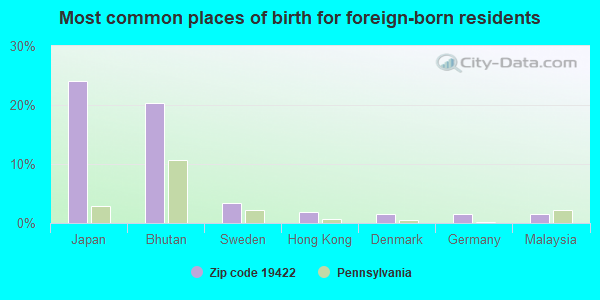
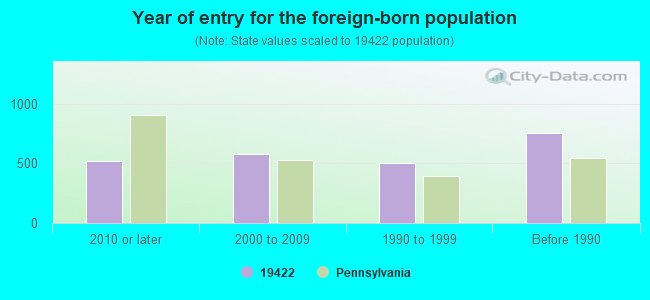
Foreign born population: 2,350 (11.7%) (70.8% of them are naturalized citizens)
This zip code:
11.7%
Whole state:
7.5%
24%Japan
20%Bhutan
3%Sweden
2%Hong Kong
2%Denmark
1%Germany
1%Malaysia
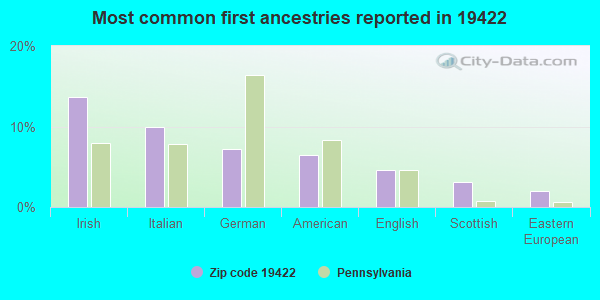
14%Irish
10%Italian
7%German
6%American
5%English
3%Scottish
2%Eastern European
Year of entry for the foreign-born population
5242010 or later
5812000 to 2009
5081990 to 1999
759Before 1990
Facilities with environmental interests located in this zip code:
BLUE BELL AUTO BODY (880 PENLLYN PIKE in BLUE BELL, PA)
STATE MASTER (Pennsylvania database) - RCRIS-PAD040843997, HAZARDOUS WASTE PROGRAM Conditionally Exempt Small Quantity Generators, less than 100 kg/month of hazardous waste (Resource Conservation and Recovery Act (tracking hazardous waste)) Organizations: OPERNAME (CONTACT/OPERATOR)
, OWNERNAME (CONTACT/OWNER)
Alternative names: MOPPERT BROTHERS
BLUE BELL EL SCH ( in BLUE BELL, PA)
(National Center for Education Statistics) - STATE ID-6470 Organizations: WISSAHICKON SD (SCHOOL DISTRICT)
BIDDLE INSTRUMENTS (510 TOWNSHIP LINE RD in BLUE BELL, PA)
ANY GARMENT CLEANERS NO 79 (1721 DEKALB PIKE in BLUE BELL, PA)
Small Quantity Generators, between 100 kg and 1000 kg of hazardous waste/month (Resource Conservation and Recovery Act (tracking hazardous waste)) Organizations: BOLTON BRADLY (CONTACT/OPERATOR)
BLUE BELL GULF (559 SKIPPACK PIKE in BLUE BELL, PA)
National Pollutant Discharge Elimination System NON-MAJOR (Tracking pollutant discharge elimination systems) - permit Business SIC classification: REFUSE SYSTEMS Alternative names: JOSEPH A FEOLA/REG DIR, PA DEP
ACRODYNE INDUSTRIES INC (516 TOWNSHIP LINE RD in BLUE BELL, PA)
Conditionally Exempt Small Quantity Generators, less than 100 kg/month of hazardous waste (Resource Conservation and Recovery Act (tracking hazardous waste)) - notification Organizations: MARSHALL C SMITH (CONTACT/OWNER)
AUTOMATED SYS INC (1777 SENTRY PKWY W in BLUE BELL, PA)
Small Quantity Generators, between 100 kg and 1000 kg of hazardous waste/month (Resource Conservation and Recovery Act (tracking hazardous waste)) - notification
1063 WALTON ROAD (1063 WALTON ROAD in BLUEBELL, PA)
ENFORCEMENT/COMPLIANCE ACTIVITY (Integrated Compliance Information System)
Housing units lacking complete plumbing facilities: 0.7% Housing units lacking complete kitchen facilities: 2.0%
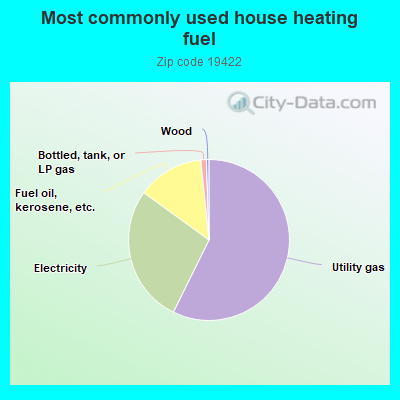
56.9%Utility gas
27.5%Electricity
13.3%Fuel oil, kerosene, etc.
1.1%Bottled, tank, or LP gas
0.5%Wood
Population in 1990: 16,645. Population change in the 1990s: +1,601 (+9.6%).
Place of birth for U.S.-born residents:
This state: 12,615
Northeast: 2,830
Midwest: 568
South: 1,149
West: 451
60% of the 19422 zip code residents lived in the same house 5 years ago. Out of people who lived in different houses, 56% lived in this county. Out of people who lived in different counties, 50% lived in Pennsylvania.
91% of the 19422 zip code residents lived in the same house 1 year ago. Out of people who lived in different houses, 62% moved from this county. Out of people who lived in different houses, 11% moved from different county within same state. Out of people who lived in different houses, 25% moved from different state. Out of people who lived in different houses, 3% moved from abroad.
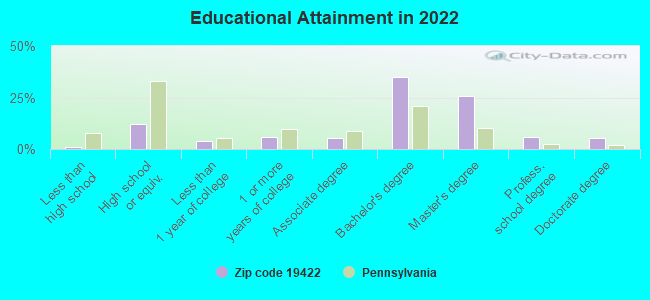
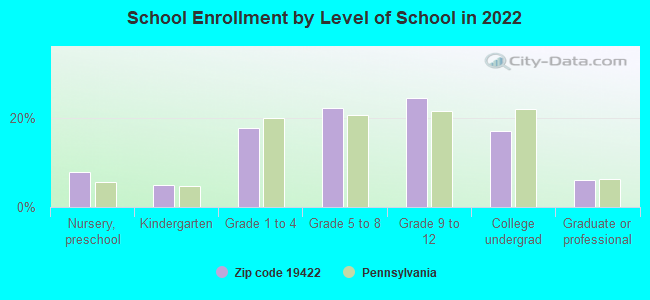
Private vs. public school enrollment:
Students in private schools in grades 1 to 8 (elementary and middle school): 550
Here:
24.8%
Pennsylvania:
15.7%
Students in private schools in grades 9 to 12 (high school): 324
Here:
24.0%
Pennsylvania:
13.4%
Students in private undergraduate colleges: 276
Here:
29.5%
Pennsylvania:
39.8%
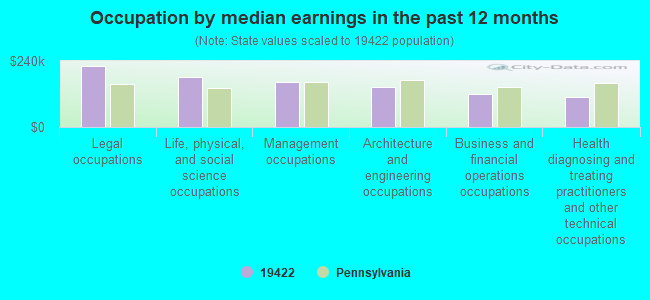
Occupation by median earnings in the past 12 months ($)
222,038Legal occupations
181,371Life, physical, and social science occupations
163,378Management occupations
144,584Architecture and engineering occupations
119,852Business and financial operations occupations
110,690Health diagnosing and treating practitioners and other technical occupations
Companies with biggest federal contracts located in this zip code (BLUE BELL, PA):
OGDEN ENVIRONMENTAL & ENERGY S (1777 SENTRY PARKWAY WEST; small business) : $74,339,488 in 105 contractsfrom 1999 to 2003
Contracts for Construction of Structures and Facilities -- Water Supply Facilities, Other Architect and Engineering Services, Guns, through 30 mm, Miscellaneous Items, and moreby Army, Air Force, Federal Aviation Administration, Navy, and others Signed by year:2000: $34,332,859; 2001: $24,728,213; 2002: $14,646,904; 2003: $79,019; 2004: $0; 2005: $0; 2006: $0.
Biggest contracts:
$4,900,000 with Army for Construction of Structures and Facilities -- Water Supply Facilities. Taking place in MA. Signed on 2001-01-23. Completion date: 2001-08-31.
$4,869,200, same as above.Signed on 2002-03-27. Completion date: 2002-04-30.
$4,422,099 with Army for Other Architect and Engineering Services. Taking place in FL. Signed on 2000-09-27. Completion date: 2002-09-30.
$4,023,085 with Army for Construction of Structures and Facilities -- Water Supply Facilities. Taking place in MA. Signed on 2000-09-29. Completion date: 2000-08-31.
E W YOST CO INC (340 N WALES RD; small business) : $10,021,520 in 350 contractsfrom 1999 to 2006
Contracts for Screws, Guns, through 30 mm, Batteries, Rechargeable, Guns, 75 mm through 125 mm, and moreby Army, Defense Logistics Agency, Navy Signed by year:2000: $625,123; 2001: $702,018; 2002: $950,938; 2003: $1,212,883; 2004: $1,315,214; 2005: $3,926,925; 2006: $1,258,023.
Biggest contracts:
$506,392 with Army for Screws. Signed on 2005-07-29. Completion date: 2007-12-31.
$486,841 with Army for Guns, through 30 mm. Signed on 2006-03-31. Completion date: 2011-06-30.
$373,425, same as above.Signed on 2005-11-17. Completion date: 2006-03-18.
$330,055, same as above.Signed on 2002-12-10. Completion date: 2003-09-18.
YARWAY CORPORATION (480 NORRISTOWN RD; small business) : $944,600 in 16 contractsfrom 2000 to 2003
Contracts for Miscellaneous Engines and Components, Steam Turbines and Components, Aircraft Launching Equipment, Maintenance, Repair and Rebuilding of Equipment -- Valves, and moreby Navy, Defense Logistics Agency Signed by year:2000: $487,893; 2001: $106,258; 2002: $264,449; 2003: $86,000; 2004: $0; 2005: $0; 2006: $0.
Biggest contracts:
$148,014 with Navy for Miscellaneous Engines and Components. Taking place in VA. Signed on 2000-04-07. Completion date: 2000-08-18.
$127,818 with Navy for Steam Turbines and Components. Signed on 2000-05-23. Completion date: 2001-03-05.
$123,830 with Navy for Aircraft Launching Equipment. Signed on 2002-11-06. Completion date: 2002-11-21.
$86,000 with Navy for Maintenance, Repair and Rebuilding of Equipment -- Valves. Taking place in VA. Signed on 2003-02-25. Completion date: 2003-04-23.
YARWAY CORPORATION (480 NORRISTOWN ROAD) : $823,153 in 6 contractsfrom 2000 to 2003
Contracts for Liquid and Gas Flow, Liquid Level, and Mechanical Motion Measuring Instruments, Hose, Pipe, Tube, Lubrication, and Railing Fittings, Valves, Nonpowered, Technical Representation Services -- Valves, and moreby Defense Logistics Agency, Navy Signed by year:2000: $135,388; 2001: $530,140; 2002: $0; 2003: $157,625; 2004: $0; 2005: $0; 2006: $0.
Biggest contracts:
$433,390 with Defense Logistics Agency for Liquid and Gas Flow, Liquid Level, and Mechanical Motion Measuring Instruments. Signed on 2001-05-25. Completion date: 2001-11-23.
$135,388 with Navy for Hose, Pipe, Tube, Lubrication, and Railing Fittings. Signed on 2000-10-20. Completion date: 2000-10-20.
$96,750 with Defense Logistics Agency for Liquid and Gas Flow, Liquid Level, and Mechanical Motion Measuring Instruments. Signed on 2001-04-10. Completion date: 2001-07-17.
$86,625 with Navy for Valves, Nonpowered. Signed on 2003-01-23. Completion date: 2003-09-30.
IMAGING MICROSENSORS INC (6198 BUTLER PIKE, SUITE 13; small business) : $718,760 in 6 contractsfrom 2002 to 2005
Contracts for Other Defense -- Advanced Development (R&D), Other Defense -- Operational Systems Development (R&D), Other Defense -- Basic Research (R&D), Defense Electronics and Communication Equipment -- Basic Research (R&D), and moreby Department of Defense, Navy, Army Signed by year:2000: $0; 2001: $0; 2002: $68,032; 2003: $369,679; 2004: $160,000; 2005: $121,049; 2006: $0.
Biggest contracts:
$299,751 with Department of Defense for Other Defense -- Advanced Development (R&D). Taking place in NJ. Signed on 2003-03-18. Completion date: 2003-12-17.
$125,000 with Navy for Other Defense -- Operational Systems Development (R&D). Signed on 2004-07-12. Completion date: 2007-06-30.
$121,049, same as above.Signed on 2005-04-11. Completion date: 2005-09-30.
$69,928 with Navy for Other Defense -- Basic Research (R&D). Signed on 2003-06-13. Completion date: 2004-04-30.
SELAS FLUID PROCESSING CORPORA (FIVE SENTRY PARKWAY EAST,) : $683,000 in 4 contractsfrom 2002 to 2005
$595,000 with Navy for Heat Exchangers and Steam Condensers. Signed on 2003-09-30. Completion date: 2004-08-27.
$58,400 with Air Force for Maintenance, Repair and Rebuilding of Equipment -- Plumbing, Heating, and Waste Disposal Equipment. Signed on 2003-08-21. Completion date: 2004-02-05.
$39,600 with Defense Logistics Agency for Waste Disposal Equipment. Signed on 2002-02-04. Completion date: 2002-08-26.
-$10,000 with Air Force for Maintenance, Repair and Rebuilding of Equipment -- Plumbing, Heating, and Waste Disposal Equipment. Taking place in OK. Signed on 2005-07-08. Completion date: 2004-02-13.
TECHNICAL ADVISORY SERVICE (1166 DEKALB PIKE STE 200) : $551,850 in 19 contractsfrom 1999 to 2006
Contracts for Expert Witness, Legal Services, Miscellaneous Items, Other Professional Services by Internal Revenue Service, Offices, Boards and Divisions (includes Attorney General, Deputy Attorney General, etc.), Department of Veterans Affairs, Equal Employment Opportunity Commission, and others Signed by year:2000: -$9,000; 2001: $0; 2002: $39,450; 2003: $0; 2004: $125,835; 2005: $17,565; 2006: $210,000.
Biggest contracts:
$168,000 with Internal Revenue Service for Expert Witness. Signed on 1999-12-15. Completion date: 2000-05-15.
$144,500 with Offices, Boards and Divisions (includes Attorney General, Deputy Attorney General, etc.) for Expert Witness. Taking place in DC. Signed on 2006-03-17. Completion date: 2008-12-31.
$69,000 with Department of Veterans Affairs for Expert Witness. Taking place in VA. Signed on 2006-05-27. Effective on 2006-06-01. Completion date: 2007-07-07.
$60,000 with Offices, Boards and Divisions (includes Attorney General, Deputy Attorney General, etc.) for Legal Services. Signed on 2004-03-15. Completion date: 2004-05-28.
DE PAUL REALTY CO (1750 WALTON ROAD; small business) : $452,504 in 8 contractsfrom 2001 to 2004
Contracts for Lease or Rental of Facilities -- Troop Housing Facilities, Lease or Rental of Facilities -- Other Residential Buildings by Army Signed by year:2000: $0; 2001: $232,519; 2002: $198,510; 2003: $30,750; 2004: -$9,275; 2005: $0; 2006: $0.
Biggest contracts:
$193,325 with Army for Lease or Rental of Facilities -- Troop Housing Facilities. Signed on 2002-10-15. Completion date: 2003-09-30.
$175,000 with Army for Lease or Rental of Facilities -- Other Residential Buildings. Signed on 2001-11-30. Completion date: 2002-11-30.
$57,519, same as above.Signed on 2001-12-20. Completion date: 2002-11-30.
$55,650 with Army for Lease or Rental of Facilities -- Troop Housing Facilities. Signed on 2003-10-07. Completion date: 2003-09-30.
SOFTWARE MARKETING CONSULTANTS (650 SENTRY PKWY STE 1; small business) : $198,736 in 4 contractsfrom 2004 to 2005
$82,874 with Navy for Bending and Forming Machines. Signed on 2004-10-19. Completion date: 2009-10-18.
$59,100 with Navy for Other Defense -- Applied Research and Exploratory Development (R&D). Taking place in MA. Signed on 2004-03-30. Completion date: 2004-05-04.
$51,900 with NASA for ADP Support Equipment. Signed on 2005-10-26. Completion date: 2006-01-26.
$4,862 with Navy for ADP Software. Signed on 2005-06-09. Completion date: 2005-07-20.
WINGSPAN TECHNOLOGY INC (490 NORRISTOWN RD STE 151; small business) : $152,800 in 2 contractsfrom 2005 to 2006
$82,600 with Air Force for Programming Services. Signed on 2006-03-16. Completion date: 2007-03-19.
$70,200 with Army for ADP Software. Signed on 2005-09-16. Completion date: 2005-10-17.
Top industries in this zip code by the number of employees in 2005:
Finance and Insurance: Direct Health and Medical Insurance Carriers (over 1000: 1, 500-999: 2, 250-499: 1, 100-249: 2, 10-19: 1, 1-4: 2)
Administrative and Support and Waste Management and Remediation Services: Temporary Help Services (100-249: 4, 50-99: 5, 20-49: 5, 10-19: 3, 5-9: 2, 1-4: 5)
Construction: Power and Communication Line and Related Structures Construction (500-999: 1, 100-249: 1, 20-49: 1)
Finance and Insurance: Direct Property and Casualty Insurance Carriers (250-499: 1, 100-249: 1, 50-99: 1, 20-49: 2, 10-19: 1, 5-9: 3, 1-4: 1)
Professional, Scientific, and Technical Services: Marketing Research and Public Opinion Polling (250-499: 1, 50-99: 1, 20-49: 2, 1-4: 1)
Professional, Scientific, and Technical Services: Research and Development in the Physical, Engineering, and Life Sciences (100-249: 2, 50-99: 1, 20-49: 1, 10-19: 1)
Health Care and Social Assistance: Home Health Care Services (250-499: 1, 20-49: 2, 10-19: 1)
Professional, Scientific, and Technical Services: Offices of Lawyers (50-99: 2, 20-49: 3, 10-19: 5, 5-9: 7, 1-4: 32)
People in group quarters in 2010:
137 people in nursing facilities/skilled-nursing facilities
10 people in group homes intended for adults
People in group quarters in 2000:
99 people in nursing homes
74 people in other noninstitutional group quarters
5 people in other nonhousehold living situations
2 people in religious group quarters
Fatal accident statistics in 2014:
Fatal accident count: 1
Vehicles involved in fatal accidents: 2
Fatal accidents caused by drunken drivers: 0
Fatalities: 1
Persons involved in fatal accidents: 2
Pedestrians involved in fatal accidents: 0
Fatal accident statistics in 2012:
Fatal accident count: 1
Vehicles involved in fatal accidents: 2
Fatal accidents caused by drunken drivers: 0
Fatalities: 1
Persons involved in fatal accidents: 2
Pedestrians involved in fatal accidents: 0
Home Mortgage Disclosure Act Aggregated Statistics For Year 2009 (Based on 8 full and 6 partial tracts)
A) FHA, FSA/RHS & VA Home Purchase Loans
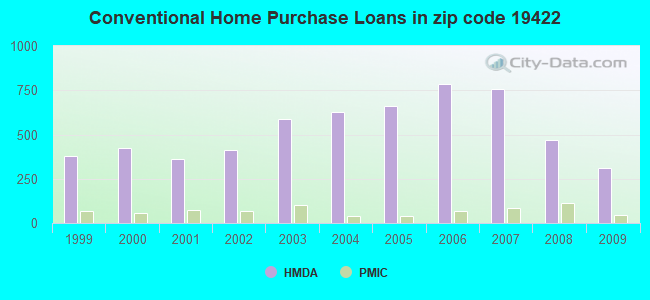
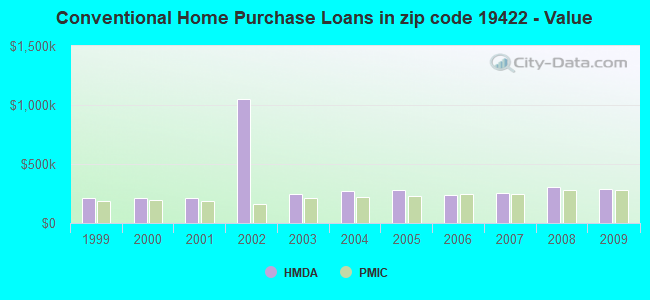
B) Conventional Home Purchase Loans
C) Refinancings
D) Home Improvement Loans
E) Loans on Dwellings For 5+ Families
F) Non-occupant Loans on < 5 Family Dwellings (A B C & D)
G) Loans On Manufactured Home Dwelling (A B C & D)
Number
Average Value
Number
Average Value
Number
Average Value
Number
Average Value
Number
Average Value
Number
Average Value
Number
Average Value
LOANS ORIGINATED
121
$230,830
312
$288,152
1,338
$277,478
51
$179,075
2
$404,190
44
$198,576
2
$115,700
APPLICATIONS APPROVED, NOT ACCEPTED
2
$211,320
26
$310,632
87
$275,212
12
$120,757
0
$0
2
$148,695
2
$149,700
APPLICATIONS DENIED
6
$290,662
24
$289,992
262
$307,061
35
$96,127
0
$0
11
$133,636
0
$0
APPLICATIONS WITHDRAWN
8
$207,515
38
$307,611
230
$278,188
12
$107,382
0
$0
10
$159,299
0
$0
FILES CLOSED FOR INCOMPLETENESS
0
$0
10
$281,573
78
$265,644
2
$99,130
0
$0
0
$0
0
$0
Aggregated Statistics For Year 2008 (Based on 8 full and 6 partial tracts)
A) FHA, FSA/RHS & VA Home Purchase Loans
B) Conventional Home Purchase Loans
C) Refinancings
D) Home Improvement Loans
E) Loans on Dwellings For 5+ Families
F) Non-occupant Loans on < 5 Family Dwellings (A B C & D)
G) Loans On Manufactured Home Dwelling (A B C & D)
Number
Average Value
Number
Average Value
Number
Average Value
Number
Average Value
Number
Average Value
Number
Average Value
Number
Average Value
LOANS ORIGINATED
31
$231,764
467
$307,062
558
$258,014
147
$77,795
0
$0
60
$207,840
4
$87,325
APPLICATIONS APPROVED, NOT ACCEPTED
0
$0
53
$313,212
125
$256,041
31
$74,496
0
$0
3
$280,230
0
$0
APPLICATIONS DENIED
0
$0
46
$299,292
196
$250,772
56
$68,412
0
$0
17
$161,216
0
$0
APPLICATIONS WITHDRAWN
4
$214,872
49
$356,132
123
$289,602
7
$100,739
1
$230,900
11
$125,695
0
$0
FILES CLOSED FOR INCOMPLETENESS
0
$0
9
$258,087
20
$235,992
4
$98,878
0
$0
2
$415,915
0
$0
Aggregated Statistics For Year 2007 (Based on 8 full and 6 partial tracts)
A) FHA, FSA/RHS & VA Home Purchase Loans
B) Conventional Home Purchase Loans
C) Refinancings
D) Home Improvement Loans
F) Non-occupant Loans on < 5 Family Dwellings (A B C & D)
G) Loans On Manufactured Home Dwelling (A B C & D)
Number
Average Value
Number
Average Value
Number
Average Value
Number
Average Value
Number
Average Value
Number
Average Value
LOANS ORIGINATED
7
$210,381
758
$250,953
633
$242,741
183
$67,174
75
$178,265
16
$80,428
APPLICATIONS APPROVED, NOT ACCEPTED
0
$0
93
$259,547
142
$204,296
67
$113,964
3
$127,180
1
$195,860
APPLICATIONS DENIED
0
$0
92
$317,467
317
$271,245
72
$73,046
35
$135,315
10
$146,841
APPLICATIONS WITHDRAWN
3
$201,030
59
$209,564
107
$316,630
15
$180,388
7
$123,037
4
$117,265
FILES CLOSED FOR INCOMPLETENESS
0
$0
8
$158,561
47
$352,936
3
$185,560
0
$0
0
$0
Aggregated Statistics For Year 2006 (Based on 8 full and 6 partial tracts)
A) FHA, FSA/RHS & VA Home Purchase Loans
B) Conventional Home Purchase Loans
C) Refinancings
D) Home Improvement Loans
E) Loans on Dwellings For 5+ Families
F) Non-occupant Loans on < 5 Family Dwellings (A B C & D)
G) Loans On Manufactured Home Dwelling (A B C & D)
Number
Average Value
Number
Average Value
Number
Average Value
Number
Average Value
Number
Average Value
Number
Average Value
Number
Average Value
LOANS ORIGINATED
5
$199,804
788
$239,224
683
$222,676
245
$82,499
1
$242,910
92
$203,534
2
$195,610
APPLICATIONS APPROVED, NOT ACCEPTED
1
$275,270
116
$227,489
163
$235,918
52
$99,939
0
$0
13
$217,410
0
$0
APPLICATIONS DENIED
0
$0
102
$218,989
324
$243,632
120
$113,952
0
$0
26
$185,950
10
$277,271
APPLICATIONS WITHDRAWN
0
$0
93
$210,421
216
$264,755
10
$52,194
0
$0
10
$233,165
0
$0
FILES CLOSED FOR INCOMPLETENESS
0
$0
22
$220,249
61
$271,477
16
$168,655
0
$0
3
$317,873
0
$0
Aggregated Statistics For Year 2005 (Based on 8 full and 6 partial tracts)
A) FHA, FSA/RHS & VA Home Purchase Loans
B) Conventional Home Purchase Loans
C) Refinancings
D) Home Improvement Loans
E) Loans on Dwellings For 5+ Families
F) Non-occupant Loans on < 5 Family Dwellings (A B C & D)
G) Loans On Manufactured Home Dwelling (A B C & D)
Number
Average Value
Number
Average Value
Number
Average Value
Number
Average Value
Number
Average Value
Number
Average Value
Number
Average Value
LOANS ORIGINATED
4
$149,610
662
$277,051
893
$252,481
235
$94,457
6
$29,481,960
35
$189,276
4
$42,878
APPLICATIONS APPROVED, NOT ACCEPTED
0
$0
108
$239,340
202
$193,610
32
$124,068
0
$0
13
$197,044
1
$191,890
APPLICATIONS DENIED
1
$300,410
80
$313,159
418
$301,190
110
$125,880
0
$0
28
$233,943
0
$0
APPLICATIONS WITHDRAWN
0
$0
87
$265,255
283
$257,170
50
$257,093
0
$0
12
$142,025
2
$19,935
FILES CLOSED FOR INCOMPLETENESS
0
$0
18
$254,201
89
$296,673
3
$139,240
0
$0
3
$206,027
0
$0
Aggregated Statistics For Year 2004 (Based on 8 full and 6 partial tracts)
A) FHA, FSA/RHS & VA Home Purchase Loans
B) Conventional Home Purchase Loans
C) Refinancings
D) Home Improvement Loans
E) Loans on Dwellings For 5+ Families
F) Non-occupant Loans on < 5 Family Dwellings (A B C & D)
G) Loans On Manufactured Home Dwelling (A B C & D)
Number
Average Value
Number
Average Value
Number
Average Value
Number
Average Value
Number
Average Value
Number
Average Value
Number
Average Value
LOANS ORIGINATED
6
$197,208
629
$268,932
975
$234,022
185
$101,718
4
$245,895
55
$207,042
0
$0
APPLICATIONS APPROVED, NOT ACCEPTED
0
$0
66
$251,520
169
$211,693
32
$61,015
0
$0
23
$160,685
0
$0
APPLICATIONS DENIED
0
$0
60
$263,962
380
$252,533
76
$131,944
0
$0
13
$147,762
0
$0
APPLICATIONS WITHDRAWN
2
$259,720
72
$230,603
240
$271,296
24
$99,232
0
$0
6
$319,690
1
$138,540
FILES CLOSED FOR INCOMPLETENESS
0
$0
10
$337,536
157
$272,741
16
$47,091
0
$0
2
$104,070
0
$0
Aggregated Statistics For Year 2003 (Based on 8 full and 6 partial tracts)
A) FHA, FSA/RHS & VA Home Purchase Loans
B) Conventional Home Purchase Loans
C) Refinancings
D) Home Improvement Loans
E) Loans on Dwellings For 5+ Families
F) Non-occupant Loans on < 5 Family Dwellings (A B C & D)
Number
Average Value
Number
Average Value
Number
Average Value
Number
Average Value
Number
Average Value
Number
Average Value
LOANS ORIGINATED
19
$133,651
589
$243,352
3,293
$213,016
234
$93,868
2
$44,885
84
$162,507
APPLICATIONS APPROVED, NOT ACCEPTED
0
$0
76
$239,855
460
$201,140
48
$77,407
0
$0
13
$127,797
APPLICATIONS DENIED
2
$124,675
68
$255,642
603
$222,416
79
$86,354
0
$0
28
$147,709
APPLICATIONS WITHDRAWN
0
$0
57
$201,810
331
$220,351
24
$70,252
0
$0
16
$168,823
FILES CLOSED FOR INCOMPLETENESS
0
$0
23
$240,774
121
$240,851
11
$110,829
0
$0
1
$122,840
Aggregated Statistics For Year 2002 (Based on 4 full and 6 partial tracts)
A) FHA, FSA/RHS & VA Home Purchase Loans
B) Conventional Home Purchase Loans
C) Refinancings
D) Home Improvement Loans
E) Loans on Dwellings For 5+ Families
F) Non-occupant Loans on < 5 Family Dwellings (A B C & D)
Number
Average Value
Number
Average Value
Number
Average Value
Number
Average Value
Number
Average Value
Number
Average Value
LOANS ORIGINATED
10
$133,307
412
$1,049,167
1,295
$422,132
137
$61,933
0
$0
34
$121,512
APPLICATIONS APPROVED, NOT ACCEPTED
0
$0
55
$330,905
183
$163,341
29
$49,761
0
$0
7
$126,364
APPLICATIONS DENIED
0
$0
23
$375,244
207
$191,463
50
$56,558
2
$99,740
5
$82,834
APPLICATIONS WITHDRAWN
0
$0
27
$269,038
159
$194,149
15
$65,387
0
$0
3
$94,177
FILES CLOSED FOR INCOMPLETENESS
0
$0
7
$359,781
61
$179,525
9
$122,370
0
$0
0
$0
Aggregated Statistics For Year 2001 (Based on 4 full and 6 partial tracts)
A) FHA, FSA/RHS & VA Home Purchase Loans
B) Conventional Home Purchase Loans
C) Refinancings
D) Home Improvement Loans
E) Loans on Dwellings For 5+ Families
F) Non-occupant Loans on < 5 Family Dwellings (A B C & D)
Number
Average Value
Number
Average Value
Number
Average Value
Number
Average Value
Number
Average Value
Number
Average Value
LOANS ORIGINATED
20
$107,071
362
$215,577
862
$192,190
122
$54,328
1
$115,450
21
$128,470
APPLICATIONS APPROVED, NOT ACCEPTED
0
$0
27
$235,628
81
$151,253
40
$33,384
0
$0
0
$0
APPLICATIONS DENIED
3
$105,297
17
$186,738
176
$145,702
49
$41,858
0
$0
8
$46,242
APPLICATIONS WITHDRAWN
0
$0
37
$188,532
119
$175,261
21
$25,900
0
$0
1
$132,340
FILES CLOSED FOR INCOMPLETENESS
2
$54,855
4
$215,155
36
$171,454
0
$0
0
$0
1
$89,990
Aggregated Statistics For Year 2000 (Based on 4 full and 6 partial tracts)
A) FHA, FSA/RHS & VA Home Purchase Loans
B) Conventional Home Purchase Loans
C) Refinancings
D) Home Improvement Loans
F) Non-occupant Loans on < 5 Family Dwellings (A B C & D)
Number
Average Value
Number
Average Value
Number
Average Value
Number
Average Value
Number
Average Value
LOANS ORIGINATED
18
$101,554
426
$209,353
182
$116,297
118
$33,811
11
$159,895
APPLICATIONS APPROVED, NOT ACCEPTED
0
$0
53
$189,300
42
$102,415
32
$31,775
1
$43,670
APPLICATIONS DENIED
2
$99,740
30
$172,126
103
$129,261
34
$29,868
3
$29,317
APPLICATIONS WITHDRAWN
0
$0
36
$255,462
90
$123,492
20
$36,088
4
$53,028
FILES CLOSED FOR INCOMPLETENESS
1
$90,510
4
$149,190
21
$186,707
7
$43,261
0
$0
Aggregated Statistics For Year 1999 (Based on 3 full and 3 partial tracts)
A) FHA, FSA/RHS & VA Home Purchase Loans
B) Conventional Home Purchase Loans
C) Refinancings
D) Home Improvement Loans
E) Loans on Dwellings For 5+ Families
F) Non-occupant Loans on < 5 Family Dwellings (A B C & D)
2003 - 2018 National Fire Incident Reporting System (NFIRS) incidents
Based on the data from the years 2003 - 2018 the average number of fires per year is 21. The highest number of fire incidents - 62 took place in 2005, and the least - 0 in 2009. The data has a declining trend.
When looking into fire subcategories, the most incidents belonged to: Structure Fires (55.6%), and Outside Fires (21.6%).
Fire incident types reported to NFIRS in Zip Code 19422
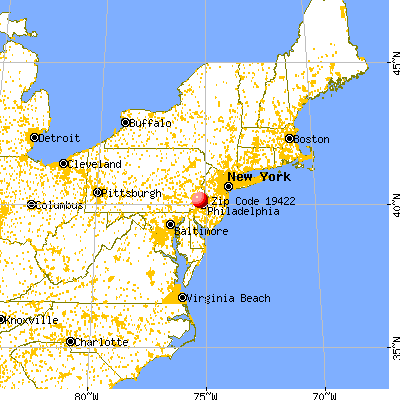


 Nearest zip codes: 19437, 19462, 19477, 19436, 19401, 19444.


 Based on the data from the years 2003 - 2018 the average number of fires per year is 21. The highest number of fire incidents - 62 took place in 2005, and the least - 0 in 2009. The data has a declining trend.
 When looking into fire subcategories, the most incidents belonged to: Structure Fires (55.6%), and Outside Fires (21.6%).