Estimated zip code population in 2022: 6,914 Zip code population in 2010: 7,525 Zip code population in 2000: 6,854
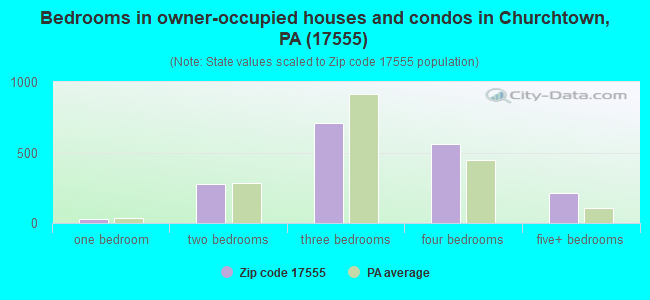
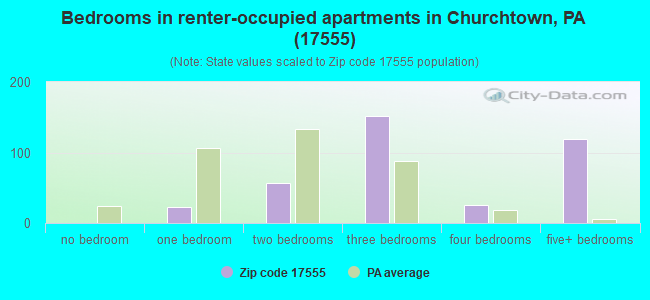
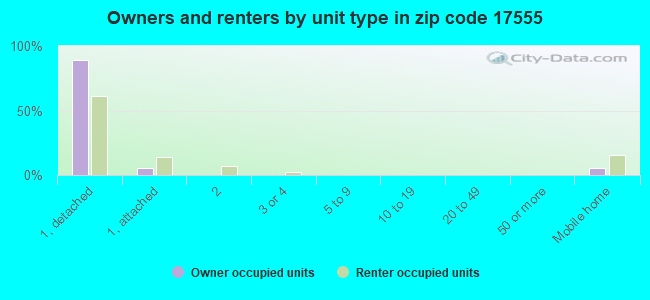
Houses and condos: 2,221 Renter-occupied apartments: 392
% of renters here:
18%
State:
31%
March 2022 cost of living index in zip code 17555: 95.6 (near average, U.S. average is 100)
Land area: 34.9 sq. mi. Water area: 0.2 sq. mi.
Population density: 198 people per square mile
(very low).
OSM Map
General Map
Google Map
MSN Map
OSM Map
General Map
Google Map
MSN Map
OSM Map
General Map
Google Map
MSN Map
OSM Map
General Map
Google Map
MSN Map
Please wait while loading the map...
Real estate property taxes paid for housing units in 2022:
This zip code:
1.1% ($4,114)
Pennsylvania:
1.3% ($3,094)
Median real estate property taxes paid for housing units with mortgages in 2022: $4,035 (1.1%) Median real estate property taxes paid for housing units with no mortgage in 2022: $4,242 (1.1%)
Business Search- 14 Million verified businesses
Males: 3,476
(50.3%)
Females: 3,438
(49.7%)
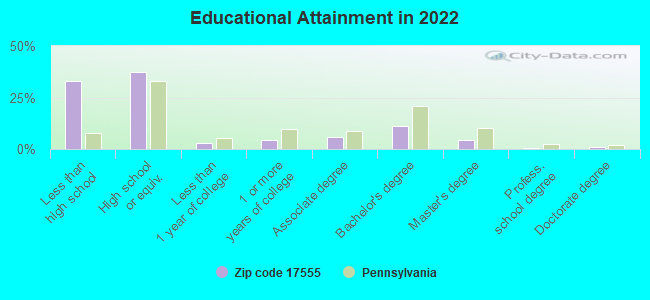
For population 25 years and over in 17555:
High school or higher: 63.8%
Bachelor's degree or higher: 15.5%
Graduate or professional degree: 5.1%
Unemployed: 1.5%
Mean travel time to work (commute): 23.0 minutes
For population 15 years and over in 17555:
Never married: 28.0%
Now married: 62.0%
Separated: 0.3%
Widowed: 7.3%
Divorced: 2.4%
Zip code 17555 compared to state average:
Median house value above state average.
Unemployed percentage significantly below state average.
Black race population percentage significantly below state average.
Hispanic race population percentage significantly below state average.
Median age below state average.
Foreign-born population percentage significantly below state average.
Renting percentage below state average.
Length of stay since moving in significantly above state average.
House age below state average.
Number of college students significantly below state average.
Percentage of population with a bachelor's degree or higher significantly below state average.
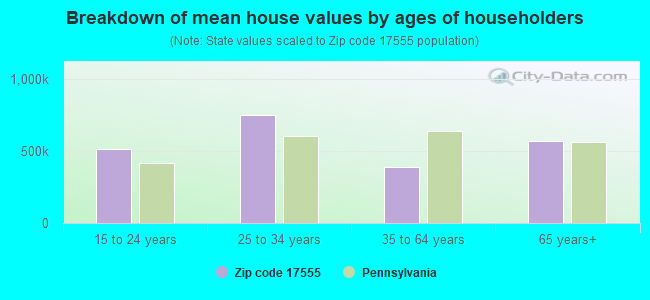
Estimated median house/condo value in 2022: $370,963
17555:
$370,963
Pennsylvania:
$245,500
According to our research of Pennsylvania and other state lists, there were 8 registered sex offenders living in 17555 zip code as of July 03, 2024. The ratio of all residents to sex offenders in zip code 17555 is 891 to 1. The ratio of registered sex offenders to all residents in this zip code is lower than the state average.
Median resident age:
This zip code:
34.2 years
Pennsylvania median age:
40.9 years
Average household size:
This zip code:
3.1 people
Pennsylvania:
2.4 people
Averages for the 2020 tax year for zip code 17555, filed in 2021:
Average Adjusted Gross Income (AGI) in 2020: $64,093 (Individual Income Tax Returns)
Here:
$64,093
State:
$75,707
Salary/wage: $47,442 (reported on 73.9% of returns)
Here:
$47,442
State:
$62,806
(% of AGI for various income ranges: 1719.5% for AGIs below $25k, 4718.6% for AGIs $25k-50k, 8816.7% for AGIs $50k-75k, 10783.2% for AGIs $75k-100k, 16411.8% for AGIs $100k-200k)
Taxable interest for individuals: $2,385 (reported on 36.1% of returns)
This zip code:
$2,385
Pennsylvania:
$1,633
(% of AGI for various income ranges: 140.0% for AGIs below $25k, 146.9% for AGIs $25k-50k, 177.8% for AGIs $50k-75k, 143.7% for AGIs $75k-100k, 158.2% for AGIs $100k-200k)
Ordinary dividends: $3,716 (reported on 16.1% of returns)
Here:
$3,716
State:
$7,382
(% of AGI for various income ranges: 38.3% for AGIs below $25k, 42.6% for AGIs $25k-50k, 78.1% for AGIs $50k-75k, 92.6% for AGIs $75k-100k, 262.3% for AGIs $100k-200k)
Net capital gain/loss in AGI: +$12,633 (reported on 17.9% of returns)
Here:
+$12,633
State:
+$23,522
(% of AGI for various income ranges: 46.8% for AGIs below $25k, 93.3% for AGIs $25k-50k, 313.7% for AGIs $50k-75k, 433.2% for AGIs $75k-100k, 633.6% for AGIs $100k-200k)
Profit/loss from business: +$29,943 (reported on 27.6% of returns)
Here:
+$29,943
State:
+$16,274
(% of AGI for various income ranges: 399.0% for AGIs below $25k, 698.3% for AGIs $25k-50k, 1227.4% for AGIs $50k-75k, 1617.4% for AGIs $75k-100k, 3890.0% for AGIs $100k-200k)
Taxable individual retirement arrangement distribution: $13,859 (reported on 9.4% of returns)
17555:
$13,859
Pennsylvania:
$18,583
(% of AGI for various income ranges: 121.7% for AGIs below $25k, 128.6% for AGIs $25k-50k, 381.1% for AGIs $50k-75k, 369.5% for AGIs $75k-100k, 756.8% for AGIs $100k-200k)
Total itemized deductions: $38,043 (reported on 6.7% of returns)
Here:
$38,043
State:
$34,850
(% of AGI for various income ranges: 288.6% for AGIs $25k-50k, 343.0% for AGIs $50k-75k, 411.6% for AGIs $75k-100k, 919.1% for AGIs $100k-200k)
Charity contributions: $21,411 (reported on 5.6% of returns)
Here:
$21,411
State:
$12,392
(% of AGI for various income ranges: 38.5% for AGIs below $25k, 58.9% for AGIs $50k-75k, 107.4% for AGIs $75k-100k, 353.2% for AGIs $100k-200k)
Taxes paid: $7,291 (reported on 6.7% of returns)
17555:
$7,291
State:
$8,200
(% of AGI for various income ranges: 44.0% for AGIs $25k-50k, 70.7% for AGIs $50k-75k, 107.9% for AGIs $75k-100k, 255.5% for AGIs $100k-200k)
Earned income credit: $1,658 (reported on 7.6% of returns)
Here:
$1,658
State:
$2,100
(% of AGI for various income ranges: 52.2% for AGIs below $25k, 51.7% for AGIs $25k-50k)
Percentage of individuals using paid preparers for their 2020 taxes: 90.6%
Here:
91%
State:
92%
(% for various income ranges: 90.8% for AGIs below $25k, 90.9% for AGIs $25k-50k, 91.4% for AGIs $50k-75k, 86.5% for AGIs $75k-100k, 91.3% for AGIs $100k-200k, 92.9% for AGIs over 200k)
Averages for the 2012 tax year for zip code 17555, filed in 2013:
Average Adjusted Gross Income (AGI) in 2012: $48,857 (Individual Income Tax Returns)
Here:
$48,857
State:
$61,346
Salary/wage: $40,637 (reported on 75.1% of returns)
Here:
$40,637
State:
$51,902
(% of AGI for various income ranges: 62.1% for AGIs below $25k, 65.9% for AGIs $25k-50k, 66.0% for AGIs $50k-75k, 67.4% for AGIs $75k-100k, 63.0% for AGIs $100k-200k, 43.6% for AGIs over 200k)
Taxable interest for individuals: $1,773 (reported on 42.0% of returns)
This zip code:
$1,773
Pennsylvania:
$1,588
(% of AGI for various income ranges: 3.6% for AGIs below $25k, 2.0% for AGIs $25k-50k, 1.3% for AGIs $50k-75k, 1.0% for AGIs $75k-100k, 1.3% for AGIs $100k-200k, 1.0% for AGIs over 200k)
Ordinary dividends: $3,030 (reported on 17.0% of returns)
Here:
$3,030
State:
$5,827
(% of AGI for various income ranges: 1.3% for AGIs below $25k, 0.6% for AGIs $25k-50k, 0.6% for AGIs $50k-75k, 0.8% for AGIs $75k-100k, 1.5% for AGIs $100k-200k, 1.8% for AGIs over 200k)
Net capital gain/loss in AGI: +$8,779 (reported on 14.8% of returns)
Here:
+$8,779
State:
+$14,495
(% of AGI for various income ranges: 1.1% for AGIs below $25k, 1.8% for AGIs $25k-50k, 2.6% for AGIs $50k-75k, 1.0% for AGIs $75k-100k, 3.4% for AGIs $100k-200k, 6.4% for AGIs over 200k)
Profit/loss from business: +$18,156 (reported on 25.6% of returns)
Here:
+$18,156
State:
+$16,268
(% of AGI for various income ranges: 13.0% for AGIs below $25k, 9.8% for AGIs $25k-50k, 11.2% for AGIs $50k-75k, 8.5% for AGIs $75k-100k, 12.4% for AGIs $100k-200k)
Taxable individual retirement arrangement distribution: $10,777 (reported on 9.5% of returns)
17555:
$10,777
Pennsylvania:
$14,550
(% of AGI for various income ranges: 3.8% for AGIs below $25k, 2.4% for AGIs $25k-50k, 1.5% for AGIs $50k-75k, 2.5% for AGIs $75k-100k, 2.5% for AGIs $100k-200k)
Total itemized deductions: $20,812 (23% of AGI, reported on 29.3% of returns)
Here:
$20,812
State:
$23,538
Here:
22.5% of AGI
State:
18.4% of AGI
(% of AGI for various income ranges: 8.3% for AGIs below $25k, 10.2% for AGIs $25k-50k, 12.6% for AGIs $50k-75k, 15.1% for AGIs $75k-100k, 14.4% for AGIs $100k-200k, 11.6% for AGIs over 200k)
Charity contributions: $5,169 (reported on 24.6% of returns)
Here:
$5,169
State:
$4,025
(% of AGI for various income ranges: 0.9% for AGIs below $25k, 1.7% for AGIs $25k-50k, 1.9% for AGIs $50k-75k, 3.1% for AGIs $75k-100k, 3.7% for AGIs $100k-200k, 3.6% for AGIs over 200k)
Taxes paid: $7,362 (reported on 29.3% of returns)
17555:
$7,362
State:
$9,982
(% of AGI for various income ranges: 1.9% for AGIs below $25k, 2.8% for AGIs $25k-50k, 4.2% for AGIs $50k-75k, 5.3% for AGIs $75k-100k, 5.7% for AGIs $100k-200k, 5.3% for AGIs over 200k)
Earned income credit: $1,952 (reported on 9.1% of returns)
Here:
$1,952
State:
$2,106
(% of AGI for various income ranges: 2.6% for AGIs below $25k, 0.7% for AGIs $25k-50k)
Percentage of individuals using paid preparers for their 2012 taxes: 69.1%
Here:
69%
State:
53%
(% for various income ranges: 64.5% for AGIs below $25k, 72.4% for AGIs $25k-50k, 75.5% for AGIs $50k-75k, 66.7% for AGIs $75k-100k, 69.2% for AGIs $100k-200k, 80.0% for AGIs over 200k)
Averages for the 2004 tax year for zip code 17555, filed in 2005:
Average Adjusted Gross Income (AGI) in 2004: $42,677 (Individual Income Tax Returns)
Here:
$42,677
State:
$48,049
Salary/wage: $37,048 (reported on 77.4% of returns)
Here:
$37,048
State:
$42,646
(% of AGI for various income ranges: 108.4% for AGIs below $10k, 64.3% for AGIs $10k-25k, 67.7% for AGIs $25k-50k, 73.3% for AGIs $50k-75k, 77.9% for AGIs $75k-100k, 49.7% for AGIs over 100k)
Taxable interest for individuals: $1,745 (reported on 57.1% of returns)
This zip code:
$1,745
Pennsylvania:
$1,657
(% of AGI for various income ranges: 9.1% for AGIs below $10k, 5.0% for AGIs $10k-25k, 2.4% for AGIs $25k-50k, 1.9% for AGIs $50k-75k, 1.7% for AGIs $75k-100k, 1.9% for AGIs over 100k)
Taxable dividends: $1,501 (reported on 20.8% of returns)
Here:
$1,501
State:
$3,566
(% of AGI for various income ranges: 3.7% for AGIs below $10k, 1.1% for AGIs $10k-25k, 1.0% for AGIs $25k-50k, 0.4% for AGIs $50k-75k, 0.9% for AGIs $75k-100k, 0.5% for AGIs over 100k)
Net capital gain/loss: +$8,803 (reported on 17.3% of returns)
Here:
+$8,803
State:
+$9,716
(% of AGI for various income ranges: -2.3% for AGIs below $10k, 1.0% for AGIs $10k-25k, 1.5% for AGIs $25k-50k, 2.7% for AGIs $50k-75k, 2.6% for AGIs $75k-100k, 8.9% for AGIs over 100k)
Profit/loss from business: +$20,347 (reported on 24.9% of returns)
Here:
+$20,347
State:
+$14,267
(% of AGI for various income ranges: 21.5% for AGIs below $10k, 10.7% for AGIs $10k-25k, 13.0% for AGIs $25k-50k, 9.9% for AGIs $50k-75k, 5.8% for AGIs $75k-100k, 17.4% for AGIs over 100k)
Profit/loss from farming: +$10,552 (reported on 6.8% of returns)
Here:
+$10,552
State:
+$274
(% of AGI for various income ranges: -12.7% for AGIs below $10k, 2.3% for AGIs $10k-25k, 3.8% for AGIs $25k-50k, 2.3% for AGIs $50k-75k, 0.7% for AGIs $75k-100k)
IRA payment deduction: $3,074 (reported on 3.3% of returns)
17555:
$3,074
Pennsylvania:
$2,903
(% of AGI for various income ranges: 0.4% for AGIs $25k-50k, 0.3% for AGIs $50k-75k, 0.1% for AGIs $75k-100k, 0.2% for AGIs over 100k)
Self-employed pension: $8,045 (reported on 0.8% of returns)
Here:
$8,045
Pennsylvania:
$14,674
Total itemized deductions: $16,683 (23% of AGI, reported on 32.7% of returns)
Here:
$16,683
State:
$18,804
Here:
22.8% of AGI
State:
19.5% of AGI
(% of AGI for various income ranges: 10.8% for AGIs below $10k, 8.8% for AGIs $10k-25k, 11.6% for AGIs $25k-50k, 13.0% for AGIs $50k-75k, 15.7% for AGIs $75k-100k, 13.2% for AGIs over 100k)
Charity contributions deductions: $3,901 (5% of AGI, reported on 28.4% of returns)
Here:
$3,901
State:
$3,337
Here:
5.2% of AGI
State:
3.3% of AGI
(% of AGI for various income ranges: 1.0% for AGIs $10k-25k, 1.8% for AGIs $25k-50k, 2.6% for AGIs $50k-75k, 2.6% for AGIs $75k-100k, 4.2% for AGIs over 100k)
Total tax: $5,474 (reported on 76.5% of returns)
17555:
$5,474
State:
$8,008
(% of AGI for various income ranges: 3.5% for AGIs below $10k, 5.1% for AGIs $10k-25k, 7.0% for AGIs $25k-50k, 8.0% for AGIs $50k-75k, 9.5% for AGIs $75k-100k, 17.4% for AGIs over 100k)
Earned income credit: $1,550 (reported on 6.0% of returns)
Here:
$1,550
State:
$1,643
Percentage of individuals using paid preparers for their 2004 taxes: 70.1%
Here:
70%
State:
56%
(% for various income ranges: 64.5% for AGIs below $10k, 70.7% for AGIs $10k-25k, 74.3% for AGIs $25k-50k, 72.2% for AGIs $50k-75k, 61.8% for AGIs $75k-100k, 71.9% for AGIs over 100k)
Household received Food Stamps/SNAP in the past 12 months: 70 Household did not receive Food Stamps/SNAP in the past 12 months: 2,095
Women who had a birth in the past 12 months: 176 (176 now married, 9 unmarried) Women who did not have a birth in the past 12 months: 1,160 (681 now married, 471 unmarried)
Housing units in zip code 17555 with a mortgage: 971 (229 second mortgage, 228 both second mortgage and home equity loan) Houses without a mortgage: 56
Median monthly owner costs for units with a mortgage: $1,771 Median monthly owner costs for units without a mortgage: $692
Residents with income below the poverty level in 2022:
This zip code:
6.3%
Whole state:
11.8%
Residents with income below 50% of the poverty level in 2022:
This zip code:
5.3%
Whole state:
6.1%
Median number of rooms in houses and condos:
Here:
7.2
State:
6.8
Median number of rooms in apartments:
Here:
6.1
State:
4.3
Notable locations in this zip code not listed on our city pages
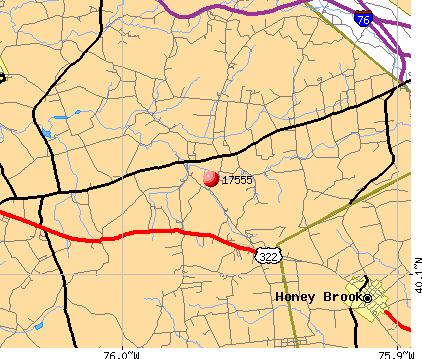
Churches in zip code 17555 include: Grace Church (A), Wenger Church (B), Mount Zion Church (C), Old Road Church (D), Bridgeville Church (E), Bowmansville Church (F). Display/hide their locations on the map
In group quarters: 94 (-1 institutionalized population)
Size of family households: 774 2-persons, 211 3-persons, 343 4-persons, 148 5-persons, 159 6-persons, 164 7-or-more-persons
Size of nonfamily households: 336 1-person, 32 2-persons
2,065 married couples with children.
92 single-parent households (85 men, 7 women).
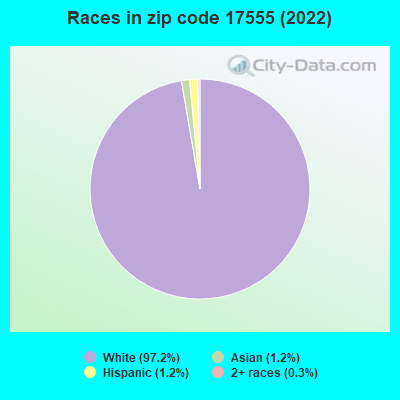
65.3% of residents of 17555 zip code speak English at home.
0.4% of residents speak Spanish at home (100% very well).
34.3% of residents speak other Indo-European language at home (71% very well, 26% well, 3% not well, 1% not at all).
0.1% of residents speak Asian or Pacific Island language at home (100% very well).
Foreign born population: 58 (0.9%) (84.5% of them are naturalized citizens)
This zip code:
0.9%
Whole state:
7.5%
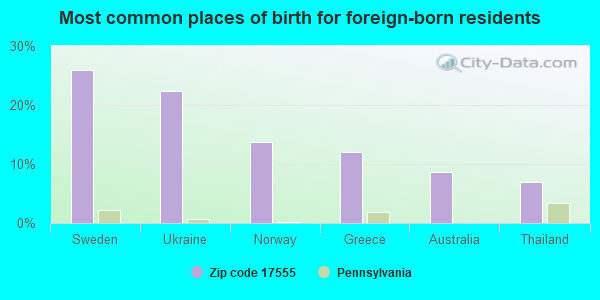
26%Sweden
22%Ukraine
14%Norway
12%Greece
9%Australia
7%Thailand
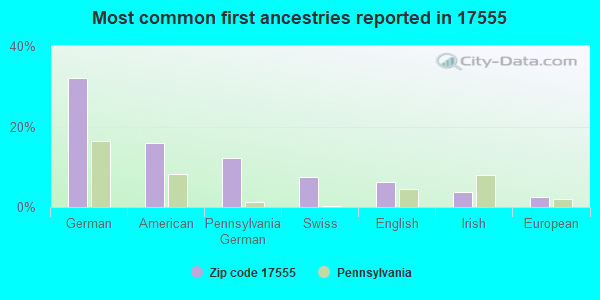
32%German
16%American
12%Pennsylvania German
7%Swiss
6%English
4%Irish
2%European
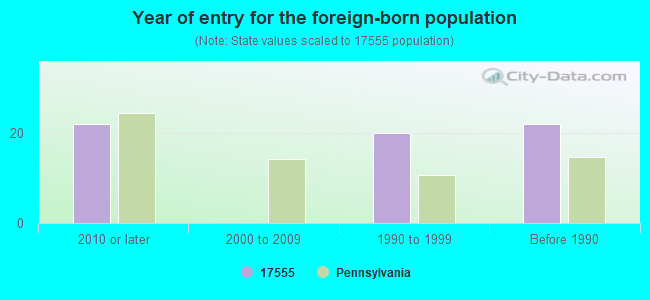
Year of entry for the foreign-born population
222010 or later
02000 to 2009
201990 to 1999
22Before 1990
Facilities with environmental interests located in this zip code:
APPLE GROVE SCHOOL (5919 MAST ROAD in NARVON, PA)
(Integrated Compliance Information System) - ICIS-03-1989-0868, FORMAL ENFORCEMENT ACTION COMPLIANCE ACTIVITY (Tracking inspections of insecticide, fungicide, and rodenticide, and toxic substances)
BEAVER DAM SCHOOL (300 CHURCHTOWN ROAD in NARVON, PA)
(Integrated Compliance Information System) - ICIS-03-1989-0873, FORMAL ENFORCEMENT ACTION COMPLIANCE ACTIVITY (Tracking inspections of insecticide, fungicide, and rodenticide, and toxic substances) Business SIC classification: ELEMENTARY AND SECONDARY SCHOOLS
BARTON SHORT (1498 DIVISION HWY in NARVON, PA)
National Pollutant Discharge Elimination System NON-MAJOR (Tracking pollutant discharge elimination systems) - permit Business SIC classification: SEWERAGE SYSTEMS Alternative names: SHORT, BARTON
BALDWIN BJ ELEC (6121 RTE 322 in NARVON, PA)
Conditionally Exempt Small Quantity Generators, less than 100 kg/month of hazardous waste (Resource Conservation and Recovery Act (tracking hazardous waste)) Organizations: OPERNAME (CONTACT/OPERATOR)
Alternative names: BJ BALDWIN ELEC CONST
Housing units lacking complete plumbing facilities: 0.4% Housing units lacking complete kitchen facilities: 0.4%
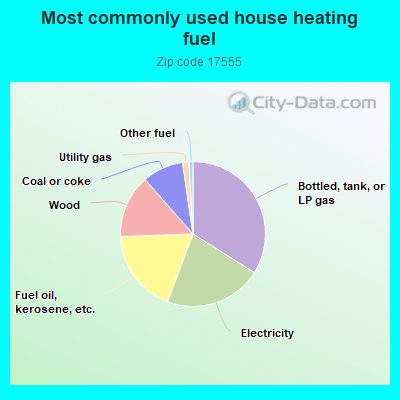
34.0%Bottled, tank, or LP gas
21.8%Electricity
18.7%Fuel oil, kerosene, etc.
14.1%Wood
9.2%Coal or coke
1.4%Utility gas
0.9%Other fuel
Population in 1990: 7,239.
Place of birth for U.S.-born residents:
This state: 6,362
Northeast: 104
Midwest: 114
South: 191
West: 12
69% of the 17555 zip code residents lived in the same house 5 years ago. Out of people who lived in different houses, 64% lived in this county. Out of people who lived in different counties, 50% lived in Pennsylvania.
96% of the 17555 zip code residents lived in the same house 1 year ago. Out of people who lived in different houses, 63% moved from this county. Out of people who lived in different houses, 27% moved from different county within same state. Out of people who lived in different houses, 14% moved from different state.
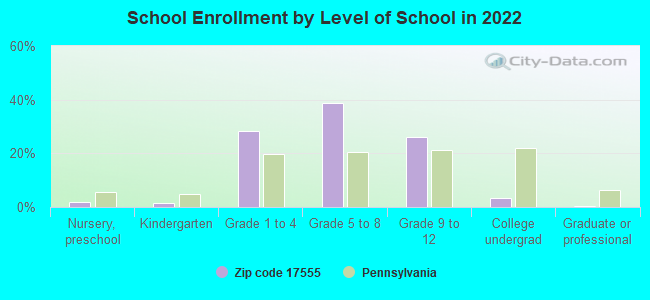
Private vs. public school enrollment:
Students in private schools in grades 1 to 8 (elementary and middle school): 707
Here:
75.3%
Pennsylvania:
15.7%
Students in private schools in grades 9 to 12 (high school): 93
Here:
26.2%
Pennsylvania:
13.4%
Students in private undergraduate colleges: 19
Here:
43.5%
Pennsylvania:
39.8%
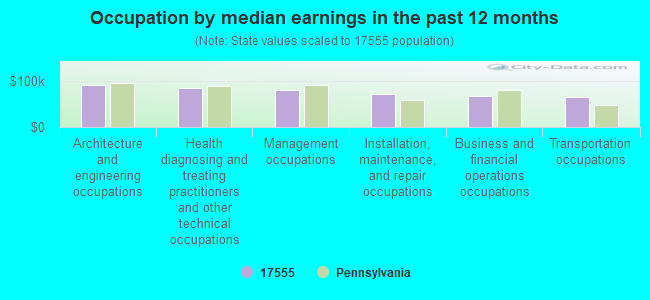
Occupation by median earnings in the past 12 months ($)
90,790Architecture and engineering occupations
84,069Health diagnosing and treating practitioners and other technical occupations
80,761Management occupations
72,024Installation, maintenance, and repair occupations
67,907Business and financial operations occupations
65,233Transportation occupations
Companies with federal contracts located in this zip code:
W G MALDEN, INC (5758 GLEN OAKS DRIVE in NARVON, PA; small business) : $20,335 in 7 contractsfrom 2003 to 2005
Contracts for Maintenance, Repair and Rebuilding of Equipment -- Maintenance and Repair Shop Equipment, Inspection Services (including commercial testing and lab services, except medical/dental) -- Pumps and Compressors by Army Signed by year:2000: $0; 2001: $0; 2002: $0; 2003: $10,025; 2004: $1,244; 2005: $9,066; 2006: $0.
Biggest contracts:
$15,600 with Army for Maintenance, Repair and Rebuilding of Equipment -- Maintenance and Repair Shop Equipment. Signed on 2003-11-18. Completion date: 2004-11-14.
$10,724, same as above.Signed on 2005-09-22. Completion date: 2006-11-14.
$10,724, same as above.Signed on 2004-10-25. Completion date: 2005-11-14.
$0 with Army for Inspection Services (including commercial testing and lab services, except medical/dental) -- Pumps and Compressors. Signed on 2003-09-25. Completion date: 2003-09-30.
SMUCKERS HARNESS SHOP INC (2014 MAINSTREET CHURCHTOWN in NARVON, PA; small business)
$4,950 with Army for Saddlery, Harness, Whips, and Related Animal Furnishings. Taking place in VA. Signed on 2003-09-30. Completion date: 2003-10-31.
Top industries in this zip code by the number of employees in 2005:
2002 - 2018 National Fire Incident Reporting System (NFIRS) incidents
Based on the data from the years 2002 - 2018 the average number of fire incidents per year is 33. The highest number of fires - 59 took place in 2006, and the least - 11 in 2003. The data has an increasing trend.
When looking into fire subcategories, the most reports belonged to: Structure Fires (49.7%), and Outside Fires (32.5%).
Fire incident types reported to NFIRS in Zip Code 17555

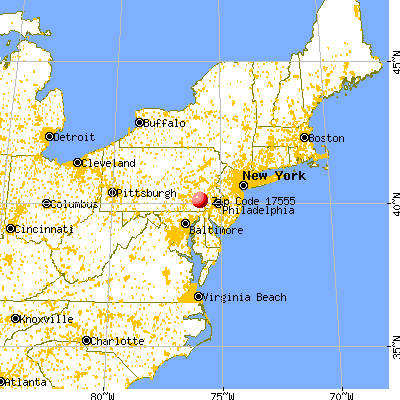


 Nearest zip codes: 17519, 19543, 19344, 17507, 17581, 19540.


 Based on the data from the years 2002 - 2018 the average number of fire incidents per year is 33. The highest number of fires - 59 took place in 2006, and the least - 11 in 2003. The data has an increasing trend.
 When looking into fire subcategories, the most reports belonged to: Structure Fires (49.7%), and Outside Fires (32.5%).