Estimated zip code population in 2022: 6,642 Zip code population in 2010: 6,824 Zip code population in 2000: 5,320
Houses and condos: 2,516 Renter-occupied apartments: 720
% of renters here:
29%
State:
31%
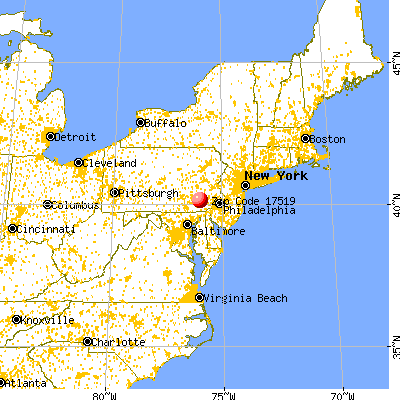
March 2022 cost of living index in zip code 17519: 94.8 (less than average, U.S. average is 100)
Land area: 22.2 sq. mi. Water area: 0.2 sq. mi.
Population density: 299 people per square mile
(very low).
OSM Map
General Map
Google Map
MSN Map
OSM Map
General Map
Google Map
MSN Map
OSM Map
General Map
Google Map
MSN Map
OSM Map
General Map
Google Map
MSN Map
Please wait while loading the map...
Real estate property taxes paid for housing units in 2022:
This zip code:
1.1% ($3,863)
Pennsylvania:
1.3% ($3,094)
Median real estate property taxes paid for housing units with mortgages in 2022: $3,862 (1.0%) Median real estate property taxes paid for housing units with no mortgage in 2022: $3,869 (1.3%)
Business Search- 14 Million verified businesses
Males: 3,399
(51.2%)
Females: 3,242
(48.8%)
For population 25 years and over in 17519:
High school or higher: 66.6%
Bachelor's degree or higher: 15.3%
Graduate or professional degree: 4.8%
Unemployed: 0.9%
Mean travel time to work (commute): 21.7 minutes
For population 15 years and over in 17519:
Never married: 24.7%
Now married: 62.0%
Separated: 0.9%
Widowed: 6.3%
Divorced: 6.1%
Zip code 17519 compared to state average:
Unemployed percentage significantly below state average.
Black race population percentage significantly below state average.
Hispanic race population percentage significantly below state average.
Median age below state average.
Length of stay since moving in significantly above state average.
Number of college students below state average.
Percentage of population with a bachelor's degree or higher significantly below state average.
Estimated median house/condo value in 2022: $357,505
17519:
$357,505
Pennsylvania:
$245,500
According to our research of Pennsylvania and other state lists, there were 7 registered sex offenders living in 17519 zip code as of July 03, 2024. The ratio of all residents to sex offenders in zip code 17519 is 1,089 to 1. The ratio of registered sex offenders to all residents in this zip code is lower than the state average.
Median resident age:
This zip code:
36.4 years
Pennsylvania median age:
40.9 years
Average household size:
This zip code:
2.7 people
Pennsylvania:
2.4 people
Averages for the 2020 tax year for zip code 17519, filed in 2021:
Average Adjusted Gross Income (AGI) in 2020: $79,636 (Individual Income Tax Returns)
Here:
$79,636
State:
$75,707
Salary/wage: $50,660 (reported on 77.0% of returns)
Here:
$50,660
State:
$62,806
(% of AGI for various income ranges: 1820.3% for AGIs below $25k, 4356.8% for AGIs $25k-50k, 8535.8% for AGIs $50k-75k, 10872.0% for AGIs $75k-100k, 17682.9% for AGIs $100k-200k)
Taxable interest for individuals: $3,269 (reported on 36.5% of returns)
This zip code:
$3,269
Pennsylvania:
$1,633
(% of AGI for various income ranges: 136.9% for AGIs below $25k, 154.6% for AGIs $25k-50k, 139.6% for AGIs $50k-75k, 133.5% for AGIs $75k-100k, 238.6% for AGIs $100k-200k)
Ordinary dividends: $4,320 (reported on 18.2% of returns)
Here:
$4,320
State:
$7,382
(% of AGI for various income ranges: 46.9% for AGIs below $25k, 46.5% for AGIs $25k-50k, 76.2% for AGIs $50k-75k, 139.0% for AGIs $75k-100k, 155.2% for AGIs $100k-200k)
Net capital gain/loss in AGI: +$12,921 (reported on 19.6% of returns)
Here:
+$12,921
State:
+$23,522
(% of AGI for various income ranges: 31.1% for AGIs below $25k, 90.5% for AGIs $25k-50k, 143.8% for AGIs $50k-75k, 351.5% for AGIs $75k-100k, 927.1% for AGIs $100k-200k)
Profit/loss from business: +$26,128 (reported on 25.3% of returns)
Here:
+$26,128
State:
+$16,274
(% of AGI for various income ranges: 363.3% for AGIs below $25k, 711.6% for AGIs $25k-50k, 697.9% for AGIs $50k-75k, 1486.0% for AGIs $75k-100k, 2738.1% for AGIs $100k-200k)
Taxable individual retirement arrangement distribution: $13,819 (reported on 9.1% of returns)
17519:
$13,819
Pennsylvania:
$18,583
(% of AGI for various income ranges: 126.1% for AGIs below $25k, 150.5% for AGIs $25k-50k, 321.7% for AGIs $50k-75k, 280.0% for AGIs $75k-100k, 661.0% for AGIs $100k-200k)
Total itemized deductions: $44,395 (reported on 7.1% of returns)
Here:
$44,395
State:
$34,850
(% of AGI for various income ranges: 159.7% for AGIs below $25k, 252.9% for AGIs $50k-75k, 491.0% for AGIs $75k-100k, 1314.8% for AGIs $100k-200k)
Charity contributions: $29,972 (reported on 6.1% of returns)
Here:
$29,972
State:
$12,392
(% of AGI for various income ranges: 77.3% for AGIs $25k-50k, 140.0% for AGIs $75k-100k, 597.1% for AGIs $100k-200k)
Taxes paid: $8,133 (reported on 7.1% of returns)
17519:
$8,133
State:
$8,200
(% of AGI for various income ranges: 82.5% for AGIs $50k-75k, 104.5% for AGIs $75k-100k, 354.3% for AGIs $100k-200k)
Earned income credit: $1,975 (reported on 6.8% of returns)
Here:
$1,975
State:
$2,100
(% of AGI for various income ranges: 56.7% for AGIs below $25k, 51.6% for AGIs $25k-50k)
Percentage of individuals using paid preparers for their 2020 taxes: 91.9%
Here:
92%
State:
92%
(% for various income ranges: 91.1% for AGIs below $25k, 89.6% for AGIs $25k-50k, 93.6% for AGIs $50k-75k, 91.9% for AGIs $75k-100k, 95.3% for AGIs $100k-200k, 91.7% for AGIs over 200k)
Averages for the 2012 tax year for zip code 17519, filed in 2013:
Average Adjusted Gross Income (AGI) in 2012: $55,084 (Individual Income Tax Returns)
Here:
$55,084
State:
$61,346
Salary/wage: $42,080 (reported on 77.8% of returns)
Here:
$42,080
State:
$51,902
(% of AGI for various income ranges: 63.8% for AGIs below $25k, 70.5% for AGIs $25k-50k, 66.2% for AGIs $50k-75k, 71.2% for AGIs $75k-100k, 69.2% for AGIs $100k-200k, 26.9% for AGIs over 200k)
Taxable interest for individuals: $3,137 (reported on 45.6% of returns)
This zip code:
$3,137
Pennsylvania:
$1,588
(% of AGI for various income ranges: 4.2% for AGIs below $25k, 2.5% for AGIs $25k-50k, 1.4% for AGIs $50k-75k, 1.1% for AGIs $75k-100k, 1.8% for AGIs $100k-200k, 4.8% for AGIs over 200k)
Ordinary dividends: $4,456 (reported on 18.5% of returns)
Here:
$4,456
State:
$5,827
(% of AGI for various income ranges: 1.1% for AGIs below $25k, 1.0% for AGIs $25k-50k, 0.9% for AGIs $50k-75k, 0.7% for AGIs $75k-100k, 1.1% for AGIs $100k-200k, 3.5% for AGIs over 200k)
Net capital gain/loss in AGI: +$9,649 (reported on 16.7% of returns)
Here:
+$9,649
State:
+$14,495
(% of AGI for various income ranges: 1.3% for AGIs below $25k, 1.7% for AGIs $25k-50k, 1.5% for AGIs $50k-75k, 2.1% for AGIs $75k-100k, 2.5% for AGIs $100k-200k, 6.6% for AGIs over 200k)
Profit/loss from business: +$16,541 (reported on 25.9% of returns)
Here:
+$16,541
State:
+$16,268
(% of AGI for various income ranges: 13.3% for AGIs below $25k, 8.7% for AGIs $25k-50k, 8.3% for AGIs $50k-75k, 8.0% for AGIs $75k-100k, 4.5% for AGIs $100k-200k, 7.7% for AGIs over 200k)
Taxable individual retirement arrangement distribution: $9,592 (reported on 9.6% of returns)
17519:
$9,592
Pennsylvania:
$14,550
(% of AGI for various income ranges: 3.3% for AGIs below $25k, 2.7% for AGIs $25k-50k, 1.8% for AGIs $50k-75k, 1.7% for AGIs $75k-100k, 1.9% for AGIs $100k-200k)
Total itemized deductions: $24,363 (22% of AGI, reported on 29.3% of returns)
Here:
$24,363
State:
$23,538
Here:
21.9% of AGI
State:
18.4% of AGI
(% of AGI for various income ranges: 7.9% for AGIs below $25k, 8.8% for AGIs $25k-50k, 11.2% for AGIs $50k-75k, 15.1% for AGIs $75k-100k, 16.8% for AGIs $100k-200k, 14.2% for AGIs over 200k)
Charity contributions: $8,693 (reported on 24.8% of returns)
Here:
$8,693
State:
$4,025
(% of AGI for various income ranges: 1.1% for AGIs below $25k, 1.4% for AGIs $25k-50k, 2.7% for AGIs $50k-75k, 3.6% for AGIs $75k-100k, 4.3% for AGIs $100k-200k, 7.7% for AGIs over 200k)
Taxes paid: $7,962 (reported on 29.3% of returns)
17519:
$7,962
State:
$9,982
(% of AGI for various income ranges: 1.9% for AGIs below $25k, 2.0% for AGIs $25k-50k, 3.8% for AGIs $50k-75k, 5.3% for AGIs $75k-100k, 6.4% for AGIs $100k-200k, 4.4% for AGIs over 200k)
Earned income credit: $1,921 (reported on 10.4% of returns)
Here:
$1,921
State:
$2,106
(% of AGI for various income ranges: 2.9% for AGIs below $25k, 0.8% for AGIs $25k-50k)
Percentage of individuals using paid preparers for their 2012 taxes: 70.4%
Here:
70%
State:
53%
(% for various income ranges: 67.3% for AGIs below $25k, 71.2% for AGIs $25k-50k, 73.3% for AGIs $50k-75k, 72.0% for AGIs $75k-100k, 66.7% for AGIs $100k-200k, 100.0% for AGIs over 200k)
Averages for the 2004 tax year for zip code 17519, filed in 2005:
Average Adjusted Gross Income (AGI) in 2004: $46,835 (Individual Income Tax Returns)
Here:
$46,835
State:
$48,049
Salary/wage: $35,175 (reported on 78.0% of returns)
Here:
$35,175
State:
$42,646
(% of AGI for various income ranges: 84.6% for AGIs below $10k, 69.7% for AGIs $10k-25k, 69.6% for AGIs $25k-50k, 73.6% for AGIs $50k-75k, 70.0% for AGIs $75k-100k, 32.4% for AGIs over 100k)
Taxable interest for individuals: $2,491 (reported on 61.3% of returns)
This zip code:
$2,491
Pennsylvania:
$1,657
(% of AGI for various income ranges: 9.2% for AGIs below $10k, 5.8% for AGIs $10k-25k, 3.4% for AGIs $25k-50k, 2.2% for AGIs $50k-75k, 1.3% for AGIs $75k-100k, 3.7% for AGIs over 100k)
Taxable dividends: $1,917 (reported on 22.3% of returns)
Here:
$1,917
State:
$3,566
(% of AGI for various income ranges: 1.6% for AGIs below $10k, 0.8% for AGIs $10k-25k, 0.9% for AGIs $25k-50k, 0.5% for AGIs $50k-75k, 0.3% for AGIs $75k-100k, 1.4% for AGIs over 100k)
Net capital gain/loss: +$10,707 (reported on 17.3% of returns)
Here:
+$10,707
State:
+$9,716
(% of AGI for various income ranges: 0.5% for AGIs below $10k, 1.1% for AGIs $10k-25k, 1.7% for AGIs $25k-50k, 1.9% for AGIs $50k-75k, 1.4% for AGIs $75k-100k, 8.8% for AGIs over 100k)
Profit/loss from business: +$14,865 (reported on 24.6% of returns)
Here:
+$14,865
State:
+$14,267
(% of AGI for various income ranges: 7.8% for AGIs below $10k, 9.5% for AGIs $10k-25k, 10.3% for AGIs $25k-50k, 5.4% for AGIs $50k-75k, 7.5% for AGIs $75k-100k, 7.4% for AGIs over 100k)
Profit/loss from farming: +$17,985 (reported on 9.0% of returns)
Here:
+$17,985
State:
+$274
(% of AGI for various income ranges: 4.7% for AGIs below $10k, 4.0% for AGIs $10k-25k, 4.7% for AGIs $25k-50k, 5.1% for AGIs $50k-75k, 5.1% for AGIs $75k-100k, 0.6% for AGIs over 100k)
IRA payment deduction: $3,086 (reported on 3.6% of returns)
17519:
$3,086
Pennsylvania:
$2,903
(% of AGI for various income ranges: 0.3% for AGIs $10k-25k, 0.4% for AGIs $25k-50k, 0.2% for AGIs $50k-75k, 0.3% for AGIs $75k-100k, 0.2% for AGIs over 100k)
Total itemized deductions: $18,560 (20% of AGI, reported on 28.6% of returns)
Here:
$18,560
State:
$18,804
Here:
19.5% of AGI
State:
19.5% of AGI
(% of AGI for various income ranges: 14.6% for AGIs below $10k, 5.4% for AGIs $10k-25k, 9.2% for AGIs $25k-50k, 12.4% for AGIs $50k-75k, 14.8% for AGIs $75k-100k, 11.9% for AGIs over 100k)
Charity contributions deductions: $7,416 (7% of AGI, reported on 25.3% of returns)
Here:
$7,416
State:
$3,337
Here:
7.4% of AGI
State:
3.3% of AGI
(% of AGI for various income ranges: 1.5% for AGIs $10k-25k, 2.2% for AGIs $25k-50k, 3.0% for AGIs $50k-75k, 4.0% for AGIs $75k-100k, 6.7% for AGIs over 100k)
Total tax: $7,467 (reported on 76.1% of returns)
17519:
$7,467
State:
$8,008
(% of AGI for various income ranges: 3.0% for AGIs below $10k, 4.9% for AGIs $10k-25k, 7.4% for AGIs $25k-50k, 8.1% for AGIs $50k-75k, 10.0% for AGIs $75k-100k, 21.2% for AGIs over 100k)
Earned income credit: $1,500 (reported on 6.9% of returns)
Here:
$1,500
State:
$1,643
Percentage of individuals using paid preparers for their 2004 taxes: 73.6%
Here:
74%
State:
56%
(% for various income ranges: 67.0% for AGIs below $10k, 75.3% for AGIs $10k-25k, 76.9% for AGIs $25k-50k, 73.1% for AGIs $50k-75k, 69.8% for AGIs $75k-100k, 79.3% for AGIs over 100k)
Likely homosexual households (counted as self-reported same-sex unmarried-partner households)
Lesbian couples: 0.0% of all households
Gay men: 0.3% of all households
Household received Food Stamps/SNAP in the past 12 months: 56 Household did not receive Food Stamps/SNAP in the past 12 months: 2,385
Women who had a birth in the past 12 months: 66 (51 now married, 15 unmarried) Women who did not have a birth in the past 12 months: 1,321 (734 now married, 578 unmarried)
Housing units in zip code 17519 with a mortgage: 900 (62 second mortgage, 62 both second mortgage and home equity loan) Houses without a mortgage: 55
Median monthly owner costs for units with a mortgage: $1,523 Median monthly owner costs for units without a mortgage: $705
Residents with income below the poverty level in 2022:
This zip code:
3.9%
Whole state:
11.8%
Residents with income below 50% of the poverty level in 2022:
This zip code:
1.8%
Whole state:
6.1%
Median number of rooms in houses and condos:
Here:
7.1
State:
6.8
Median number of rooms in apartments:
Here:
5.7
State:
4.3
Notable locations in this zip code not listed on our city pages
Notable locations in zip code 17519: Sensenig (A), Cedar Lane (B), Oberholtzer Dairy Farm (C), Blue Ball Fire Company 1 Station 3 - 2 (D), Goodville Fire Company Station Quick Response Service 3 - 6 (E). Display/hide their locations on the map
Size of family households: 818 2-persons, 377 3-persons, 243 4-persons, 284 5-persons, 85 6-persons, 112 7-or-more-persons
Size of nonfamily households: 484 1-person, 40 2-persons
1,458 married couples with children.
96 single-parent households (96 women).
78.5% of residents of 17519 zip code speak English at home.
0.1% of residents speak Spanish at home (100% very well).
20.9% of residents speak other Indo-European language at home (68% very well, 27% well, 5% not well).
0.5% of residents speak Asian or Pacific Island language at home (57% very well, 43% well).
0.1% of residents speak other language at home (100% very well).
Foreign born population: 343 (5.2%) (88.2% of them are naturalized citizens)
This zip code:
5.2%
Whole state:
7.5%
53%Greece
8%Taiwan
6%Uzbekistan
4%Malaysia
1%Chile
1%Argentina
36%German
18%American
9%Swiss
9%Italian
5%Irish
4%English
4%Dutch
Year of entry for the foreign-born population
442010 or later
112000 to 2009
481990 to 1999
227Before 1990
Facilities with environmental interests located in this zip code:
BLACK CREEK SCHOOL (RD 1 BOX 385 in EAST EARL, PA)
(Integrated Compliance Information System) - ICIS-03-1989-0883, FORMAL ENFORCEMENT ACTION COMPLIANCE ACTIVITY (Tracking inspections of insecticide, fungicide, and rodenticide, and toxic substances)
Housing units lacking complete plumbing facilities: 0.9% Housing units lacking complete kitchen facilities: 0.9%
45.0%Electricity
23.3%Bottled, tank, or LP gas
20.0%Fuel oil, kerosene, etc.
5.0%Wood
3.6%Coal or coke
2.4%Utility gas
0.6%Solar energy
Population in 1990: 4,249. Population change in the 1990s: +1,071 (+25.2%).
Place of birth for U.S.-born residents:
This state: 5,801
Northeast: 175
Midwest: 107
South: 100
West: 54
72% of the 17519 zip code residents lived in the same house 5 years ago. Out of people who lived in different houses, 75% lived in this county. Out of people who lived in different counties, 50% lived in Pennsylvania.
91% of the 17519 zip code residents lived in the same house 1 year ago. Out of people who lived in different houses, 57% moved from this county. Out of people who lived in different houses, 12% moved from different county within same state. Out of people who lived in different houses, 29% moved from different state. Out of people who lived in different houses, 2% moved from abroad.
Private vs. public school enrollment:
Students in private schools in grades 1 to 8 (elementary and middle school): 531
Here:
74.0%
Pennsylvania:
15.7%
Students in private schools in grades 9 to 12 (high school): 108
Here:
34.2%
Pennsylvania:
13.4%
Students in private undergraduate colleges: 37
Here:
34.3%
Pennsylvania:
39.8%
Occupation by median earnings in the past 12 months ($)
120,850Construction and extraction occupations
83,048Computer and mathematical occupations
74,677Business and financial operations occupations
70,395Management occupations
67,355Installation, maintenance, and repair occupations
56,827Community and social service occupations
Top industries in this zip code by the number of employees in 2005:
Accommodation and Food Services: Limited-Service Restaurants (250-499 employees: 1 establishment)
Construction: Residential Remodelers (50-99: 1)
Fatal accident statistics in 2014:
Fatal accident count: 1
Vehicles involved in fatal accidents: 1
Fatal accidents caused by drunken drivers: 1
Fatalities: 1
Persons involved in fatal accidents: 1
Pedestrians involved in fatal accidents: 0
Fatal accident statistics in 2013:
Fatal accident count: 1
Vehicles involved in fatal accidents: 2
Fatal accidents caused by drunken drivers: 0
Fatalities: 1
Persons involved in fatal accidents: 2
Pedestrians involved in fatal accidents: 0
Home Mortgage Disclosure Act Aggregated Statistics For Year 2009 (Based on 6 partial tracts)
A) FHA, FSA/RHS & VA Home Purchase Loans
B) Conventional Home Purchase Loans
C) Refinancings
D) Home Improvement Loans
F) Non-occupant Loans on < 5 Family Dwellings (A B C & D)
G) Loans On Manufactured Home Dwelling (A B C & D)
Number
Average Value
Number
Average Value
Number
Average Value
Number
Average Value
Number
Average Value
Number
Average Value
LOANS ORIGINATED
17
$214,846
58
$168,724
230
$170,993
30
$76,367
13
$137,682
1
$72,890
APPLICATIONS APPROVED, NOT ACCEPTED
1
$247,060
5
$144,402
20
$150,022
4
$44,215
2
$219,150
4
$56,755
APPLICATIONS DENIED
5
$207,134
6
$175,382
55
$202,524
7
$28,164
1
$308,770
3
$15,800
APPLICATIONS WITHDRAWN
1
$200,940
4
$176,242
26
$168,197
2
$146,765
0
$0
1
$96,080
FILES CLOSED FOR INCOMPLETENESS
0
$0
0
$0
3
$205,697
0
$0
0
$0
0
$0
Aggregated Statistics For Year 2008 (Based on 6 partial tracts)
A) FHA, FSA/RHS & VA Home Purchase Loans
B) Conventional Home Purchase Loans
C) Refinancings
D) Home Improvement Loans
F) Non-occupant Loans on < 5 Family Dwellings (A B C & D)
G) Loans On Manufactured Home Dwelling (A B C & D)
Number
Average Value
Number
Average Value
Number
Average Value
Number
Average Value
Number
Average Value
Number
Average Value
LOANS ORIGINATED
17
$182,496
77
$179,170
141
$149,117
43
$56,132
15
$144,639
5
$73,426
APPLICATIONS APPROVED, NOT ACCEPTED
0
$0
5
$225,908
12
$135,991
5
$29,882
2
$97,915
2
$56,060
APPLICATIONS DENIED
3
$150,233
8
$97,712
48
$193,015
14
$57,251
1
$133,220
7
$81,760
APPLICATIONS WITHDRAWN
0
$0
7
$244,533
18
$192,546
2
$56,085
1
$106,170
0
$0
FILES CLOSED FOR INCOMPLETENESS
0
$0
3
$120,130
7
$198,301
0
$0
0
$0
1
$96,080
Aggregated Statistics For Year 2007 (Based on 6 partial tracts)
A) FHA, FSA/RHS & VA Home Purchase Loans
B) Conventional Home Purchase Loans
C) Refinancings
D) Home Improvement Loans
F) Non-occupant Loans on < 5 Family Dwellings (A B C & D)
G) Loans On Manufactured Home Dwelling (A B C & D)
Number
Average Value
Number
Average Value
Number
Average Value
Number
Average Value
Number
Average Value
Number
Average Value
LOANS ORIGINATED
14
$183,813
143
$166,343
123
$143,011
57
$56,160
20
$151,866
11
$70,098
APPLICATIONS APPROVED, NOT ACCEPTED
1
$353,130
20
$158,970
16
$217,531
7
$39,607
3
$151,633
2
$21,935
APPLICATIONS DENIED
0
$0
15
$101,075
66
$170,575
21
$71,824
6
$100,527
8
$57,072
APPLICATIONS WITHDRAWN
0
$0
7
$141,711
42
$195,521
1
$114,660
2
$116,345
1
$152,010
FILES CLOSED FOR INCOMPLETENESS
0
$0
4
$269,332
6
$163,255
0
$0
0
$0
0
$0
Aggregated Statistics For Year 2006 (Based on 6 partial tracts)
A) FHA, FSA/RHS & VA Home Purchase Loans
B) Conventional Home Purchase Loans
C) Refinancings
D) Home Improvement Loans
E) Loans on Dwellings For 5+ Families
F) Non-occupant Loans on < 5 Family Dwellings (A B C & D)
G) Loans On Manufactured Home Dwelling (A B C & D)
Number
Average Value
Number
Average Value
Number
Average Value
Number
Average Value
Number
Average Value
Number
Average Value
Number
Average Value
LOANS ORIGINATED
15
$178,886
173
$158,052
167
$124,037
71
$47,038
0
$0
22
$195,538
5
$43,010
APPLICATIONS APPROVED, NOT ACCEPTED
0
$0
14
$128,751
21
$174,629
10
$27,528
0
$0
3
$200,170
3
$70,817
APPLICATIONS DENIED
0
$0
21
$171,803
62
$185,493
24
$123,173
0
$0
3
$130,620
4
$64,257
APPLICATIONS WITHDRAWN
0
$0
16
$172,020
52
$170,722
6
$61,768
1
$339,400
4
$155,588
0
$0
FILES CLOSED FOR INCOMPLETENESS
1
$177,190
2
$168,825
10
$342,583
1
$83,680
0
$0
1
$224,600
0
$0
Aggregated Statistics For Year 2005 (Based on 6 partial tracts)
A) FHA, FSA/RHS & VA Home Purchase Loans
B) Conventional Home Purchase Loans
C) Refinancings
D) Home Improvement Loans
F) Non-occupant Loans on < 5 Family Dwellings (A B C & D)
G) Loans On Manufactured Home Dwelling (A B C & D)
Number
Average Value
Number
Average Value
Number
Average Value
Number
Average Value
Number
Average Value
Number
Average Value
LOANS ORIGINATED
5
$127,316
136
$147,693
167
$116,160
62
$83,797
32
$218,037
6
$58,662
APPLICATIONS APPROVED, NOT ACCEPTED
0
$0
14
$516,596
25
$108,374
4
$39,025
3
$1,839,267
1
$234,310
APPLICATIONS DENIED
0
$0
12
$135,000
63
$160,243
12
$44,824
1
$80,590
7
$32,439
APPLICATIONS WITHDRAWN
0
$0
4
$168,408
63
$158,333
8
$158,336
0
$0
0
$0
FILES CLOSED FOR INCOMPLETENESS
0
$0
1
$102,650
10
$202,328
0
$0
0
$0
0
$0
Aggregated Statistics For Year 2004 (Based on 6 partial tracts)
A) FHA, FSA/RHS & VA Home Purchase Loans
B) Conventional Home Purchase Loans
C) Refinancings
D) Home Improvement Loans
F) Non-occupant Loans on < 5 Family Dwellings (A B C & D)
G) Loans On Manufactured Home Dwelling (A B C & D)
Number
Average Value
Number
Average Value
Number
Average Value
Number
Average Value
Number
Average Value
Number
Average Value
LOANS ORIGINATED
5
$102,846
91
$144,255
206
$111,299
45
$42,961
12
$121,538
7
$38,104
APPLICATIONS APPROVED, NOT ACCEPTED
0
$0
10
$100,946
23
$130,217
5
$37,326
0
$0
2
$49,960
APPLICATIONS DENIED
0
$0
10
$110,078
83
$135,482
15
$112,113
6
$70,762
9
$40,003
APPLICATIONS WITHDRAWN
0
$0
10
$101,924
88
$142,146
5
$24,132
4
$93,712
2
$49,910
FILES CLOSED FOR INCOMPLETENESS
0
$0
2
$86,415
11
$157,430
2
$68,000
0
$0
0
$0
Aggregated Statistics For Year 2003 (Based on 6 partial tracts)
A) FHA, FSA/RHS & VA Home Purchase Loans
B) Conventional Home Purchase Loans
C) Refinancings
D) Home Improvement Loans
F) Non-occupant Loans on < 5 Family Dwellings (A B C & D)
Number
Average Value
Number
Average Value
Number
Average Value
Number
Average Value
Number
Average Value
LOANS ORIGINATED
5
$141,846
99
$113,071
369
$104,488
47
$25,967
15
$90,699
APPLICATIONS APPROVED, NOT ACCEPTED
0
$0
7
$139,539
38
$129,114
9
$59,758
0
$0
APPLICATIONS DENIED
0
$0
10
$55,486
82
$110,805
12
$18,409
3
$71,937
APPLICATIONS WITHDRAWN
0
$0
5
$132,240
60
$123,721
4
$70,142
2
$133,430
FILES CLOSED FOR INCOMPLETENESS
0
$0
0
$0
12
$123,741
1
$34,770
0
$0
Aggregated Statistics For Year 2002 (Based on 6 partial tracts)
A) FHA, FSA/RHS & VA Home Purchase Loans
B) Conventional Home Purchase Loans
C) Refinancings
D) Home Improvement Loans
F) Non-occupant Loans on < 5 Family Dwellings (A B C & D)
Number
Average Value
Number
Average Value
Number
Average Value
Number
Average Value
Number
Average Value
LOANS ORIGINATED
7
$122,860
120
$107,945
216
$104,048
53
$28,940
18
$74,632
APPLICATIONS APPROVED, NOT ACCEPTED
2
$117,915
14
$84,292
34
$100,410
12
$27,740
2
$64,730
APPLICATIONS DENIED
0
$0
12
$54,020
63
$109,107
11
$24,799
0
$0
APPLICATIONS WITHDRAWN
2
$108,860
8
$98,229
45
$123,114
1
$30,910
2
$86,715
FILES CLOSED FOR INCOMPLETENESS
0
$0
1
$110,960
5
$63,248
0
$0
0
$0
Aggregated Statistics For Year 2001 (Based on 6 partial tracts)
A) FHA, FSA/RHS & VA Home Purchase Loans
B) Conventional Home Purchase Loans
C) Refinancings
D) Home Improvement Loans
E) Loans on Dwellings For 5+ Families
F) Non-occupant Loans on < 5 Family Dwellings (A B C & D)
Number
Average Value
Number
Average Value
Number
Average Value
Number
Average Value
Number
Average Value
Number
Average Value
LOANS ORIGINATED
19
$101,937
112
$94,229
149
$93,121
47
$33,872
1
$205,010
6
$67,917
APPLICATIONS APPROVED, NOT ACCEPTED
1
$126,030
11
$45,563
27
$92,965
5
$50,280
0
$0
2
$74,050
APPLICATIONS DENIED
1
$119,790
35
$39,157
40
$79,782
16
$15,680
0
$0
3
$28,137
APPLICATIONS WITHDRAWN
1
$160,970
6
$96,793
37
$111,469
3
$16,193
0
$0
1
$59,020
FILES CLOSED FOR INCOMPLETENESS
0
$0
2
$83,340
3
$146,297
0
$0
0
$0
0
$0
Aggregated Statistics For Year 2000 (Based on 6 partial tracts)
A) FHA, FSA/RHS & VA Home Purchase Loans
B) Conventional Home Purchase Loans
C) Refinancings
D) Home Improvement Loans
F) Non-occupant Loans on < 5 Family Dwellings (A B C & D)
Number
Average Value
Number
Average Value
Number
Average Value
Number
Average Value
Number
Average Value
LOANS ORIGINATED
12
$113,232
110
$95,577
43
$84,617
47
$23,410
15
$67,605
APPLICATIONS APPROVED, NOT ACCEPTED
0
$0
17
$53,100
7
$55,693
11
$31,352
0
$0
APPLICATIONS DENIED
0
$0
36
$45,350
33
$66,076
12
$31,455
1
$52,670
APPLICATIONS WITHDRAWN
0
$0
5
$148,320
17
$105,605
4
$52,828
0
$0
FILES CLOSED FOR INCOMPLETENESS
0
$0
1
$143,840
2
$88,285
0
$0
0
$0
Aggregated Statistics For Year 1999 (Based on 3 partial tracts)
A) FHA, FSA/RHS & VA Home Purchase Loans
B) Conventional Home Purchase Loans
C) Refinancings
D) Home Improvement Loans
F) Non-occupant Loans on < 5 Family Dwellings (A B C & D)
2002 - 2018 National Fire Incident Reporting System (NFIRS) incidents
According to the data from the years 2002 - 2018 the average number of fire incidents per year is 15. The highest number of reported fire incidents - 36 took place in 2017, and the least - 3 in 2003. The data has an increasing trend.
When looking into fire subcategories, the most reports belonged to: Structure Fires (65.9%), and Outside Fires (19.6%).
Fire incident types reported to NFIRS in Zip Code 17519


 Nearest zip codes: 17581, 17507, 17557, 17555, 19540, 19501.


 According to the data from the years 2002 - 2018 the average number of fire incidents per year is 15. The highest number of reported fire incidents - 36 took place in 2017, and the least - 3 in 2003. The data has an increasing trend.
 When looking into fire subcategories, the most reports belonged to: Structure Fires (65.9%), and Outside Fires (19.6%).