Races in Upton-West Upton, Massachusetts (MA) Detailed Stats
Ancestries, Foreign-born residents, place of birth

Discuss Upton-West Upton, Massachusetts races on our local forum with over 2,400,000 registered users
1.4% of Upton-West Upton, MA residents are foreign-born , which is 1208.4% less than the foreign-born rate of 18.0% across the entire state of Massachusetts.
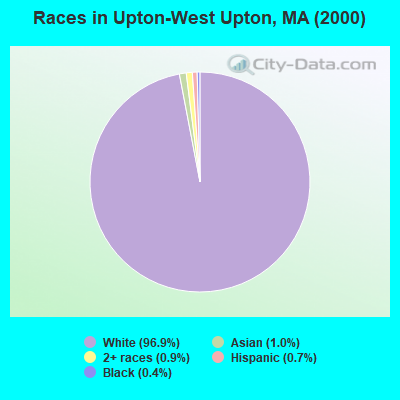
Race distribution in Upton-West Upton

- 2,25396.9%White alone
- 241.0%Asian alone
- 200.9%Two or more races
- 160.7%Hispanic
- 100.4%Black alone
- 20.09%Other race alone
- 10.04%American Indian alone
2000
2022
-
- 5,198,35981.9%White alone
- 428,7296.8%Hispanic
- 318,3295.0%Black alone
- 236,7863.7%Asian alone
- 110,3381.7%Two or more races
- 43,5860.7%Other race alone
- 11,2640.2%American Indian alone
- 1,7060.03%Native Hawaiian and Other
Pacific Islander alone

-
- 4,676,62767.0%White alone
- 911,03813.0%Hispanic
- 501,4637.2%Asian alone
- 459,7406.6%Black alone
- 341,8894.9%Two or more races
- 84,4031.2%Other race alone
- 5,8380.08%American Indian alone
- 9760.01%Native Hawaiian and Other
Pacific Islander alone

Income and house value in Upton-West Upton
- Median household income in 2022
- $116,856White non-Hispanic householders
- $167,440American Indian and Alaska Native householders
- $20,781Two or more races householders
- $108,616Hispanic or Latino race householders
- Median 2022 house value
- $589,595White Non-Hispanic householders
- $448,755American Indian or Alaska Native householders
- $448,755Hispanic or Latino householders
Household income for White non-Hispanic householders

Household income for American Indian and Alaska Native householders

Household income for Two or more races householders

Household income for Hispanic or Latino race householders

Foreign-born residents in Upton-West Upton
32 residents are foreign born
| This city: | 1.4% |
| Massachusetts: | 12.2% |
Ancestries in Upton-West Upton

- 61621.0%Irish
- 39513.5%English
- 38413.1%French
- 35512.1%Italian
- 2137.3%Other
- 1886.4%United States
- 1705.8%German
- 1143.9%French Canadian
- 1003.4%Polish
- 923.1%Scottish
- 692.4%Swedish
- 511.7%Lithuanian
- 471.6%Scotch-Irish
- 220.7%Norwegian
- 210.7%Russian
- 200.7%Danish
- 200.7%Hungarian
- 150.5%Greek
- 150.5%Ukrainian
- 110.4%Dutch
- 100.3%Portuguese
- 70.2%Welsh

Zip codes: 01568.