Races in Thornton, New Hampshire (NH) Detailed Stats
Ancestries, Foreign-born residents, place of birth

Recent posts about races in Thornton, New Hampshire on our local forum with over 2,400,000 registered users:
 | Septic and house inspection, Grafton County (6 replies) |
| Political climate in Portsmouth area (53 replies) |
| Second property on land near White Mountains (20 replies) |
| Right of way? (7 replies) |
| Over charging for electric? (9 replies) |
| New Hampshire mountains...or Vermont? (18 replies) |
Latest news about races in Thornton, NH collected exclusively by city-data.com from local newspapers, TV, and radio stations
2.2% of Thornton, NH residents are foreign-born (1.4% born in Europe, 0.5% born in Latin America, 0.3% born in Asia), which is 124.8% less than the foreign-born rate of 5.0% across the entire state of New Hampshire.
Race distribution in Thornton

- 1,79597.4%White alone
- 221.2%Two or more races
- 130.7%Hispanic
- 50.3%Asian alone
- 50.3%Black alone
- 20.1%American Indian alone
- 10.05%Native Hawaiian and Other
Pacific Islander alone

2000
2022
-
- 1,175,25295.1%White alone
- 20,4891.7%Hispanic
- 15,8031.3%Asian alone
- 11,6060.9%Two or more races
- 8,3540.7%Black alone
- 2,6980.2%American Indian alone
- 1,2540.1%Other race alone
- 3300.03%Native Hawaiian and Other
Pacific Islander alone

-
- 1,208,10186.6%White alone
- 63,4794.5%Hispanic
- 60,7244.4%Two or more races
- 36,5192.6%Asian alone
- 17,9311.3%Black alone
- 6,6150.5%Other race alone
- 1,0140.07%American Indian alone
- 8480.06%Native Hawaiian and Other
Pacific Islander alone

Income and house value in Thornton
- Median household income in 2022
- $74,187White non-Hispanic householders
- $88,245Asian householders
- $89,822Two or more races householders
- $198,591Hispanic or Latino race householders
- Median 2022 house value
- $341,037White Non-Hispanic householders
- $359,575Asian householders
- $303,641Two or more races householders
Household income for White non-Hispanic householders

Household income for Asian householders

Household income for Two or more races householders

Household income for Hispanic or Latino race householders

Foreign-born residents in Thornton
41 residents are foreign born (1.4% Europe, 0.5% Latin America, 0.3% Asia).
| This city: | 2.2% |
| New Hampshire: | 4.4% |
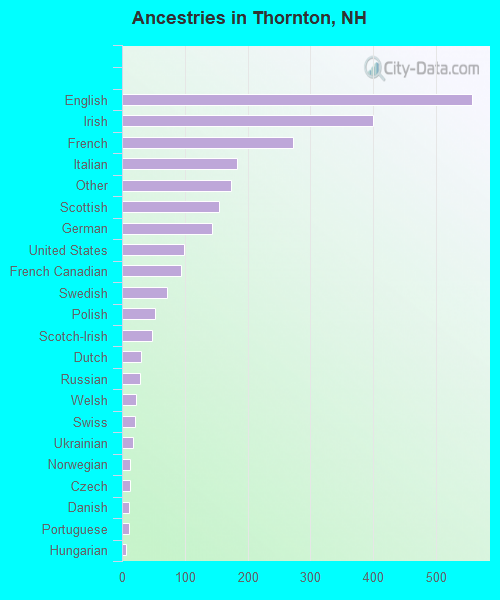
Ancestries in Thornton

- 55723.0%English
- 40016.5%Irish
- 27311.3%French
- 1837.5%Italian
- 1737.1%Other
- 1556.4%Scottish
- 1445.9%German
- 994.1%United States
- 943.9%French Canadian
- 712.9%Swedish
- 532.2%Polish
- 482.0%Scotch-Irish
- 301.2%Dutch
- 281.2%Russian
- 220.9%Welsh
- 210.9%Swiss
- 180.7%Ukrainian
- 130.5%Norwegian
- 120.5%Czech
- 110.5%Danish
- 110.5%Portuguese
- 70.3%Hungarian
- 20.08%Lithuanian
Zip codes: 03223.