Races in Northeast Wharton, Texas (TX) Detailed Stats
Ancestries, Foreign-born residents, place of birth
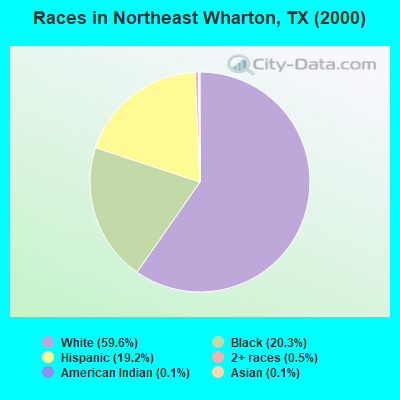
Race distribution in Northeast Wharton

- 3,64359.6%White alone
- 1,24120.3%Black alone
- 1,17419.2%Hispanic
- 290.5%Two or more races
- 90.1%Asian alone
- 90.1%American Indian alone
- 40.07%Other race alone
- 10.02%Native Hawaiian and Other
Pacific Islander alone
2000
2022
-
- 10,933,31352.4%White alone
- 6,669,66632.0%Hispanic
- 2,364,25511.3%Black alone
- 554,4452.7%Asian alone
- 230,5671.1%Two or more races
- 68,8590.3%American Indian alone
- 19,9580.10%Other race alone
- 10,7570.05%Native Hawaiian and Other
Pacific Islander alone

-
- 12,070,64240.2%Hispanic
- 11,683,43038.9%White alone
- 3,508,70611.7%Black alone
- 1,608,1735.4%Asian alone
- 956,5603.2%Two or more races
- 125,7630.4%Other race alone
- 47,0230.2%American Indian alone
- 29,2750.10%Native Hawaiian and Other
Pacific Islander alone

Income and house value in Northeast Wharton
- Median household income in 2022
- $80,467White non-Hispanic householders
- $65,974Black householders
- $49,065Some other race householders
- $93,340Two or more races householders
- $67,996Hispanic or Latino race householders
- Median 2022 house value
- $254,455White Non-Hispanic householders
- $103,448Black or African American householders
- $34,710Some other race householders
- $95,464Two or more races householders
- $91,992Hispanic or Latino householders
Household income for White non-Hispanic householders

Household income for Black householders

Household income for Two or more races householders

Household income for Hispanic or Latino race householders

Zip code: 77435