Races in Detroit, Michigan (MI) Detailed Stats
Data:
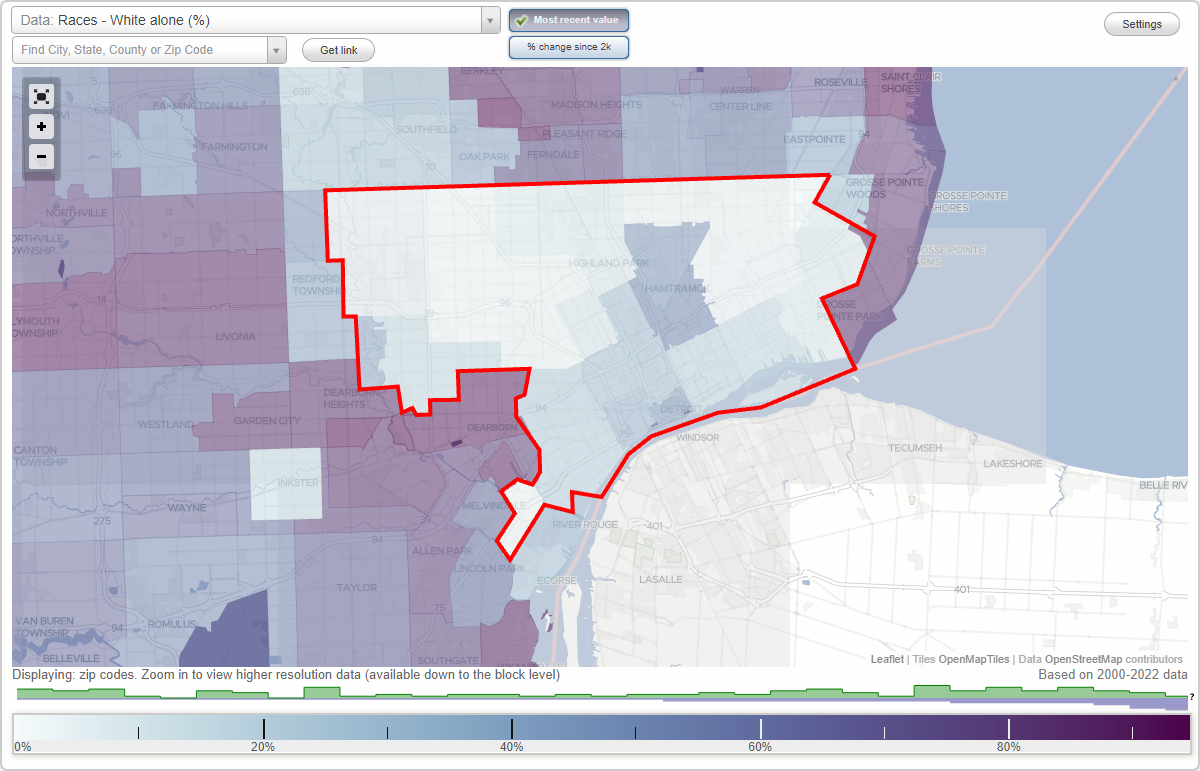
Races - White alone (%)
Races - White alone (% change since 2000)
Races - Black alone (%)
Races - Black alone (% change since 2000)
Races - American Indian alone (%)
Races - American Indian alone (% change since 2000)
Races - Asian alone (%)
Races - Asian alone (% change since 2000)
Races - Hispanic (%)
Races - Hispanic (% change since 2000)
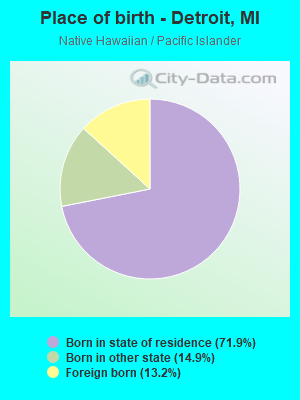
Races - Native Hawaiian and Other Pacific Islander alone (%)
Races - Native Hawaiian and Other Pacific Islander alone (% change since 2000)
Races - Two or more races(%)
Races - Two or more races(% change since 2000)
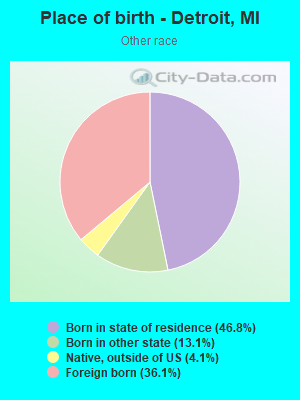
Races - Other race alone (%)
Races - Other race alone (% change since 2000)
Racial diversity
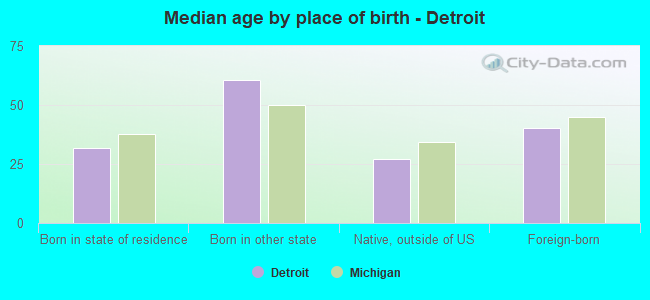
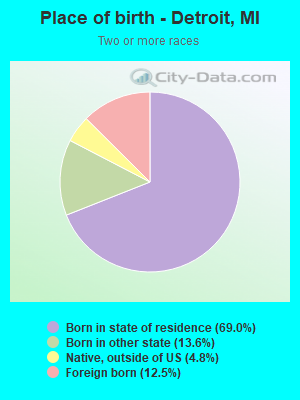
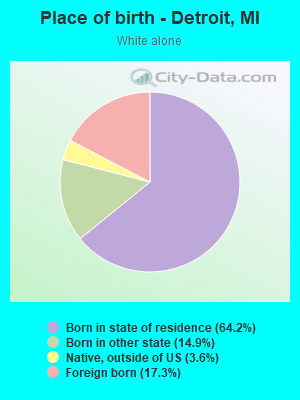
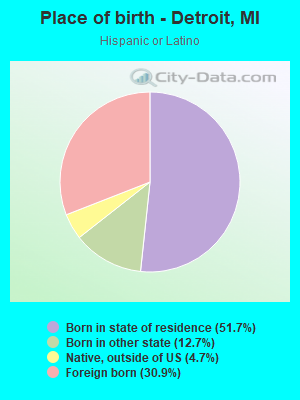
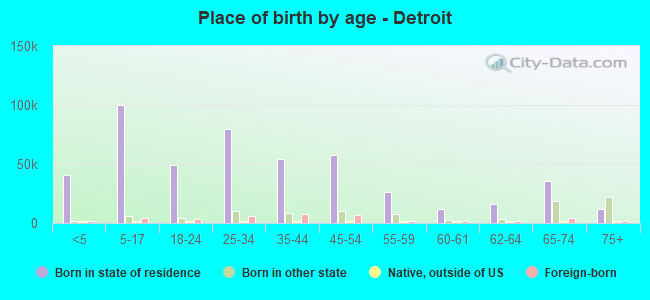
Place of birth - Born in state of residence (%)
Place of birth - Born in state of residence (%) - White
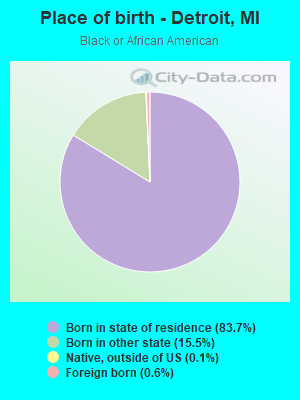
Place of birth - Born in state of residence (%) - Black or African American
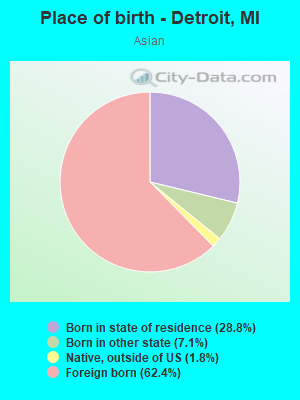
Place of birth - Born in state of residence (%) - Asian
Place of birth - Born in state of residence (%) - Hispanic or Latino
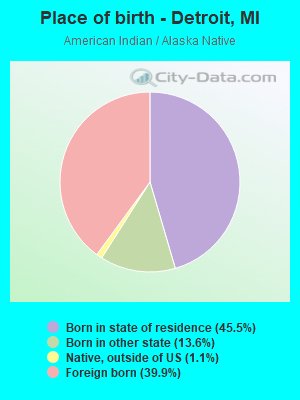
Place of birth - Born in state of residence (%) - American Indian and Alaska Native
Place of birth - Born in state of residence (%) - Multirace
Place of birth - Born in state of residence (%) - Other Race
Place of birth - Born in other state (%)
Place of birth - Born in other state (%) - White
Place of birth - Born in other state (%) - Black or African American
Place of birth - Born in other state (%) - Asian
Place of birth - Born in other state (%) - Hispanic or Latino
Place of birth - Born in other state (%) - American Indian and Alaska Native
Place of birth - Born in other state (%) - Multirace
Place of birth - Born in other state (%) - Other Race
Place of birth - Native, outside of US (%)
Place of birth - Native, outside of US (%) - White
Place of birth - Native, outside of US (%) - Black or African American
Place of birth - Native, outside of US (%) - Asian
Place of birth - Native, outside of US (%) - Hispanic or Latino
Place of birth - Native, outside of US (%) - American Indian and Alaska Native
Place of birth - Native, outside of US (%) - Multirace
Place of birth - Native, outside of US (%) - Other Race
Place of birth - Foreign born (%)
Place of birth - Foreign born (%) - White
Place of birth - Foreign born (%) - Black or African American
Place of birth - Foreign born (%) - Asian
Place of birth - Foreign born (%) - Hispanic or Latino
Place of birth - Foreign born (%) - American Indian and Alaska Native
Place of birth - Foreign born (%) - Multirace
Place of birth - Foreign born (%) - Other Race
Residents speaking English at home (%)
Residents speaking English at home - Born in the United States (%)
Residents speaking English at home - Native, born elsewhere (%)
Residents speaking English at home - Foreign born (%)
Residents speaking Spanish at home (%)
Residents speaking Spanish at home - Born in the United States (%)
Residents speaking Spanish at home - Native, born elsewhere (%)
Residents speaking Spanish at home - Foreign born (%)
Residents speaking other language at home (%)
Residents speaking other language at home - Born in the United States (%)
Residents speaking other language at home - Native, born elsewhere (%)
Residents speaking other language at home - Foreign born (%)
Marital status - Never married (%)
Marital status - Now married (%)
Marital status - Separated (%)
Marital status - Widowed (%)
Marital status - Divorced (%)
Ancestries Reported - Arab (%)
Ancestries Reported - Czech (%)
Ancestries Reported - Danish (%)
Ancestries Reported - Dutch (%)
Ancestries Reported - English (%)
Ancestries Reported - French (%)
Ancestries Reported - French Canadian (%)
Ancestries Reported - German (%)
Ancestries Reported - Greek (%)
Ancestries Reported - Hungarian (%)
Ancestries Reported - Irish (%)
Ancestries Reported - Italian (%)
Ancestries Reported - Lithuanian (%)
Ancestries Reported - Norwegian (%)
Ancestries Reported - Polish (%)
Ancestries Reported - Portuguese (%)
Ancestries Reported - Russian (%)
Ancestries Reported - Scotch-Irish (%)
Ancestries Reported - Scottish (%)
Ancestries Reported - Slovak (%)
Ancestries Reported - Subsaharan African (%)
Ancestries Reported - Swedish (%)
Ancestries Reported - Swiss (%)
Ancestries Reported - Ukrainian (%)
Ancestries Reported - United States (%)
Ancestries Reported - Welsh (%)
Ancestries Reported - West Indian (%)
Ancestries Reported - Other (%)
Geographical mobility - Same house 1 year ago (%)
Geographical mobility - Same house 1 year ago (%) - White
Geographical mobility - Same house 1 year ago (%) - Black or African American
Geographical mobility - Same house 1 year ago (%) - Asian
Geographical mobility - Same house 1 year ago (%) - Hispanic or Latino
Geographical mobility - Same house 1 year ago (%) - American Indian and Alaska Native
Geographical mobility - Same house 1 year ago (%) - Multirace
Geographical mobility - Same house 1 year ago (%) - Other Race
Geographical mobility - Moved within same county (%)
Geographical mobility - Moved within same county (%) - White
Geographical mobility - Moved within same county (%) - Black or African American
Geographical mobility - Moved within same county (%) - Asian
Geographical mobility - Moved within same county (%) - Hispanic or Latino
Geographical mobility - Moved within same county (%) - American Indian and Alaska Native
Geographical mobility - Moved within same county (%) - Multirace
Geographical mobility - Moved within same county (%) - Other Race
Geographical mobility - Moved from different county within same state (%)
Geographical mobility - Moved from different county within same state (%) - White
Geographical mobility - Moved from different county within same state (%) - Black or African American
Geographical mobility - Moved from different county within same state (%) - Asian
Geographical mobility - Moved from different county within same state (%) - Hispanic or Latino
Geographical mobility - Moved from different county within same state (%) - American Indian and Alaska Native
Geographical mobility - Moved from different county within same state (%) - Multirace
Geographical mobility - Moved from different county within same state (%) - Other Race
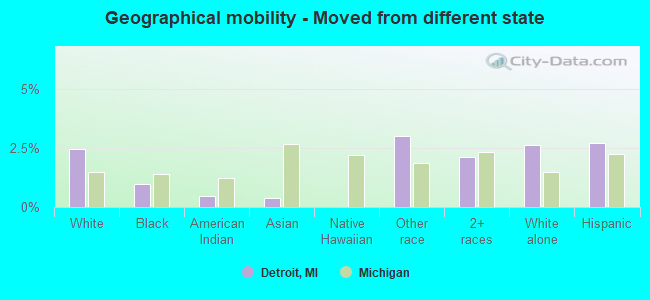
Geographical mobility - Moved from different state (%)
Geographical mobility - Moved from different state (%) - White
Geographical mobility - Moved from different state (%) - Black or African American
Geographical mobility - Moved from different state (%) - Asian
Geographical mobility - Moved from different state (%) - Hispanic or Latino
Geographical mobility - Moved from different state (%) - American Indian and Alaska Native
Geographical mobility - Moved from different state (%) - Multirace
Geographical mobility - Moved from different state (%) - Other Race
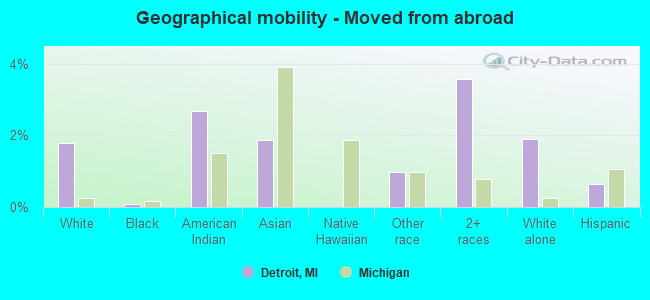
Geographical mobility - Moved from abroad (%)
Geographical mobility - Moved from abroad (%) - White
Geographical mobility - Moved from abroad (%) - Black or African American
Geographical mobility - Moved from abroad (%) - Asian
Geographical mobility - Moved from abroad (%) - Hispanic or Latino
Geographical mobility - Moved from abroad (%) - American Indian and Alaska Native
Geographical mobility - Moved from abroad (%) - Multirace
Geographical mobility - Moved from abroad (%) - Other Race
Place of birth for the foreign-born population - Ireland (%)
Place of birth for the foreign-born population - Denmark (%)
Place of birth for the foreign-born population - Norway (%)
Place of birth for the foreign-born population - Sweden (%)
Place of birth for the foreign-born population - United Kingdom (%)
Place of birth for the foreign-born population - England (%)
Place of birth for the foreign-born population - Scotland (%)
Place of birth for the foreign-born population - Other Northern Europe (%)
Place of birth for the foreign-born population - Austria (%)
Place of birth for the foreign-born population - Belgium (%)
Place of birth for the foreign-born population - France (%)
Place of birth for the foreign-born population - Germany (%)
Place of birth for the foreign-born population - Netherlands (%)
Place of birth for the foreign-born population - Switzerland (%)
Place of birth for the foreign-born population - Other Western Europe (%)
Place of birth for the foreign-born population - Greece (%)
Place of birth for the foreign-born population - Italy (%)
Place of birth for the foreign-born population - Portugal (%)
Place of birth for the foreign-born population - Spain (%)
Place of birth for the foreign-born population - Other Southern Europe (%)
Place of birth for the foreign-born population - Albania (%)
Place of birth for the foreign-born population - Belarus (%)
Place of birth for the foreign-born population - Bosnia and Herzegovina (%)
Place of birth for the foreign-born population - Bulgaria (%)
Place of birth for the foreign-born population - Croatia (%)
Place of birth for the foreign-born population - Czechoslovakia (%)
Place of birth for the foreign-born population - Hungary (%)
Place of birth for the foreign-born population - Latvia (%)
Place of birth for the foreign-born population - Lithuania (%)
Place of birth for the foreign-born population - North Macedonia (Macedonia) (%)
Place of birth for the foreign-born population - Moldova (%)
Place of birth for the foreign-born population - Poland (%)
Place of birth for the foreign-born population - Romania (%)
Place of birth for the foreign-born population - Russia (%)
Place of birth for the foreign-born population - Serbia (%)
Place of birth for the foreign-born population - Ukraine (%)
Place of birth for the foreign-born population - Other Eastern Europe (%)
Place of birth for the foreign-born population - China (%)
Place of birth for the foreign-born population - Hong Kong (%)
Place of birth for the foreign-born population - Taiwan (%)
Place of birth for the foreign-born population - Japan (%)
Place of birth for the foreign-born population - Korea (%)
Place of birth for the foreign-born population - Other Eastern Asia (%)
Place of birth for the foreign-born population - Afghanistan (%)
Place of birth for the foreign-born population - Bangladesh (%)
Place of birth for the foreign-born population - India (%)
Place of birth for the foreign-born population - Iran (%)
Place of birth for the foreign-born population - Kazakhstan (%)
Place of birth for the foreign-born population - Nepal (%)
Place of birth for the foreign-born population - Pakistan (%)
Place of birth for the foreign-born population - Sri Lanka (%)
Place of birth for the foreign-born population - Uzbekistan (%)
Place of birth for the foreign-born population - Other South Central Asia (%)
Place of birth for the foreign-born population - Burma (%)
Place of birth for the foreign-born population - Cambodia (%)
Place of birth for the foreign-born population - Indonesia (%)
Place of birth for the foreign-born population - Laos (%)
Place of birth for the foreign-born population - Malaysia (%)
Place of birth for the foreign-born population - Philippines (%)
Place of birth for the foreign-born population - Singapore (%)
Place of birth for the foreign-born population - Thailand (%)
Place of birth for the foreign-born population - Vietnam (%)
Place of birth for the foreign-born population - Other South Eastern Asia (%)
Place of birth for the foreign-born population - Armenia (%)
Place of birth for the foreign-born population - Iraq (%)
Place of birth for the foreign-born population - Israel (%)
Place of birth for the foreign-born population - Jordan (%)
Place of birth for the foreign-born population - Kuwait (%)
Place of birth for the foreign-born population - Lebanon (%)
Place of birth for the foreign-born population - Saudi Arabia (%)
Place of birth for the foreign-born population - Syria (%)
Place of birth for the foreign-born population - Turkey (%)
Place of birth for the foreign-born population - Yemen (%)
Place of birth for the foreign-born population - Other Western Asia (%)
Place of birth for the foreign-born population - Eritrea (%)
Place of birth for the foreign-born population - Ethiopia (%)
Place of birth for the foreign-born population - Kenya (%)
Place of birth for the foreign-born population - Somalia (%)
Place of birth for the foreign-born population - Uganda (%)
Place of birth for the foreign-born population - Zimbabwe (%)
Place of birth for the foreign-born population - Other Eastern Africa (%)
Place of birth for the foreign-born population - Cameroon (%)
Place of birth for the foreign-born population - Congo (%)
Place of birth for the foreign-born population - Democratic Republic of Congo (Zaire) (%)
Place of birth for the foreign-born population - Other Middle Africa (%)
Place of birth for the foreign-born population - Egypt (%)
Place of birth for the foreign-born population - Morocco (%)
Place of birth for the foreign-born population - Sudan (%)
Place of birth for the foreign-born population - Other Northern Africa (%)
Place of birth for the foreign-born population - South Africa (%)
Place of birth for the foreign-born population - Other Southern Africa (%)
Place of birth for the foreign-born population - Cabo Verde (%)
Place of birth for the foreign-born population - Ghana (%)
Place of birth for the foreign-born population - Liberia (%)
Place of birth for the foreign-born population - Nigeria (%)
Place of birth for the foreign-born population - Senegal (%)
Place of birth for the foreign-born population - Sierra Leone (%)
Place of birth for the foreign-born population - Other Western Africa (%)
Place of birth for the foreign-born population - Australia (%)
Place of birth for the foreign-born population - New Zealand (%)
Place of birth for the foreign-born population - Fiji (%)
Place of birth for the foreign-born population - Micronesia (%)
Place of birth for the foreign-born population - Bahamas (%)
Place of birth for the foreign-born population - Barbados (%)
Place of birth for the foreign-born population - Cuba (%)
Place of birth for the foreign-born population - Dominica (%)
Place of birth for the foreign-born population - Dominican Republic (%)
Place of birth for the foreign-born population - Grenada (%)
Place of birth for the foreign-born population - Haiti (%)
Place of birth for the foreign-born population - Jamaica (%)
Place of birth for the foreign-born population - St. Vincent and the Grenadines (%)
Place of birth for the foreign-born population - Trinidad and Tobago (%)
Place of birth for the foreign-born population - West Indies (%)
Place of birth for the foreign-born population - Other Caribbean (%)
Place of birth for the foreign-born population - Belize (%)
Place of birth for the foreign-born population - Costa Rica (%)
Place of birth for the foreign-born population - El Salvador (%)
Place of birth for the foreign-born population - Guatemala (%)
Place of birth for the foreign-born population - Honduras (%)
Place of birth for the foreign-born population - Mexico (%)
Place of birth for the foreign-born population - Nicaragua (%)
Place of birth for the foreign-born population - Panama (%)
Place of birth for the foreign-born population - Other Central America (%)
Place of birth for the foreign-born population - Argentina (%)
Place of birth for the foreign-born population - Bolivia (%)
Place of birth for the foreign-born population - Brazil (%)
Place of birth for the foreign-born population - Chile (%)
Place of birth for the foreign-born population - Colombia (%)
Place of birth for the foreign-born population - Ecuador (%)
Place of birth for the foreign-born population - Guyana (%)
Place of birth for the foreign-born population - Peru (%)
Place of birth for the foreign-born population - Uruguay (%)
Place of birth for the foreign-born population - Venezuela (%)
Place of birth for the foreign-born population - Other South America (%)
Place of birth for the foreign-born population - Canada (%)
Place of birth for the foreign-born population - Other Northern America (%)
Place of birth for the foreign-born population - Other (%)
Latest news about races in Detroit, MI collected exclusively by city-data.com from local newspapers, TV, and radio stations
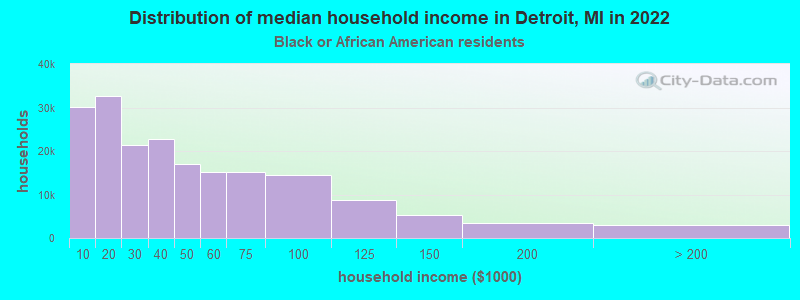
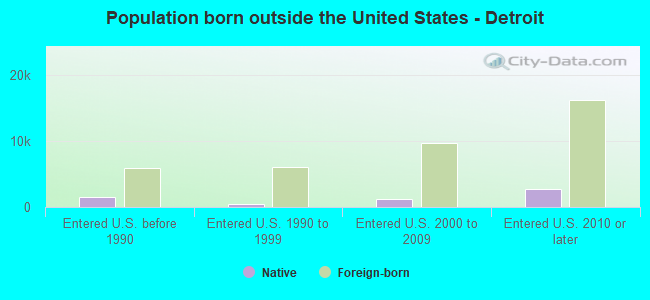
According to 2022 data, the most numerous races in Detroit, MI are White alone (67,192 residents), Black alone (473,149 residents), and Hispanic (43,543 residents). 88.7% of Detroit residents speak English at home. 5.7% of Detroit, MI residents are foreign-born (2.6% born in Latin America, 2.3% born in Asia), which is 4.9% less than the foreign-born rate of 6.0% across the entire state of Michigan.
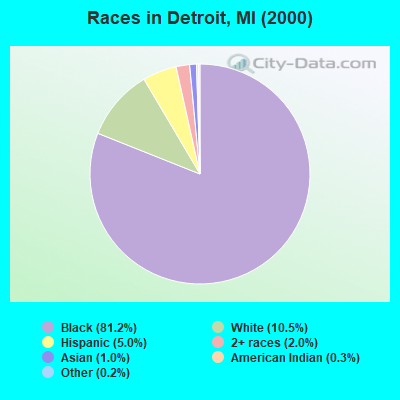
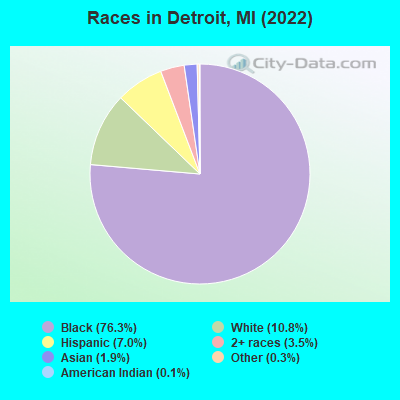
Race distribution in Detroit
2000 2022
771,966 81.2% Black alone 99,921 10.5% White alone 47,167 5.0% Hispanic 18,664 2.0% Two or more races 9,135 1.0% Asian alone 2,572 0.3% American Indian alone 1,676 0.2% Other race alone 169 0.02% Native Hawaiian and Other
473,149 76.3% Black alone 67,192 10.8% White alone 43,543 7.0% Hispanic 22,022 3.5% Two or more races 11,655 1.9% Asian alone 1,949 0.3% Other race alone 900 0.1% American Indian alone
2000 2022
7,806,691 78.6% White alone 1,402,047 14.1% Black alone 323,877 3.3% Hispanic 175,311 1.8% Asian alone 163,487 1.6% Two or more races 53,421 0.5% American Indian alone 11,465 0.1% Other race alone 2,145 0.02% Native Hawaiian and Other
7,289,051 72.6% White alone 1,310,464 13.1% Black alone 572,405 5.7% Hispanic 450,031 4.5% Two or more races 335,732 3.3% Asian alone 45,217 0.5% Other race alone 29,011 0.3% American Indian alone 2,207 0.02% Native Hawaiian and Other
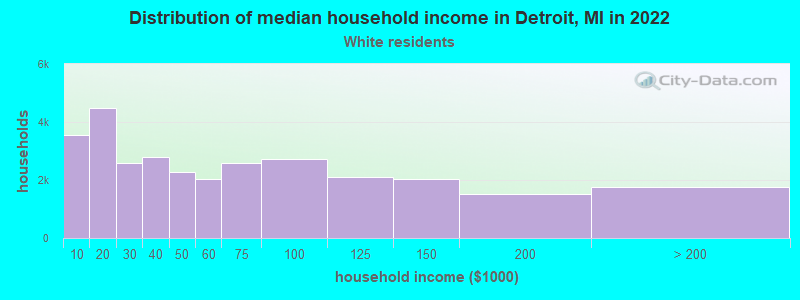
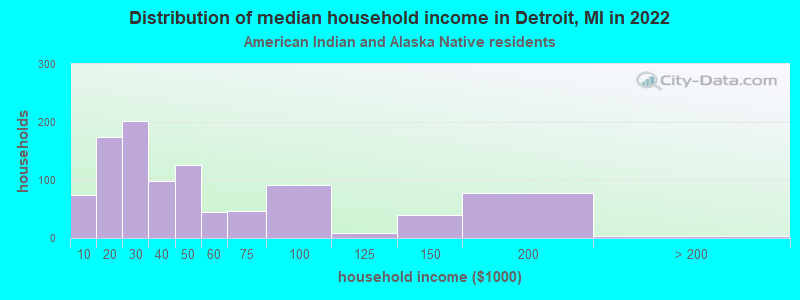
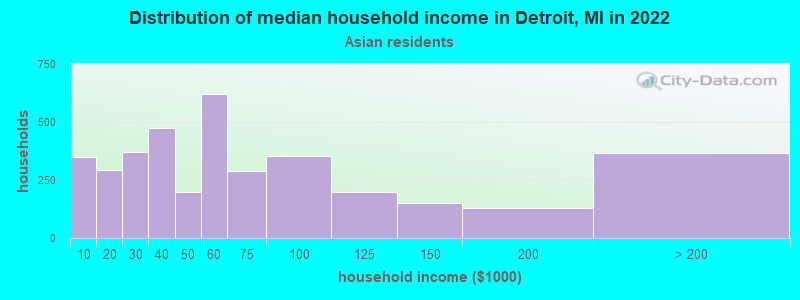
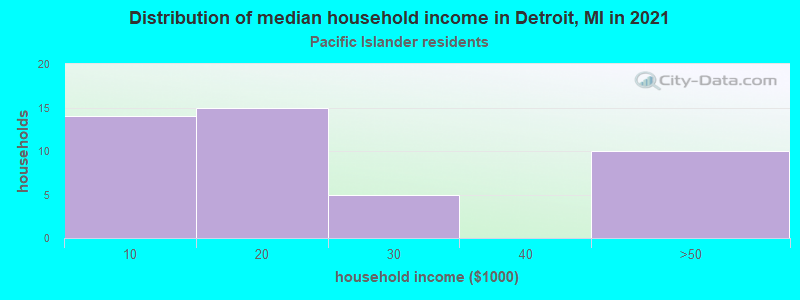
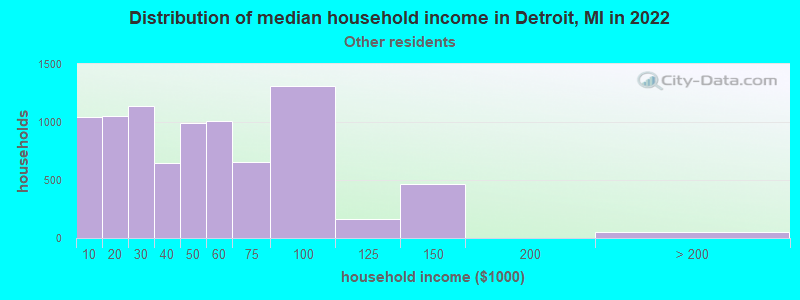
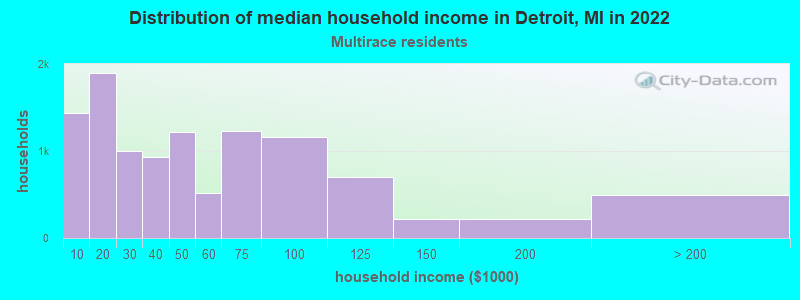
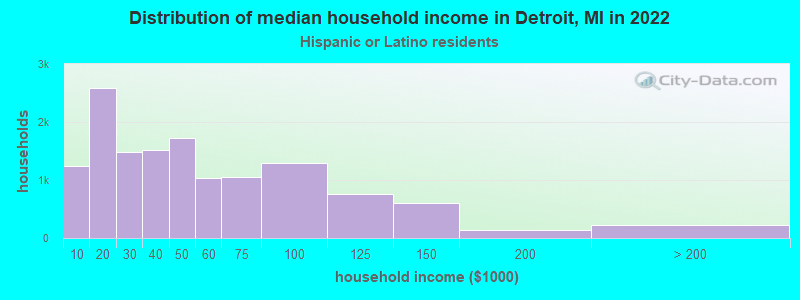
Income and house value in Detroit Median household income in 2022 $50,035 White non-Hispanic householders$34,844 Black householders$40,711 American Indian and Alaska Native householders$58,953 Asian householders$41,776 Some other race householders$41,411 Two or more races householders$39,878 Hispanic or Latino race householdersMedian 2022 house value $76,943 White Non-Hispanic householders$86,661 Black or African American householders$111,422 American Indian or Alaska Native householders $101,038 Asian householders$113,152 Native Hawaiian and other Pacific Islander householders$61,901 Some other race householders$87,726 Two or more races householders$60,836 Hispanic or Latino householders
Median age by race in Detroit
36.5 Median age for White residents37.8 35.2 36.6 Median age for Black or African American residents34.2 38.5 52.7 Median age for American Indian / Alaska Native residents57.0 37.8 30.9 Median age for Asian residents28.4 36.5 -666,666,666.0 Median age for Native Hawaiian / Pacific Islander residents-666,666,666.0 -666,666,666.0 29.5 Median age for Other race residents29.7 29.4 27.6 Median age for Two or more races residents26.7 30.5 37.4 Median age for White alone residents38.5 36.5 26.6 Median age for Hispanic or Latino residents26.8 26.2
Owner/renter occupied households by race in Detroit
House owners and renters - White residents 17,751 58.4% Owner occupied12,651 41.6% Renter occupiedHouse owners and renters - Black or African American residents 90,418 47.8% Owner occupied98,667 52.2% Renter occupiedHouse owners and renters - American Indian / Alaska Native residents 408 52.2% Owner occupied374 47.8% Renter occupiedHouse owners and renters - Asian residents 1,814 52.5% Owner occupied1,638 47.5% Renter occupiedHouse owners and renters - Native Hawaiian / Pacific Islander residents 2 8.2% Owner occupied26 91.8% Renter occupiedHouse owners and renters - Other race residents 4,982 58.5% Owner occupied3,534 41.5% Renter occupiedHouse owners and renters - Two or more races residents 5,647 51.3% Owner occupied5,359 48.7% Renter occupiedHouse owners and renters - White alone residents 16,913 58.7% Owner occupied11,898 41.3% Renter occupiedHouse owners and renters - Hispanic or Latino residents 7,433 54.4% Owner occupied6,223 45.6% Renter occupied
Language usage in Detroit
English speakers - Total 88.7% of residents of Detroit speak English at home.
5.8% of residents speak Spanish at home 19,341 57.5% Speak English very well14,291 42.5% Speak English less than very well5.5% of residents speak other language at home 14,284 44.7% Speak English very well17,648 55.3% Speak English less than very well
English speakers - Born in the United States 93.2% of residents of Detroit speak English at home.
4.9% of residents speak Spanish at home 3,576 78.2% Speak English very well996 21.8% Speak English less than very well1.9% of residents speak other language at home 1,368 78.2% Speak English very well382 21.8% Speak English less than very well
English speakers - Native, born elsewhere 40.7% of residents of Detroit speak English at home.
34.0% of residents speak Spanish at home 550 29.6% Speak English very well1,307 70.4% Speak English less than very well25.3% of residents speak other language at home 1,014 73.2% Speak English very well372 26.8% Speak English less than very well
English speakers - Foreign-born 14.2% of residents of Detroit speak English at home.
33.9% of residents speak Spanish at home 4,344 34.3% Speak English very well8,333 65.7% Speak English less than very well51.9% of residents speak other language at home 5,198 26.8% Speak English very well14,202 73.2% Speak English less than very well
White (Caucasian) - Speak only English Native:
85.5% (47,821)Foreign-born:
13.2% (1,643)
White (Caucasian) - Speak another language Native:
14.5% (8,082)Foreign-born:
86.8% (10,775)
Black or African American - Speak only English Native:
99.0% (434,532)Foreign-born:
44.0% (1,316)
Black or African American - Speak another language Native:
1.0% (4,262)Foreign-born:
56.0% (1,676)
American Indian / Alaska Native - Speak only English Native:
57.2% (794)Foreign-born:
9.7% (92)
American Indian / Alaska Native - Speak another language Native:
46.9% (651)Foreign-born:
76.5% (725)
Asian - Speak only English Native:
28.9% (1,190)Foreign-born:
19.7% (1,432)
Asian - Speak another language Native:
71.1% (2,925)Foreign-born:
80.3% (5,851)
Native Hawaiian / Pacific Islander - Speak only English Native:
99.5% (90)Foreign-born:
26.3% (3)
Other race - Speak only English Native:
19.2% (3,108)Foreign-born:
3.7% (369)
Other race - Speak another language Native:
80.8% (13,062)Foreign-born:
96.3% (9,701)
Two or more races - Speak only English Native:
80.1% (19,675)Foreign-born:
12.6% (478)
Two or more races - Speak another language Native:
19.9% (4,886)Foreign-born:
87.4% (3,317)
White alone - Speak only English Native:
87.9% (46,251)Foreign-born:
12.6% (1,428)
White alone - Speak another language Native:
12.1% (6,342)Foreign-born:
87.4% (9,924)
Hispanic or Latino - Speak only English Native:
32.2% (8,595)Foreign-born:
5.8% (770)
Hispanic or Latino - Speak another language Native:
67.8% (18,068)Foreign-born:
94.2% (12,606)
Foreign-born residents in Detroit 35,934 residents are foreign born (2.6% Latin America , 2.3% Asia ).
This city:
5.7%Michigan:
6.9%
Marital status for residents in Detroit Marital status - White (Caucasian) population 15 years and over
Males 53.0% Never married29.2% Now married3.6% Separated2.9% Widowed11.2% DivorcedFemales 46.3% Never married32.3% Now married2.1% Separated7.5% Widowed11.7% DivorcedWomen who gave birth in the past 12 months Now married:
63.0% (211)Unmarried:
37.0% (124)
Women who did not give birth in the past 12 months Now married:
32.0% (6,337)Unmarried:
68.0% (13,450)
Marital status - Black or African American population 15 years and over
Males 63.8% Never married18.9% Now married3.3% Separated3.7% Widowed10.3% DivorcedFemales 58.8% Never married16.4% Now married3.1% Separated10.1% Widowed11.6% DivorcedWomen who gave birth in the past 12 months Now married:
20.1% (1,284)Unmarried:
79.9% (5,102)
Women who did not give birth in the past 12 months Now married:
15.9% (17,452)Unmarried:
84.1% (92,062)
Marital status - American Indian / Alaska Native population 15 years and over
Males 34.6% Never married28.4% Now married5.5% Separated12.2% Widowed19.3% DivorcedFemales 36.8% Never married18.0% Now married5.4% Separated17.5% Widowed22.3% DivorcedWomen who gave birth in the past 12 months Now married:
0.0% (0)Unmarried:
100.0% (53)
Women who did not give birth in the past 12 months Now married:
25.6% (123)Unmarried:
74.4% (356)
Marital status - Asian population 15 years and over
Males 61.8% Never married38.2% Now married0.0% Separated0.0% Widowed0.0% DivorcedFemales 36.5% Never married51.2% Now married0.0% Separated7.7% Widowed4.6% DivorcedWomen who gave birth in the past 12 months Now married:
78.1% (164)Unmarried:
21.9% (46)
Women who did not give birth in the past 12 months Now married:
46.4% (1,460)Unmarried:
53.6% (1,689)
Marital status - Native Hawaiian / Pacific Islander population 15 years and over
Males 20.7% Never married37.9% Now married0.0% Separated0.0% Widowed41.4% DivorcedFemales 23.1% Never married0.0% Now married0.0% Separated0.0% Widowed76.9% DivorcedWomen who did not give birth in the past 12 months Now married:
0.0% (0)Unmarried:
100.0% (14)
Marital status - Other race population 15 years and over
Males 50.6% Never married39.6% Now married1.3% Separated1.4% Widowed7.1% DivorcedFemales 45.1% Never married42.3% Now married1.4% Separated7.0% Widowed4.2% DivorcedWomen who gave birth in the past 12 months Now married:
53.1% (255)Unmarried:
46.9% (225)
Women who did not give birth in the past 12 months Now married:
36.1% (2,438)Unmarried:
63.9% (4,320)
Marital status - Two or more races population 15 years and over
Males 58.0% Never married26.3% Now married1.6% Separated0.4% Widowed13.7% DivorcedFemales 51.3% Never married19.4% Now married2.9% Separated9.7% Widowed16.7% DivorcedWomen who gave birth in the past 12 months Now married:
67.6% (460)Unmarried:
32.4% (220)
Women who did not give birth in the past 12 months Now married:
20.7% (1,708)Unmarried:
79.3% (6,549)
Marital status - White alone, not Hispanic / Latino population 15 years and over
Males 52.1% Never married30.0% Now married3.8% Separated3.1% Widowed10.9% DivorcedFemales 45.6% Never married32.4% Now married1.9% Separated8.0% Widowed12.1% DivorcedWomen who gave birth in the past 12 months Now married:
70.6% (211)Unmarried:
29.4% (88)
Women who did not give birth in the past 12 months Now married:
31.5% (5,771)Unmarried:
68.5% (12,527)
Marital status - Hispanic or Latino population 15 years and over
Males 54.0% Never married35.9% Now married1.1% Separated0.9% Widowed8.1% DivorcedFemales 47.5% Never married39.0% Now married2.2% Separated3.8% Widowed7.4% DivorcedWomen who gave birth in the past 12 months Now married:
66.8% (715)Unmarried:
33.2% (355)
Women who did not give birth in the past 12 months Now married:
34.6% (3,706)Unmarried:
65.4% (7,012)
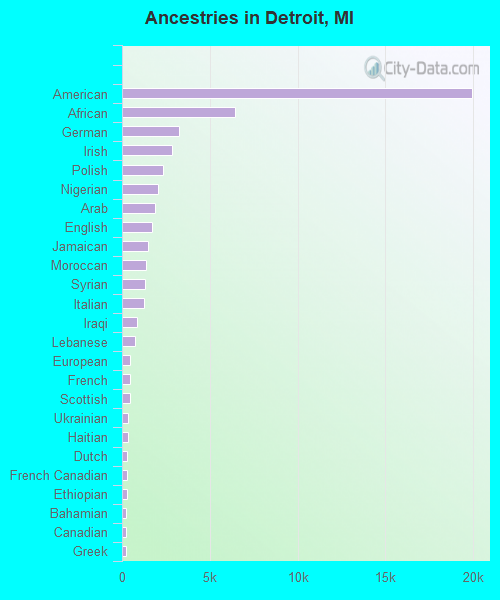
Ancestries in Detroit
19,904 4.4% American6,463 1.4% African3,241 0.7% German2,838 0.6% Irish2,309 0.5% Polish2,033 0.4% Nigerian1,891 0.4% Arab1,685 0.4% English1,509 0.3% Jamaican1,391 0.3% Moroccan1,318 0.3% Syrian1,248 0.3% Italian849 0.2% Iraqi712 0.2% Lebanese475 0.1% European446 0.10% French430 0.09% Scottish339 0.07% Ukrainian323 0.07% Haitian298 0.07% Dutch289 0.06% French Canadian265 0.06% Ethiopian241 0.05% Bahamian227 0.05% Canadian217 0.05% Greek213 0.05% Swedish210 0.05% Scotch-Irish120 0.03% Finnish114 0.03% Czech113 0.02% Norwegian110 0.02% Romanian107 0.02% British106 0.02% Iranian104 0.02% Hungarian101 0.02% Slovene99 0.02% Serbian98 0.02% Guyanese91 0.02% Senegalese91 0.02% Scandinavian86 0.02% Sudanese85 0.02% Albanian83 0.02% Somali79 0.02% Palestinian79 0.02% Eastern European77 0.02% Liberian76 0.02% South African76 0.02% Trinidadian and Tobagonian58 0.01% Ghanaian55 0.01% Maltese45 0.01% Kenyan44 0.01% Turkish44 0.01% Belizean43 0.01% Brazilian40 0.01% Danish39 0.01% Egyptian39 0.01% Lithuanian35 0.01% Assyrian35 0.01% Yugoslavian34 0.01% Israeli32 0.01% Russian26 0.01% Welsh24 0.01% Northern European
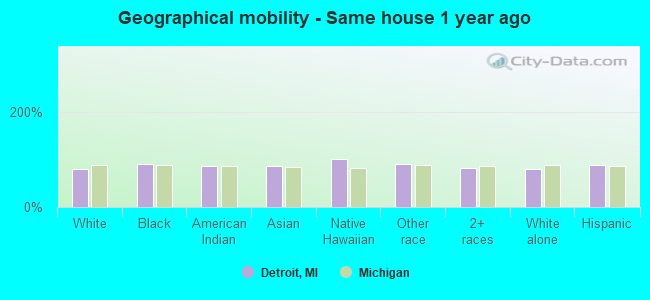
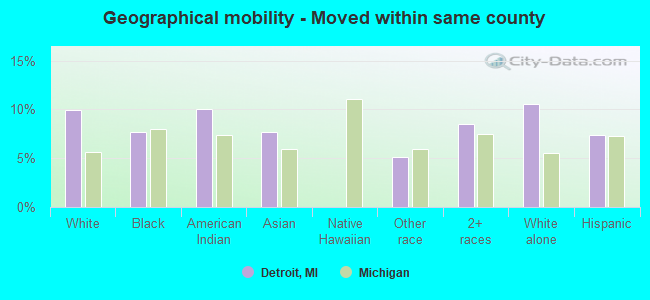
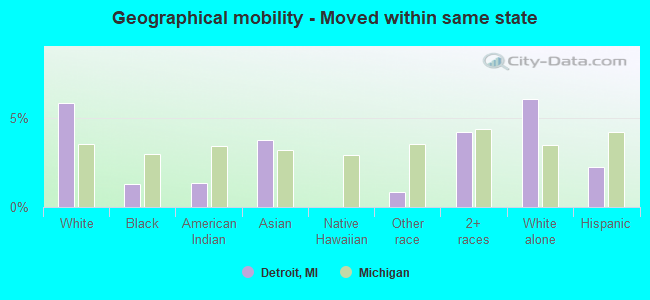
Geographical mobility in Detroit Same house 1 year ago 57,389 80.0% White (Caucasian)422,565 89.9% Black or African American1,926 85.7% American Indian / Alaska Native10,075 86.3% Asian101 100.0% Native Hawaiian / Pacific Islander25,010 90.0% Other race25,062 81.6% Two or more races52,873 78.9% White alone, not Hispanic / Latino37,138 87.0% Hispanic or LatinoMoved within same county 7,104 9.9% White / Caucasian36,308 7.7% Black or African American225 10.0% American Indian / Alaska Native899 7.7% Asian1,434 5.2% Other race2,623 8.5% Two or more races7,058 10.5% White alone, not Hispanic / Latino3,166 7.4% Hispanic or LatinoMoved within same state 4,189 5.8% White / Caucasian6,016 1.3% Black or African American30 1.3% American Indian / Alaska Native435 3.7% Asian231 0.8% Other race1,279 4.2% Two or more races4,058 6.1% White alone, not Hispanic / Latino953 2.2% Hispanic or LatinoMoved from different state 1,761 2.5% White / Caucasian4,653 1.0% Black or African American10 0.4% American Indian / Alaska Native45 0.4% Asian830 3.0% Other race643 2.1% Two or more races1,761 2.6% White alone, not Hispanic / Latino1,154 2.7% Hispanic or LatinoMoved from abroad 1,276 1.8% White392 0.1% Black or African American60 2.7% American Indian / Alaska Native219 1.9% Asian269 1.0% Other race1,101 3.6% Two or more races1,276 1.9% White alone, not Hispanic / Latino269 0.6% Hispanic or Latino
Children Nativity (place of birth) in Detroit
Children under 6 years - Living with two parents Both parents native 7,101 100.0% NativeBoth parents foreign-born 2,753 72.0% Native1,071 28.0% Foreign-bornOne native, one foreign-born parent 3,140 100.0% NativeChildren under 6 years - Living with one parent Native parent 31,646 100.0% NativeForeign-born parent 869 95.7% Native39 4.3% Foreign-bornChildren 6 to 17 years - Living with two parents Both parents native 16,179 100.0% NativeBoth parents foreign-born 5,854 66.9% Native2,894 33.1% Foreign-bornOne native, one foreign-born parent 2,290 92.0% Native199 8.0% Foreign-bornChildren 6 to 17 years - Living with one parent Native parent 63,834 100.0% NativeForeign-born parent 4,097 52.3% Native3,744 47.7% Foreign-born
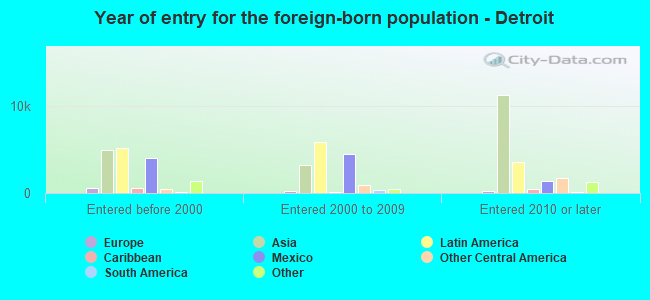
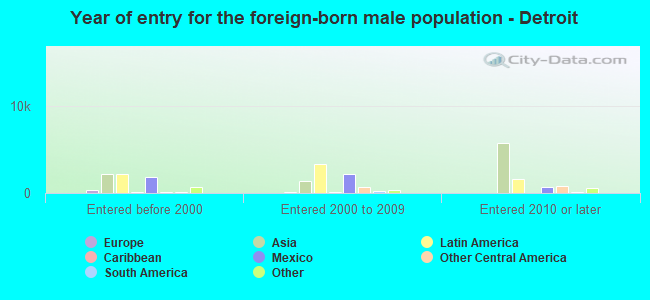
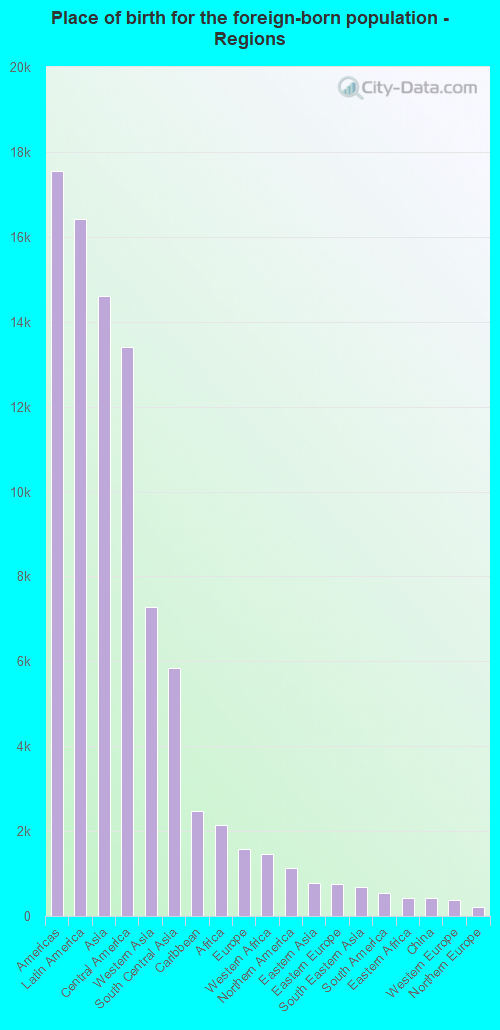
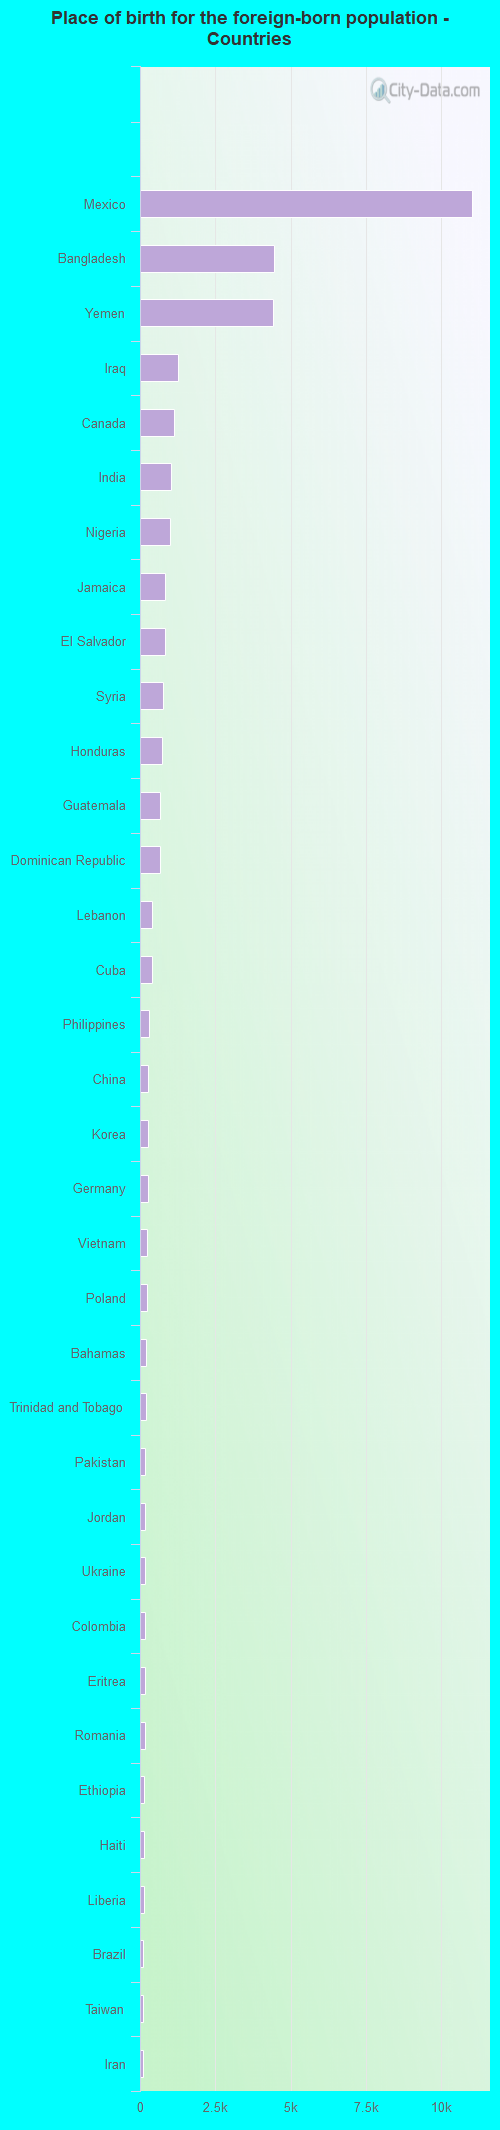
Place of birth for residents in Detroit 17,551 Americas16,418 Latin America14,594 Asia13,404 Central America7,268 Western Asia5,843 South Central Asia2,471 Caribbean2,139 Africa1,587 Europe1,454 Western Africa1,133 Northern America766 Eastern Asia759 Eastern Europe679 South Eastern Asia542 South America433 Eastern Africa419 China377 Western Europe203 Northern Europe153 Northern Africa132 Southern Europe62 Oceania59 Australia and New Zealand Subregion29 Southern Africa16 Middle Africa11,027 Mexico4,441 Bangladesh4,400 Yemen1,269 Iraq1,126 Canada1,033 India1,005 Nigeria844 Jamaica816 El Salvador749 Syria734 Honduras674 Guatemala669 Dominican Republic408 Lebanon393 Cuba294 Philippines280 China265 Korea254 Germany244 Vietnam220 Poland201 Bahamas195 Trinidad and Tobago178 Pakistan174 Jordan171 Ukraine170 Colombia161 Eritrea154 Romania138 Ethiopia132 Haiti131 Liberia105 Brazil104 Taiwan103 Iran95 England88 France88 Ghana87 Kuwait82 Japan80 United Kingdom73 Morocco71 Venezuela65 Saudi Arabia64 Senegal61 Albania60 Panama58 Sri Lanka58 Turkey55 Italy54 Sudan51 Russia51 Laos49 Ecuador48 Kenya41 Uruguay40 Ivory Coast40 New Zealand36 Chile35 Burma (Myanmar)35 Hong Kong30 Somalia29 South Africa28 Belarus26 Nicaragua24 Spain22 Belize22 Argentina22 St. Vincent and the Grenadines22 Bulgaria21 Netherlands21 Thailand21 Peru20 Hungary19 Australia19 Costa Rica18 Ireland17 Indonesia16 Cameroon16 Egypt15 Malaysia15 Uganda15 Uzbekistan15 Nepal14 Greece13 Zimbabwe13 Portugal11 United Arab Emirates11 Austria10 Algeria10 Denmark9 Israel8 Barbados7 Sierra Leone6 Czechoslovakia6 Grenada5 Lithuania3 Fiji3 Belgium2 Cambodia
Grandparents responsible for own grandchildren in Detroit
Grandparents (30 to 59 years) White / Caucasian 289 65.3% Responsible for grandchildren154 34.7% Not responsible for grandchildrenBlack or African American 2,449 39.6% Responsible for grandchildren3,739 60.4% Not responsible for grandchildrenAmerican Indian / Alaska Native 1 1.0% Responsible for grandchildren145 99.0% Not responsible for grandchildrenAsian 8 11.7% Responsible for grandchildren61 88.3% Not responsible for grandchildrenOther race 274 35.2% Responsible for grandchildren505 64.8% Not responsible for grandchildrenTwo or more races 40 14.3% Responsible for grandchildren239 85.7% Not responsible for grandchildrenWhite alone, not Hispanic / Latino 289 71.6% Responsible for grandchildren114 28.4% Not responsible for grandchildrenHispanic or Latino 218 19.1% Responsible for grandchildren922 80.9% Not responsible for grandchildrenGrandparents (60 years and over) White / Caucasian 46 10.5% Responsible for grandchildren392 89.5% Not responsible for grandchildrenBlack or African American 1,962 37.0% Responsible for grandchildren3,343 63.0% Not responsible for grandchildrenAmerican Indian / Alaska Native 24 100.0% Not responsible for grandchildrenAsian 5 3.0% Responsible for grandchildren155 97.0% Not responsible for grandchildrenOther race 152 18.1% Responsible for grandchildren688 81.9% Not responsible for grandchildrenTwo or more races 15 5.7% Responsible for grandchildren246 94.3% Not responsible for grandchildrenWhite alone, not Hispanic / Latino 43 14.7% Responsible for grandchildren249 85.3% Not responsible for grandchildrenHispanic or Latino 517 100.0% Not responsible for grandchildren
Zip codes: 48201 , 48202 , 48203 , 48204 , 48205 , 48206 , 48207 , 48208 , 48209 , 48210 , 48211 , 48212 , 48213 , 48214 , 48215 , 48216 , 48217 , 48219 , 48221 , 48223 , 48224 , 48225 , 48226 , 48227 , 48228 , 48233, 48234 , 48235 , 48236 , 48238 , 48239 , 48240 , 48243.