Estimated zip code population in 2022: 54,540
Zip code population in 2010: 52,130
Zip code population in 2000: 65,051
Houses and condos: 22,554
Renter-occupied apartments: 9,927
% of renters here:
51%State:
27%
March 2022 cost of living index in zip code 48228: 93.9
(less than average, U.S. average is 100)
Land area: 8.6
sq. mi.
Water area: 0.0
sq. mi.
Population density: 6,335 people per square mile (high).
OSM Map
General Map
Google Map
MSN Map
OSM Map
General Map
Google Map
MSN Map
OSM Map
General Map
Google Map
MSN Map
OSM Map
General Map
Google Map
MSN Map
Please wait while loading the map...
Real estate property taxes paid for housing units in 2022:
This zip code:
2.3% ($1,237)Michigan:
1.2% ($2,746)
Median real estate property taxes paid for housing units with mortgages in 2022: $1,456 (2.2%)
Median real estate property taxes paid for housing units with no mortgage in 2022: $1,131 (2.3%)
Profiles of local businesses
Business Search - 14 Million verified businesses
Males: 26,644 Females: 27,896
For population 25 years and over in 48228:
High school or higher: 78.5%Bachelor's degree or higher: 11.4%Graduate or professional degree: 4.8%Unemployed: 13.8%Mean travel time to work (commute): 26.9 minutes
For population 15 years and over in 48228:
Never married: 56.7%Now married: 23.6%Separated: 2.8%Widowed: 4.5%Divorced: 12.4%
Zip code 48228 compared to state average:
Median household income below state average. Median house value significantly below state average. Unemployed percentage significantly above state average. Black race population percentage significantly above state average. Median age significantly below state average. Renting percentage above state average. Length of stay since moving in significantly above state average. House age above state average. Percentage of population with a bachelor's degree or higher significantly below state average. 40,367 74.0% Black 8,046 14.8% White 3,426 6.3% Hispanic or Latino 2,084 3.8% Two or more races 448 0.8% Some other race 97 0.2% Asian 60 0.1% American Indian 7 0.01% Native Hawaiian and Other
Data:
Median household income ($)
Median household income (% change since 2000)
Household income diversity
Ratio of average income to average house value (%)
Ratio of average income to average rent
Median household income ($) - White
Median household income ($) - Black or African American
Median household income ($) - Asian
Median household income ($) - Hispanic or Latino
Median household income ($) - American Indian and Alaska Native
Median household income ($) - Multirace
Median household income ($) - Other Race
Median household income for houses/condos with a mortgage ($)
Median household income for apartments without a mortgage ($)
Races - White alone (%)
Races - White alone (% change since 2000)
Races - Black alone (%)
Races - Black alone (% change since 2000)
Races - American Indian alone (%)
Races - American Indian alone (% change since 2000)
Races - Asian alone (%)
Races - Asian alone (% change since 2000)
Races - Hispanic (%)
Races - Hispanic (% change since 2000)
Races - Native Hawaiian and Other Pacific Islander alone (%)
Races - Native Hawaiian and Other Pacific Islander alone (% change since 2000)
Races - Two or more races (%)
Races - Two or more races (% change since 2000)
Races - Other race alone (%)
Races - Other race alone (% change since 2000)
Racial diversity
Unemployment (%)
Unemployment (% change since 2000)
Unemployment (%) - White
Unemployment (%) - Black or African American
Unemployment (%) - Asian
Unemployment (%) - Hispanic or Latino
Unemployment (%) - American Indian and Alaska Native
Unemployment (%) - Multirace
Unemployment (%) - Other Race
Population density (people per square mile)
Population - Males (%)
Population - Females (%)
Population - Males (%) - White
Population - Males (%) - Black or African American
Population - Males (%) - Asian
Population - Males (%) - Hispanic or Latino
Population - Males (%) - American Indian and Alaska Native
Population - Males (%) - Multirace
Population - Males (%) - Other Race
Population - Females (%) - White
Population - Females (%) - Black or African American
Population - Females (%) - Asian
Population - Females (%) - Hispanic or Latino
Population - Females (%) - American Indian and Alaska Native
Population - Females (%) - Multirace
Population - Females (%) - Other Race
Coronavirus confirmed cases (May 04, 2024)
Deaths caused by coronavirus (May 04, 2024)
Coronavirus confirmed cases (per 100k population) (May 04, 2024)
Deaths caused by coronavirus (per 100k population) (May 04, 2024)
Daily increase in number of cases (May 04, 2024)
Weekly increase in number of cases (May 04, 2024)
Cases doubled (in days) (May 04, 2024)
Hospitalized patients (Apr 18, 2022)
Negative test results (Apr 18, 2022)
Total test results (Apr 18, 2022)
COVID Vaccine doses distributed (per 100k population) (Sep 19, 2023)
COVID Vaccine doses administered (per 100k population) (Sep 19, 2023)
COVID Vaccine doses distributed (Sep 19, 2023)
COVID Vaccine doses administered (Sep 19, 2023)
Likely homosexual households (%)
Likely homosexual households (% change since 2000)
Likely homosexual households - Lesbian couples (%)
Likely homosexual households - Lesbian couples (% change since 2000)
Likely homosexual households - Gay men (%)
Likely homosexual households - Gay men (% change since 2000)
Cost of living index
Median gross rent ($)
Median contract rent ($)
Median monthly housing costs ($)
Median house or condo value ($)
Median house or condo value ($ change since 2000)
Mean house or condo value by units in structure - 1, detached ($)
Mean house or condo value by units in structure - 1, attached ($)
Mean house or condo value by units in structure - 2 ($)
Mean house or condo value by units in structure by units in structure - 3 or 4 ($)
Mean house or condo value by units in structure - 5 or more ($)
Mean house or condo value by units in structure - Boat, RV, van, etc. ($)
Mean house or condo value by units in structure - Mobile home ($)
Median house or condo value ($) - White
Median house or condo value ($) - Black or African American
Median house or condo value ($) - Asian
Median house or condo value ($) - Hispanic or Latino
Median house or condo value ($) - American Indian and Alaska Native
Median house or condo value ($) - Multirace
Median house or condo value ($) - Other Race
Median resident age
Resident age diversity
Median resident age - Males
Median resident age - Females
Median resident age - White
Median resident age - Black or African American
Median resident age - Asian
Median resident age - Hispanic or Latino
Median resident age - American Indian and Alaska Native
Median resident age - Multirace
Median resident age - Other Race
Median resident age - Males - White
Median resident age - Males - Black or African American
Median resident age - Males - Asian
Median resident age - Males - Hispanic or Latino
Median resident age - Males - American Indian and Alaska Native
Median resident age - Males - Multirace
Median resident age - Males - Other Race
Median resident age - Females - White
Median resident age - Females - Black or African American
Median resident age - Females - Asian
Median resident age - Females - Hispanic or Latino
Median resident age - Females - American Indian and Alaska Native
Median resident age - Females - Multirace
Median resident age - Females - Other Race
Commute - mean travel time to work (minutes)
Travel time to work - Less than 5 minutes (%)
Travel time to work - Less than 5 minutes (% change since 2000)
Travel time to work - 5 to 9 minutes (%)
Travel time to work - 5 to 9 minutes (% change since 2000)
Travel time to work - 10 to 19 minutes (%)
Travel time to work - 10 to 19 minutes (% change since 2000)
Travel time to work - 20 to 29 minutes (%)
Travel time to work - 20 to 29 minutes (% change since 2000)
Travel time to work - 30 to 39 minutes (%)
Travel time to work - 30 to 39 minutes (% change since 2000)
Travel time to work - 40 to 59 minutes (%)
Travel time to work - 40 to 59 minutes (% change since 2000)
Travel time to work - 60 to 89 minutes (%)
Travel time to work - 60 to 89 minutes (% change since 2000)
Travel time to work - 90 or more minutes (%)
Travel time to work - 90 or more minutes (% change since 2000)
Marital status - Never married (%)
Marital status - Now married (%)
Marital status - Separated (%)
Marital status - Widowed (%)
Marital status - Divorced (%)
Median family income ($)
Median family income (% change since 2000)
Median non-family income ($)
Median non-family income (% change since 2000)
Median per capita income ($)
Median per capita income (% change since 2000)
Median family income ($) - White
Median family income ($) - Black or African American
Median family income ($) - Asian
Median family income ($) - Hispanic or Latino
Median family income ($) - American Indian and Alaska Native
Median family income ($) - Multirace
Median family income ($) - Other Race
Median year house/condo built
Median year apartment built
Year house built - Built 2005 or later (%)
Year house built - Built 2000 to 2004 (%)
Year house built - Built 1990 to 1999 (%)
Year house built - Built 1980 to 1989 (%)
Year house built - Built 1970 to 1979 (%)
Year house built - Built 1960 to 1969 (%)
Year house built - Built 1950 to 1959 (%)
Year house built - Built 1940 to 1949 (%)
Year house built - Built 1939 or earlier (%)
Average household size
Household density (households per square mile)
Average household size - White
Average household size - Black or African American
Average household size - Asian
Average household size - Hispanic or Latino
Average household size - American Indian and Alaska Native
Average household size - Multirace
Average household size - Other Race
Occupied housing units (%)
Vacant housing units (%)
Owner occupied housing units (%)
Renter occupied housing units (%)
Vacancy status - For rent (%)
Vacancy status - For sale only (%)
Vacancy status - Rented or sold, not occupied (%)
Vacancy status - For seasonal, recreational, or occasional use (%)
Vacancy status - For migrant workers (%)
Vacancy status - Other vacant (%)
Residents with income below the poverty level (%)
Residents with income below 50% of the poverty level (%)
Children below poverty level (%)
Poor families by family type - Married-couple family (%)
Poor families by family type - Male, no wife present (%)
Poor families by family type - Female, no husband present (%)
Poverty status for native-born residents (%)
Poverty status for foreign-born residents (%)
Poverty among high school graduates not in families (%)
Poverty among people who did not graduate high school not in families (%)
Residents with income below the poverty level (%) - White
Residents with income below the poverty level (%) - Black or African American
Residents with income below the poverty level (%) - Asian
Residents with income below the poverty level (%) - Hispanic or Latino
Residents with income below the poverty level (%) - American Indian and Alaska Native
Residents with income below the poverty level (%) - Multirace
Residents with income below the poverty level (%) - Other Race
Air pollution - Air Quality Index (AQI)
Air pollution - CO
Air pollution - NO2
Air pollution - SO2
Air pollution - Ozone
Air pollution - PM10
Air pollution - PM25
Air pollution - Pb
Crime - Murders per 100,000 population
Crime - Rapes per 100,000 population
Crime - Robberies per 100,000 population
Crime - Assaults per 100,000 population
Crime - Burglaries per 100,000 population
Crime - Thefts per 100,000 population
Crime - Auto thefts per 100,000 population
Crime - Arson per 100,000 population
Crime - City-data.com crime index
Crime - Violent crime index
Crime - Property crime index
Crime - Murders per 100,000 population (5 year average)
Crime - Rapes per 100,000 population (5 year average)
Crime - Robberies per 100,000 population (5 year average)
Crime - Assaults per 100,000 population (5 year average)
Crime - Burglaries per 100,000 population (5 year average)
Crime - Thefts per 100,000 population (5 year average)
Crime - Auto thefts per 100,000 population (5 year average)
Crime - Arson per 100,000 population (5 year average)
Crime - City-data.com crime index (5 year average)
Crime - Violent crime index (5 year average)
Crime - Property crime index (5 year average)
1996 Presidential Elections Results (%) - Democratic Party (Clinton)
1996 Presidential Elections Results (%) - Republican Party (Dole)
1996 Presidential Elections Results (%) - Other
2000 Presidential Elections Results (%) - Democratic Party (Gore)
2000 Presidential Elections Results (%) - Republican Party (Bush)
2000 Presidential Elections Results (%) - Other
2004 Presidential Elections Results (%) - Democratic Party (Kerry)
2004 Presidential Elections Results (%) - Republican Party (Bush)
2004 Presidential Elections Results (%) - Other
2008 Presidential Elections Results (%) - Democratic Party (Obama)
2008 Presidential Elections Results (%) - Republican Party (McCain)
2008 Presidential Elections Results (%) - Other
2012 Presidential Elections Results (%) - Democratic Party (Obama)
2012 Presidential Elections Results (%) - Republican Party (Romney)
2012 Presidential Elections Results (%) - Other
2016 Presidential Elections Results (%) - Democratic Party (Clinton)
2016 Presidential Elections Results (%) - Republican Party (Trump)
2016 Presidential Elections Results (%) - Other
2020 Presidential Elections Results (%) - Democratic Party (Biden)
2020 Presidential Elections Results (%) - Republican Party (Trump)
2020 Presidential Elections Results (%) - Other
Ancestries Reported - Arab (%)
Ancestries Reported - Czech (%)
Ancestries Reported - Danish (%)
Ancestries Reported - Dutch (%)
Ancestries Reported - English (%)
Ancestries Reported - French (%)
Ancestries Reported - French Canadian (%)
Ancestries Reported - German (%)
Ancestries Reported - Greek (%)
Ancestries Reported - Hungarian (%)
Ancestries Reported - Irish (%)
Ancestries Reported - Italian (%)
Ancestries Reported - Lithuanian (%)
Ancestries Reported - Norwegian (%)
Ancestries Reported - Polish (%)
Ancestries Reported - Portuguese (%)
Ancestries Reported - Russian (%)
Ancestries Reported - Scotch-Irish (%)
Ancestries Reported - Scottish (%)
Ancestries Reported - Slovak (%)
Ancestries Reported - Subsaharan African (%)
Ancestries Reported - Swedish (%)
Ancestries Reported - Swiss (%)
Ancestries Reported - Ukrainian (%)
Ancestries Reported - United States (%)
Ancestries Reported - Welsh (%)
Ancestries Reported - West Indian (%)
Ancestries Reported - Other (%)
Educational Attainment - No schooling completed (%)
Educational Attainment - Less than high school (%)
Educational Attainment - High school or equivalent (%)
Educational Attainment - Less than 1 year of college (%)
Educational Attainment - 1 or more years of college (%)
Educational Attainment - Associate degree (%)
Educational Attainment - Bachelor's degree (%)
Educational Attainment - Master's degree (%)
Educational Attainment - Professional school degree (%)
Educational Attainment - Doctorate degree (%)
School Enrollment - Nursery, preschool (%)
School Enrollment - Kindergarten (%)
School Enrollment - Grade 1 to 4 (%)
School Enrollment - Grade 5 to 8 (%)
School Enrollment - Grade 9 to 12 (%)
School Enrollment - College undergrad (%)
School Enrollment - Graduate or professional (%)
School Enrollment - Not enrolled in school (%)
School enrollment - Public schools (%)
School enrollment - Private schools (%)
School enrollment - Not enrolled (%)
Median number of rooms in houses and condos
Median number of rooms in apartments
Housing units lacking complete plumbing facilities (%)
Housing units lacking complete kitchen facilities (%)
Density of houses
Urban houses (%)
Rural houses (%)
Households with people 60 years and over (%)
Households with people 65 years and over (%)
Households with people 75 years and over (%)
Households with one or more nonrelatives (%)
Households with no nonrelatives (%)
Population in households (%)
Family households (%)
Nonfamily households (%)
Population in families (%)
Family households with own children (%)
Median number of bedrooms in owner occupied houses
Mean number of bedrooms in owner occupied houses
Median number of bedrooms in renter occupied houses
Mean number of bedrooms in renter occupied houses
Median number of vehichles in owner occupied houses
Mean number of vehichles in owner occupied houses
Median number of vehichles in renter occupied houses
Mean number of vehichles in renter occupied houses
Mortgage status - with mortgage (%)
Mortgage status - with second mortgage (%)
Mortgage status - with home equity loan (%)
Mortgage status - with both second mortgage and home equity loan (%)
Mortgage status - without a mortgage (%)
Average family size
Average family size - White
Average family size - Black or African American
Average family size - Asian
Average family size - Hispanic or Latino
Average family size - American Indian and Alaska Native
Average family size - Multirace
Average family size - Other Race
Geographical mobility - Same house 1 year ago (%)
Geographical mobility - Moved within same county (%)
Geographical mobility - Moved from different county within same state (%)
Geographical mobility - Moved from different state (%)
Geographical mobility - Moved from abroad (%)
Place of birth - Born in state of residence (%)
Place of birth - Born in other state (%)
Place of birth - Native, outside of US (%)
Place of birth - Foreign born (%)
Housing units in structures - 1, detached (%)
Housing units in structures - 1, attached (%)
Housing units in structures - 2 (%)
Housing units in structures - 3 or 4 (%)
Housing units in structures - 5 to 9 (%)
Housing units in structures - 10 to 19 (%)
Housing units in structures - 20 to 49 (%)
Housing units in structures - 50 or more (%)
Housing units in structures - Mobile home (%)
Housing units in structures - Boat, RV, van, etc. (%)
House/condo owner moved in on average (years ago)
Renter moved in on average (years ago)
Year householder moved into unit - Moved in 1999 to March 2000 (%)
Year householder moved into unit - Moved in 1995 to 1998 (%)
Year householder moved into unit - Moved in 1990 to 1994 (%)
Year householder moved into unit - Moved in 1980 to 1989 (%)
Year householder moved into unit - Moved in 1970 to 1979 (%)
Year householder moved into unit - Moved in 1969 or earlier (%)
Means of transportation to work - Drove car alone (%)
Means of transportation to work - Carpooled (%)
Means of transportation to work - Public transportation (%)
Means of transportation to work - Bus or trolley bus (%)
Means of transportation to work - Streetcar or trolley car (%)
Means of transportation to work - Subway or elevated (%)
Means of transportation to work - Railroad (%)
Means of transportation to work - Ferryboat (%)
Means of transportation to work - Taxicab (%)
Means of transportation to work - Motorcycle (%)
Means of transportation to work - Bicycle (%)
Means of transportation to work - Walked (%)
Means of transportation to work - Other means (%)
Working at home (%)
Industry diversity
Most Common Industries - Agriculture, forestry, fishing and hunting, and mining (%)
Most Common Industries - Agriculture, forestry, fishing and hunting (%)
Most Common Industries - Mining, quarrying, and oil and gas extraction (%)
Most Common Industries - Construction (%)
Most Common Industries - Manufacturing (%)
Most Common Industries - Wholesale trade (%)
Most Common Industries - Retail trade (%)
Most Common Industries - Transportation and warehousing, and utilities (%)
Most Common Industries - Transportation and warehousing (%)
Most Common Industries - Utilities (%)
Most Common Industries - Information (%)
Most Common Industries - Finance and insurance, and real estate and rental and leasing (%)
Most Common Industries - Finance and insurance (%)
Most Common Industries - Real estate and rental and leasing (%)
Most Common Industries - Professional, scientific, and management, and administrative and waste management services (%)
Most Common Industries - Professional, scientific, and technical services (%)
Most Common Industries - Management of companies and enterprises (%)
Most Common Industries - Administrative and support and waste management services (%)
Most Common Industries - Educational services, and health care and social assistance (%)
Most Common Industries - Educational services (%)
Most Common Industries - Health care and social assistance (%)
Most Common Industries - Arts, entertainment, and recreation, and accommodation and food services (%)
Most Common Industries - Arts, entertainment, and recreation (%)
Most Common Industries - Accommodation and food services (%)
Most Common Industries - Other services, except public administration (%)
Most Common Industries - Public administration (%)
Occupation diversity
Most Common Occupations - Management, business, science, and arts occupations (%)
Most Common Occupations - Management, business, and financial occupations (%)
Most Common Occupations - Management occupations (%)
Most Common Occupations - Business and financial operations occupations (%)
Most Common Occupations - Computer, engineering, and science occupations (%)
Most Common Occupations - Computer and mathematical occupations (%)
Most Common Occupations - Architecture and engineering occupations (%)
Most Common Occupations - Life, physical, and social science occupations (%)
Most Common Occupations - Education, legal, community service, arts, and media occupations (%)
Most Common Occupations - Community and social service occupations (%)
Most Common Occupations - Legal occupations (%)
Most Common Occupations - Education, training, and library occupations (%)
Most Common Occupations - Arts, design, entertainment, sports, and media occupations (%)
Most Common Occupations - Healthcare practitioners and technical occupations (%)
Most Common Occupations - Health diagnosing and treating practitioners and other technical occupations (%)
Most Common Occupations - Health technologists and technicians (%)
Most Common Occupations - Service occupations (%)
Most Common Occupations - Healthcare support occupations (%)
Most Common Occupations - Protective service occupations (%)
Most Common Occupations - Fire fighting and prevention, and other protective service workers including supervisors (%)
Most Common Occupations - Law enforcement workers including supervisors (%)
Most Common Occupations - Food preparation and serving related occupations (%)
Most Common Occupations - Building and grounds cleaning and maintenance occupations (%)
Most Common Occupations - Personal care and service occupations (%)
Most Common Occupations - Sales and office occupations (%)
Most Common Occupations - Sales and related occupations (%)
Most Common Occupations - Office and administrative support occupations (%)
Most Common Occupations - Natural resources, construction, and maintenance occupations (%)
Most Common Occupations - Farming, fishing, and forestry occupations (%)
Most Common Occupations - Construction and extraction occupations (%)
Most Common Occupations - Installation, maintenance, and repair occupations (%)
Most Common Occupations - Production, transportation, and material moving occupations (%)
Most Common Occupations - Production occupations (%)
Most Common Occupations - Transportation occupations (%)
Most Common Occupations - Material moving occupations (%)
People in Group quarters - Institutionalized population (%)
People in Group quarters - Correctional institutions (%)
People in Group quarters - Federal prisons and detention centers (%)
People in Group quarters - Halfway houses (%)
People in Group quarters - Local jails and other confinement facilities (including police lockups) (%)
People in Group quarters - Military disciplinary barracks (%)
People in Group quarters - State prisons (%)
People in Group quarters - Other types of correctional institutions (%)
People in Group quarters - Nursing homes (%)
People in Group quarters - Hospitals/wards, hospices, and schools for the handicapped (%)
People in Group quarters - Hospitals/wards and hospices for chronically ill (%)
People in Group quarters - Hospices or homes for chronically ill (%)
People in Group quarters - Military hospitals or wards for chronically ill (%)
People in Group quarters - Other hospitals or wards for chronically ill (%)
People in Group quarters - Hospitals or wards for drug/alcohol abuse (%)
People in Group quarters - Mental (Psychiatric) hospitals or wards (%)
People in Group quarters - Schools, hospitals, or wards for the mentally retarded (%)
People in Group quarters - Schools, hospitals, or wards for the physically handicapped (%)
People in Group quarters - Institutions for the deaf (%)
People in Group quarters - Institutions for the blind (%)
People in Group quarters - Orthopedic wards and institutions for the physically handicapped (%)
People in Group quarters - Wards in general hospitals for patients who have no usual home elsewhere (%)
People in Group quarters - Wards in military hospitals for patients who have no usual home elsewhere (%)
People in Group quarters - Juvenile institutions (%)
People in Group quarters - Long-term care (%)
People in Group quarters - Homes for abused, dependent, and neglected children (%)
People in Group quarters - Residential treatment centers for emotionally disturbed children (%)
People in Group quarters - Training schools for juvenile delinquents (%)
People in Group quarters - Short-term care, detention or diagnostic centers for delinquent children (%)
People in Group quarters - Type of juvenile institution unknown (%)
People in Group quarters - Noninstitutionalized population (%)
People in Group quarters - College dormitories (includes college quarters off campus) (%)
People in Group quarters - Military quarters (%)
People in Group quarters - On base (%)
People in Group quarters - Barracks, unaccompanied personnel housing (UPH), (Enlisted/Officer), ;and similar group living quarters for military personnel (%)
People in Group quarters - Transient quarters for temporary residents (%)
People in Group quarters - Military ships (%)
People in Group quarters - Group homes (%)
People in Group quarters - Homes or halfway houses for drug/alcohol abuse (%)
People in Group quarters - Homes for the mentally ill (%)
People in Group quarters - Homes for the mentally retarded (%)
People in Group quarters - Homes for the physically handicapped (%)
People in Group quarters - Other group homes (%)
People in Group quarters - Religious group quarters (%)
People in Group quarters - Dormitories (%)
People in Group quarters - Agriculture workers' dormitories on farms (%)
People in Group quarters - Job Corps and vocational training facilities (%)
People in Group quarters - Other workers' dormitories (%)
People in Group quarters - Crews of maritime vessels (%)
People in Group quarters - Other nonhousehold living situations (%)
People in Group quarters - Other noninstitutional group quarters (%)
Residents speaking English at home (%)
Residents speaking English at home - Born in the United States (%)
Residents speaking English at home - Native, born elsewhere (%)
Residents speaking English at home - Foreign born (%)
Residents speaking Spanish at home (%)
Residents speaking Spanish at home - Born in the United States (%)
Residents speaking Spanish at home - Native, born elsewhere (%)
Residents speaking Spanish at home - Foreign born (%)
Residents speaking other language at home (%)
Residents speaking other language at home - Born in the United States (%)
Residents speaking other language at home - Native, born elsewhere (%)
Residents speaking other language at home - Foreign born (%)
Class of Workers - Employee of private company (%)
Class of Workers - Self-employed in own incorporated business (%)
Class of Workers - Private not-for-profit wage and salary workers (%)
Class of Workers - Local government workers (%)
Class of Workers - State government workers (%)
Class of Workers - Federal government workers (%)
Class of Workers - Self-employed workers in own not incorporated business and Unpaid family workers (%)
House heating fuel used in houses and condos - Utility gas (%)
House heating fuel used in houses and condos - Bottled, tank, or LP gas (%)
House heating fuel used in houses and condos - Electricity (%)
House heating fuel used in houses and condos - Fuel oil, kerosene, etc. (%)
House heating fuel used in houses and condos - Coal or coke (%)
House heating fuel used in houses and condos - Wood (%)
House heating fuel used in houses and condos - Solar energy (%)
House heating fuel used in houses and condos - Other fuel (%)
House heating fuel used in houses and condos - No fuel used (%)
House heating fuel used in apartments - Utility gas (%)
House heating fuel used in apartments - Bottled, tank, or LP gas (%)
House heating fuel used in apartments - Electricity (%)
House heating fuel used in apartments - Fuel oil, kerosene, etc. (%)
House heating fuel used in apartments - Coal or coke (%)
House heating fuel used in apartments - Wood (%)
House heating fuel used in apartments - Solar energy (%)
House heating fuel used in apartments - Other fuel (%)
House heating fuel used in apartments - No fuel used (%)
Armed forces status - In Armed Forces (%)
Armed forces status - Civilian (%)
Armed forces status - Civilian - Veteran (%)
Armed forces status - Civilian - Nonveteran (%)
Fatal accidents locations in years 2005-2021
Fatal accidents locations in 2005
Fatal accidents locations in 2006
Fatal accidents locations in 2007
Fatal accidents locations in 2008
Fatal accidents locations in 2009
Fatal accidents locations in 2010
Fatal accidents locations in 2011
Fatal accidents locations in 2012
Fatal accidents locations in 2013
Fatal accidents locations in 2014
Fatal accidents locations in 2015
Fatal accidents locations in 2016
Fatal accidents locations in 2017
Fatal accidents locations in 2018
Fatal accidents locations in 2019
Fatal accidents locations in 2020
Fatal accidents locations in 2021
Alcohol use - People drinking some alcohol every month (%)
Alcohol use - People not drinking at all (%)
Alcohol use - Average days/month drinking alcohol
Alcohol use - Average drinks/week
Alcohol use - Average days/year people drink much
Audiometry - Average condition of hearing (%)
Audiometry - People that can hear a whisper from across a quiet room (%)
Audiometry - People that can hear normal voice from across a quiet room (%)
Audiometry - Ears ringing, roaring, buzzing (%)
Audiometry - Had a job exposure to loud noise (%)
Audiometry - Had off-work exposure to loud noise (%)
Blood Pressure & Cholesterol - Has high blood pressure (%)
Blood Pressure & Cholesterol - Checking blood pressure at home (%)
Blood Pressure & Cholesterol - Frequently checking blood cholesterol (%)
Blood Pressure & Cholesterol - Has high cholesterol level (%)
Consumer Behavior - Money monthly spent on food at supermarket/grocery store
Consumer Behavior - Money monthly spent on food at other stores
Consumer Behavior - Money monthly spent on eating out
Consumer Behavior - Money monthly spent on carryout/delivered foods
Consumer Behavior - Income spent on food at supermarket/grocery store (%)
Consumer Behavior - Income spent on food at other stores (%)
Consumer Behavior - Income spent on eating out (%)
Consumer Behavior - Income spent on carryout/delivered foods (%)
Current Health Status - General health condition (%)
Current Health Status - Blood donors (%)
Current Health Status - Has blood ever tested for HIV virus (%)
Current Health Status - Left-handed people (%)
Dermatology - People using sunscreen (%)
Diabetes - Diabetics (%)
Diabetes - Had a blood test for high blood sugar (%)
Diabetes - People taking insulin (%)
Diet Behavior & Nutrition - Diet health (%)
Diet Behavior & Nutrition - Milk product consumption (# of products/month)
Diet Behavior & Nutrition - Meals not home prepared (#/week)
Diet Behavior & Nutrition - Meals from fast food or pizza place (#/week)
Diet Behavior & Nutrition - Ready-to-eat foods (#/month)
Diet Behavior & Nutrition - Frozen meals/pizza (#/month)
Drug Use - People that ever used marijuana or hashish (%)
Drug Use - Ever used hard drugs (%)
Drug Use - Ever used any form of cocaine (%)
Drug Use - Ever used heroin (%)
Drug Use - Ever used methamphetamine (%)
Health Insurance - People covered by health insurance (%)
Kidney Conditions-Urology - Avg. # of times urinating at night
Medical Conditions - People with asthma (%)
Medical Conditions - People with anemia (%)
Medical Conditions - People with psoriasis (%)
Medical Conditions - People with overweight (%)
Medical Conditions - Elderly people having difficulties in thinking or remembering (%)
Medical Conditions - People who ever received blood transfusion (%)
Medical Conditions - People having trouble seeing even with glass/contacts (%)
Medical Conditions - People with arthritis (%)
Medical Conditions - People with gout (%)
Medical Conditions - People with congestive heart failure (%)
Medical Conditions - People with coronary heart disease (%)
Medical Conditions - People with angina pectoris (%)
Medical Conditions - People who ever had heart attack (%)
Medical Conditions - People who ever had stroke (%)
Medical Conditions - People with emphysema (%)
Medical Conditions - People with thyroid problem (%)
Medical Conditions - People with chronic bronchitis (%)
Medical Conditions - People with any liver condition (%)
Medical Conditions - People who ever had cancer or malignancy (%)
Mental Health - People who have little interest in doing things (%)
Mental Health - People feeling down, depressed, or hopeless (%)
Mental Health - People who have trouble sleeping or sleeping too much (%)
Mental Health - People feeling tired or having little energy (%)
Mental Health - People with poor appetite or overeating (%)
Mental Health - People feeling bad about themself (%)
Mental Health - People who have trouble concentrating on things (%)
Mental Health - People moving or speaking slowly or too fast (%)
Mental Health - People having thoughts they would be better off dead (%)
Oral Health - Average years since last visit a dentist
Oral Health - People embarrassed because of mouth (%)
Oral Health - People with gum disease (%)
Oral Health - General health of teeth and gums (%)
Oral Health - Average days a week using dental floss/device
Oral Health - Average days a week using mouthwash for dental problem
Oral Health - Average number of teeth
Pesticide Use - Households using pesticides to control insects (%)
Pesticide Use - Households using pesticides to kill weeds (%)
Physical Activity - People doing vigorous-intensity work activities (%)
Physical Activity - People doing moderate-intensity work activities (%)
Physical Activity - People walking or bicycling (%)
Physical Activity - People doing vigorous-intensity recreational activities (%)
Physical Activity - People doing moderate-intensity recreational activities (%)
Physical Activity - Average hours a day doing sedentary activities
Physical Activity - Average hours a day watching TV or videos
Physical Activity - Average hours a day using computer
Physical Functioning - People having limitations keeping them from working (%)
Physical Functioning - People limited in amount of work they can do (%)
Physical Functioning - People that need special equipment to walk (%)
Physical Functioning - People experiencing confusion/memory problems (%)
Physical Functioning - People requiring special healthcare equipment (%)
Prescription Medications - Average number of prescription medicines taking
Preventive Aspirin Use - Adults 40+ taking low-dose aspirin (%)
Reproductive Health - Vaginal deliveries (%)
Reproductive Health - Cesarean deliveries (%)
Reproductive Health - Deliveries resulted in a live birth (%)
Reproductive Health - Pregnancies resulted in a delivery (%)
Reproductive Health - Women breastfeeding newborns (%)
Reproductive Health - Women that had a hysterectomy (%)
Reproductive Health - Women that had both ovaries removed (%)
Reproductive Health - Women that have ever taken birth control pills (%)
Reproductive Health - Women taking birth control pills (%)
Reproductive Health - Women that have ever used Depo-Provera or injectables (%)
Reproductive Health - Women that have ever used female hormones (%)
Sexual Behavior - People 18+ that ever had sex (vaginal, anal, or oral) (%)
Sexual Behavior - Males 18+ that ever had vaginal sex with a woman (%)
Sexual Behavior - Males 18+ that ever performed oral sex on a woman (%)
Sexual Behavior - Males 18+ that ever had anal sex with a woman (%)
Sexual Behavior - Males 18+ that ever had any sex with a man (%)
Sexual Behavior - Females 18+ that ever had vaginal sex with a man (%)
Sexual Behavior - Females 18+ that ever performed oral sex on a man (%)
Sexual Behavior - Females 18+ that ever had anal sex with a man (%)
Sexual Behavior - Females 18+ that ever had any kind of sex with a woman (%)
Sexual Behavior - Average age people first had sex
Sexual Behavior - Average number of female sex partners in lifetime (males 18+)
Sexual Behavior - Average number of female vaginal sex partners in lifetime (males 18+)
Sexual Behavior - Average age people first performed oral sex on a woman (18+)
Sexual Behavior - Average number of woman performed oral sex on in lifetime (18+)
Sexual Behavior - Average number of male sex partners in lifetime (males 18+)
Sexual Behavior - Average number of male anal sex partners in lifetime (males 18+)
Sexual Behavior - Average age people first performed oral sex on a man (18+)
Sexual Behavior - Average number of male oral sex partners in lifetime (18+)
Sexual Behavior - People using protection when performing oral sex (%)
Sexual Behavior - Average number of times people have vaginal or anal sex a year
Sexual Behavior - People having sex without condom (%)
Sexual Behavior - Average number of male sex partners in lifetime (females 18+)
Sexual Behavior - Average number of male vaginal sex partners in lifetime (females 18+)
Sexual Behavior - Average number of female sex partners in lifetime (females 18+)
Sexual Behavior - Circumcised males 18+ (%)
Sleep Disorders - Average hours sleeping at night
Sleep Disorders - People that has trouble sleeping (%)
Smoking-Cigarette Use - People smoking cigarettes (%)
Taste & Smell - People 40+ having problems with smell (%)
Taste & Smell - People 40+ having problems with taste (%)
Taste & Smell - People 40+ that ever had wisdom teeth removed (%)
Taste & Smell - People 40+ that ever had tonsils teeth removed (%)
Taste & Smell - People 40+ that ever had a loss of consciousness because of a head injury (%)
Taste & Smell - People 40+ that ever had a broken nose or other serious injury to face or skull (%)
Taste & Smell - People 40+ that ever had two or more sinus infections (%)
Weight - Average height (inches)
Weight - Average weight (pounds)
Weight - Average BMI
Weight - People that are obese (%)
Weight - People that ever were obese (%)
Weight - People trying to lose weight (%)
100%
urban population.
Estimated median house/condo value in 2022: $54,343
48228:
$54,343Michigan:
$224,400
Median resident age: This zip code:
30.7 yearsMichigan median age:
40.3 years
Average household size: This zip code:
2.8 peopleMichigan:
2.4 people
Averages for the 2020 tax year for zip code 48228, filed in 2021:
Average Adjusted Gross Income (AGI) in 2020: $27,202 (Individual Income Tax Returns) Here:
$27,202State:
$68,945
Salary/wage: $24,369 (reported on 73.8% of returns )Here:
$24,369State:
$57,142
(% of AGI for various income ranges: 896.8% for AGIs below $25k , 2843.2% for AGIs $25k-50k , 6799.0% for AGIs $50k-75k , 10311.2% for AGIs $75k-100k , 17843.3% for AGIs $100k-200k ) Taxable interest for individuals: $275 (reported on 7.8% of returns )This zip code:
$275Michigan:
$1,630
(% of AGI for various income ranges: 1.7% for AGIs below $25k , 2.0% for AGIs $25k-50k , 6.0% for AGIs $50k-75k , 20.0% for AGIs $75k-100k , 33.3% for AGIs $100k-200k ) Ordinary dividends: $1,404 (reported on 2.2% of returns )(% of AGI for various income ranges: 1.8% for AGIs below $25k , 3.5% for AGIs $25k-50k , 10.2% for AGIs $50k-75k , 11.2% for AGIs $75k-100k , 88.0% for AGIs $100k-200k ) Net capital gain/loss in AGI: +$3,079 (reported on 1.9% of returns )Here:
+$3,079State:
+$20,064
(% of AGI for various income ranges: 0.6% for AGIs below $25k , 1.0% for AGIs $25k-50k , 33.8% for AGIs $50k-75k , 13.8% for AGIs $75k-100k , 442.7% for AGIs $100k-200k ) Profit/loss from business: +$1,665 (reported on 24.7% of returns )Here:
+$1,665State:
+$11,172
(% of AGI for various income ranges: 83.1% for AGIs below $25k , 13.8% for AGIs $25k-50k , 11.4% for AGIs $50k-75k , 18.0% for AGIs $100k-200k ) Taxable individual retirement arrangement distribution: $10,045 (reported on 2.1% of returns )48228:
$10,045Michigan:
$19,803
(% of AGI for various income ranges: 6.5% for AGIs below $25k , 16.4% for AGIs $25k-50k , 130.7% for AGIs $50k-75k , 215.6% for AGIs $75k-100k , 598.0% for AGIs $100k-200k ) Total itemized deductions: $25,043 (reported on 2.0% of returns )Here:
$25,043State:
$34,117
(% of AGI for various income ranges: 9.0% for AGIs below $25k , 54.5% for AGIs $25k-50k , 264.7% for AGIs $50k-75k , 478.4% for AGIs $75k-100k , 1658.7% for AGIs $100k-200k ) Charity contributions: $10,506 (reported on 1.8% of returns )Here:
$10,506State:
$13,548
(% of AGI for various income ranges: 1.6% for AGIs below $25k , 13.6% for AGIs $25k-50k , 111.4% for AGIs $50k-75k , 220.3% for AGIs $75k-100k , 695.3% for AGIs $100k-200k ) Taxes paid: $5,955 (reported on 2.0% of returns )(% of AGI for various income ranges: 1.7% for AGIs below $25k , 11.5% for AGIs $25k-50k , 64.2% for AGIs $50k-75k , 129.1% for AGIs $75k-100k , 430.0% for AGIs $100k-200k ) Earned income credit: $3,021 (reported on 44.3% of returns )(% of AGI for various income ranges: 206.0% for AGIs below $25k , 160.4% for AGIs $25k-50k , 2.0% for AGIs $50k-75k ) Percentage of individuals using paid preparers for their 2020 taxes: 91.8%(% for various income ranges: 92.5% for AGIs below $25k , 92.2% for AGIs $25k-50k , 88.1% for AGIs $50k-75k , 86.3% for AGIs $75k-100k , 82.8% for AGIs $100k-200k , 66.7% for AGIs over 200k )
Averages for the 2012 tax year for zip code 48228, filed in 2013:
Average Adjusted Gross Income (AGI) in 2012: $22,972 (Individual Income Tax Returns) Here:
$22,972State:
$55,609
Salary/wage: $21,353 (reported on 78.9% of returns )Here:
$21,353State:
$46,782
(% of AGI for various income ranges: 67.6% for AGIs below $25k , 81.1% for AGIs $25k-50k , 74.0% for AGIs $50k-75k , 74.7% for AGIs $75k-100k , 68.0% for AGIs $100k-200k ) Taxable interest for individuals: $649 (reported on 10.0% of returns )This zip code:
$649Michigan:
$1,491
(% of AGI for various income ranges: 0.4% for AGIs below $25k , 0.2% for AGIs $25k-50k , 0.2% for AGIs $50k-75k , 0.2% for AGIs $75k-100k , 0.2% for AGIs $100k-200k ) Ordinary dividends: $1,514 (reported on 3.5% of returns )(% of AGI for various income ranges: 0.1% for AGIs below $25k , 0.2% for AGIs $25k-50k , 0.5% for AGIs $50k-75k , 0.2% for AGIs $75k-100k , 0.4% for AGIs $100k-200k ) Net capital gain/loss in AGI: +$292 (reported on 1.8% of returns )(% of AGI for various income ranges: 0.1% for AGIs $100k-200k ) Profit/loss from business: +$6,994 (reported on 23.5% of returns )Here:
+$6,994State:
+$11,523
(% of AGI for various income ranges: 18.8% for AGIs below $25k , 0.4% for AGIs $75k-100k , 1.4% for AGIs $100k-200k ) Taxable individual retirement arrangement distribution: $10,433 (reported on 3.3% of returns )48228:
$10,433Michigan:
$15,298
(% of AGI for various income ranges: 0.7% for AGIs below $25k , 1.0% for AGIs $25k-50k , 2.5% for AGIs $50k-75k , 2.6% for AGIs $75k-100k , 3.9% for AGIs $100k-200k ) Total itemized deductions: $14,716 (28% of AGI, reported on 12.2% of returns )Here:
$14,716State:
$21,628
Here:
28.0% of AGIState:
18.4% of AGI
(% of AGI for various income ranges: 3.1% for AGIs below $25k , 8.5% for AGIs $25k-50k , 12.9% for AGIs $50k-75k , 13.8% for AGIs $75k-100k , 12.0% for AGIs $100k-200k ) Charity contributions: $4,222 (reported on 10.5% of returns )(% of AGI for various income ranges: 0.5% for AGIs below $25k , 2.0% for AGIs $25k-50k , 3.4% for AGIs $50k-75k , 4.3% for AGIs $75k-100k , 2.9% for AGIs $100k-200k ) Taxes paid: $4,974 (reported on 12.2% of returns )(% of AGI for various income ranges: 0.6% for AGIs below $25k , 2.6% for AGIs $25k-50k , 4.5% for AGIs $50k-75k , 5.3% for AGIs $75k-100k , 5.8% for AGIs $100k-200k ) Earned income credit: $3,072 (reported on 49.0% of returns )(% of AGI for various income ranges: 15.9% for AGIs below $25k , 1.8% for AGIs $25k-50k ) Percentage of individuals using paid preparers for their 2012 taxes: 56.3%(% for various income ranges: 56.0% for AGIs below $25k , 55.6% for AGIs $25k-50k , 58.0% for AGIs $50k-75k , 61.9% for AGIs $75k-100k , 66.7% for AGIs $100k-200k )
Averages for the 2004 tax year for zip code 48228, filed in 2005:
Average Adjusted Gross Income (AGI) in 2004: $27,804 (Individual Income Tax Returns) Here:
$27,804State:
$48,204
Salary/wage: $26,953 (reported on 87.9% of returns )Here:
$26,953State:
$42,791
(% of AGI for various income ranges: 78.7% for AGIs below $10k , 78.9% for AGIs $10k-25k , 87.9% for AGIs $25k-50k , 88.4% for AGIs $50k-75k , 88.1% for AGIs $75k-100k , 79.9% for AGIs over 100k ) Taxable interest for individuals: $830 (reported on 19.6% of returns )This zip code:
$830Michigan:
$1,725
(% of AGI for various income ranges: 1.8% for AGIs below $10k , 0.8% for AGIs $10k-25k , 0.4% for AGIs $25k-50k , 0.4% for AGIs $50k-75k , 0.4% for AGIs $75k-100k , 1.1% for AGIs over 100k ) Taxable dividends: $972 (reported on 7.1% of returns )(% of AGI for various income ranges: 0.5% for AGIs below $10k , 0.3% for AGIs $10k-25k , 0.2% for AGIs $25k-50k , 0.3% for AGIs $50k-75k , 0.1% for AGIs $75k-100k , 0.2% for AGIs over 100k ) Net capital gain/loss: +$2,208 (reported on 3.5% of returns )Here:
+$2,208State:
+$8,532
(% of AGI for various income ranges: -0.2% for AGIs below $10k , -0.1% for AGIs $10k-25k , 0.1% for AGIs $25k-50k , 0.3% for AGIs $50k-75k , 0.4% for AGIs $75k-100k , 2.2% for AGIs over 100k ) Profit/loss from business: +$3,326 (reported on 11.0% of returns )Here:
+$3,326State:
+$9,547
(% of AGI for various income ranges: 7.0% for AGIs below $10k , 5.2% for AGIs $10k-25k , -0.1% for AGIs $25k-50k , 0.1% for AGIs $50k-75k , 0.0% for AGIs $75k-100k , -0.2% for AGIs over 100k ) IRA payment deduction: $1,860 (reported on 0.8% of returns )48228:
$1,860Michigan:
$2,875
Total itemized deductions: $14,420 (30% of AGI, reported on 29.7% of returns )Here:
$14,420State:
$18,509
Here:
29.9% of AGIState:
20.7% of AGI
(% of AGI for various income ranges: 7.3% for AGIs below $10k , 10.8% for AGIs $10k-25k , 16.0% for AGIs $25k-50k , 19.3% for AGIs $50k-75k , 16.9% for AGIs $75k-100k , 15.8% for AGIs over 100k ) Charity contributions deductions: $3,244 (6% of AGI, reported on 26.0% of returns )Here:
6.5% of AGIState:
3.6% of AGI
(% of AGI for various income ranges: 0.7% for AGIs below $10k , 1.4% for AGIs $10k-25k , 3.1% for AGIs $25k-50k , 3.9% for AGIs $50k-75k , 4.2% for AGIs $75k-100k , 4.2% for AGIs over 100k ) Total tax: $3,235 (reported on 58.5% of returns )(% of AGI for various income ranges: 2.7% for AGIs below $10k , 2.8% for AGIs $10k-25k , 5.2% for AGIs $25k-50k , 8.9% for AGIs $50k-75k , 10.9% for AGIs $75k-100k , 14.7% for AGIs over 100k ) Earned income credit: $2,107 (reported on 38.3% of returns )Percentage of individuals using paid preparers for their 2004 taxes: 66.2%(% for various income ranges: 64.6% for AGIs below $10k , 70.3% for AGIs $10k-25k , 64.4% for AGIs $25k-50k , 62.2% for AGIs $50k-75k , 64.7% for AGIs $75k-100k , 63.5% for AGIs over 100k )
Estimated median household income in 2022: This zip code:
$32,492Michigan:
$66,986
Nearest zip codes: 48227 ,
48126 ,
48223 ,
48128 ,
48120 ,
48124 .
Detroit Zip Code Map
Percentage of family households: This zip code:
44.2%Michigan:
43.3%
Percentage of households with unmarried partners: This zip code:
8.1%Michigan:
45.7%
Likely homosexual households (counted as self-reported same-sex unmarried-partner households)
Lesbian couples: 0.3% of all households Gay men: 0.2% of all households
Household received Food Stamps/SNAP in the past 12 months: 9,914Household did not receive Food Stamps/SNAP in the past 12 months: 10,160
Women who had a birth in the past 12 months: 888 (343 now married , 526 unmarried) Women who did not have a birth in the past 12 months: 12,557 (2,537 now married , 10,075 unmarried)
Housing units in zip code 48228 with a mortgage: 2,596 (194
second mortgage , 25
home equity loan , 135
both second mortgage and home equity loan )
Houses without a mortgage: 171
Median monthly owner costs for units with a mortgage: $1,089
Median monthly owner costs for units without a mortgage: $439
Residents with income below the poverty level in 2022:
This zip code:
38.6%Whole state:
13.4%
Residents with income below 50% of the poverty level in 2022:
This zip code:
17.0%Whole state:
6.9%
Median number of rooms in houses and condos: Median number of rooms in apartments: Notable locations in this zip code not listed on our city pages
Click to draw/clear zip code borders Notable locations in zip code 48228: (A) , West Maintenance Hub (B) , West Warren City Hall (C) , Westside Bus Terminal (D) , Thomas A Edison Library (E) , City of Detroit Fire Department Engine 55 Ladder 27 (F) , Herman Gardens Regional Sports Center (G) , Precinct 6 Police Station (H) . Display/hide their locations on the map
Shopping Center: (1) . Display/hide its location on the map
Churches in zip code 48228 include: (A) , Our Lady Gate of Heaven (B) , Prayer Temple Baptist Church (C) , United Gospel Temple Missionary Baptist Church (D) , Unity Fellowship Church of God in Christ (E) , Resurrection United Methodist Church (F) , Revelation Evangelical Lutheran Church (G) , Joy Road Missionary Baptist Church (H) , Kadesh Missionary Baptist Church (I) . Display/hide their locations on the map
Cemeteries: (1) , Ford Cemetery (2) . Display/hide their locations on the map
Parks in zip code 48228 include: (1) , Stoepel Park Number 2 (2) , Green Playground (3) , Lloyd H Ryan Playground (4) , Fitzpatrick Playground (5) . Display/hide their locations on the map
Year house built (houses)
0 2020 or later620 2010 to 2019546 2000 to 2009353 1990 to 1999659 1980 to 19891,274 1970 to 19791,732 1960 to 19696,724 1950 to 19596,352 1940 to 19493,938 1939 or earlier
Zip code 48228 household income distribution in 2022 3,559 Less than $10,0002,289 $10,000 to $14,9991,190 $15,000 to $19,9991,280 $20,000 to $24,999874 $25,000 to $29,9991,375 $30,000 to $34,9991,045 $35,000 to $39,999989 $40,000 to $44,999537 $45,000 to $49,9991,370 $50,000 to $59,9991,636 $60,000 to $74,9991,962 $75,000 to $99,999837 $100,000 to $124,999383 $125,000 to $149,999377 $150,000 to $199,999152 $200,000 or moreEstimate of home value of owner-occupied houses/condos in 2022 in zip code 48228 364 Less than $10,000677 $10,000 to $14,999423 $15,000 to $19,999501 $20,000 to $24,999547 $25,000 to $29,999570 $30,000 to $34,999304 $35,000 to $39,999811 $40,000 to $49,999934 $50,000 to $59,999945 $60,000 to $69,999557 $70,000 to $79,999464 $80,000 to $89,999259 $90,000 to $99,999480 $100,000 to $124,99947 $125,000 to $149,99953 $150,000 to $174,999104 $175,000 to $199,99941 $200,000 to $249,99974 $250,000 to $299,99925 $300,000 to $399,99921 $400,000 to $499,99968 $500,000 to $749,99913 $750,000 to $999,99917 $2,000,000 or moreRent paid by renters in 2022 in zip code 48228 93 Less than $10030 $100 to $149131 $150 to $199135 $200 to $24960 $250 to $299146 $300 to $34986 $350 to $399131 $400 to $449178 $450 to $499333 $500 to $549436 $550 to $599641 $600 to $649589 $650 to $6991,118 $700 to $749702 $750 to $7991,861 $800 to $8991,408 $900 to $999562 $1,000 to $1,24984 $1,250 to $1,49932 $1,500 to $1,99914 $2,000 to $2,49912 $2,500 to $2,999758 No cash rent
Median gross rent in 2022: $1,047.
Estimated median house (or condo) value in 2022 for: White Non-Hispanic householders: $52,768Black or African American householders: $54,425American Indian or Alaska Native householders: $82,839Asian householders: $63,537Some other race householders: $65,940Two or more races householders: $60,058Hispanic or Latino householders: $60,555Estimated median house or condo value in 2022: $54,343
48228:
$54,343Michigan:
$224,400
Lower value quartile - upper value quartile: $28,527 - $79,461
Mean price in 2022: Detached houses: $113,289Here:
$113,289State:
$280,038
Townhouses or other attached units: $167,441Here:
$167,441State:
$239,520
In 2-unit structures: $91,488Here:
$91,488State:
$219,481
In 3-to-4-unit structures: $135,167Here:
$135,167State:
$207,067
In 5-or-more-unit structures: $233,646Here:
$233,646State:
$192,733
Mobile homes: $46,622Here:
$46,622State:
$72,868
Housing units in structures:
One, detached: 17,799One, attached: 951Two: 5393 or 4: 6365 to 9: 58010 to 19: 1,05820 to 49: 56050 or more: 264Mobile homes: 133Unemployment : 13.8%
Means of transportation to work in zip code 48228 64.3% 11,637 Drove a car alone16.4% 2,975 Carpooled4.5% 814 Bus or trolley bus0.7% 134 Taxi0.2% 36 Motorcycle0.2% 33 Bicycle1.0% 177 Walked3.4% 618 Other means7.1% 1,286 Worked at homeTravel time to work (commute) in zip code 48228 142 Less than 5 minutes756 5 to 9 minutes2,056 10 to 14 minutes3,018 15 to 19 minutes2,460 20 to 24 minutes1,809 25 to 29 minutes3,237 30 to 34 minutes336 35 to 39 minutes372 40 to 44 minutes1,180 45 to 59 minutes531 60 to 89 minutes582 90 or more minutes
Neighborhoods in zip code 48228: Percentage of zip code residents living and working in this county: 76.3%
Household type by relationship:
Households: 54,540
Male householders: 7,979 (4,052 living alone ), Female householders: 11,590 (3,334 living alone )3,824 spouses (3,814 opposite-sex spouses ), 1,703 unmarried partners , (1,685 opposite-sex unmarried partners ), 20,548 children (19,344 natural , 214 adopted , 1,000 stepchildren ), 3,177 grandchildren , 1,537 brothers or sisters , 840 parents , 26 foster children , 1,205 other relatives , 1,626 non-relatives In group quarters: 239 (-1 institutionalized population )
Size of family households: 3,815 2-persons , 2,737 3-persons , 1,994 4-persons , 955 5-persons , 965 6-persons , 632 7-or-more-persons
Size of nonfamily households: 7,379 1-person , 855 2-persons , 116 3-persons , 46 4-persons
4,564 married couples with children. single-parent households (1,516 men , 7,194 women ).
83.4% of residents of 48228 zip code speak English at home. of residents speak Spanish at home (63% very well, 16% well, 20% not well, 2% not at all ).of residents speak other Indo-European language at home (59% very well, 30% well, 10% not well ).of residents speak Asian or Pacific Island language at home (80% very well, 20% well ).of residents speak other language at home (40% very well, 19% well, 23% not well, 18% not at all ).
Foreign born population: 4,218 (7.7%)
(58.7%
of them are naturalized citizens )
This zip code:
7.7%Whole state:
6.9%
24% Georgia 20% Saudi Arabia 17% United Arab Emirates 12% Honduras 5% Kuwait 3% Liberia 2% Israel 4% American 2% Syrian 2% Iraqi 2% Arab 1% Nigerian 1% Lebanese 1% Polish
Year of entry for the foreign-born population
2,987 2010 or later 1,111 2000 to 2009 803 1990 to 1999 557 Before 1990
There are
62 Medical Specialists in Zip Code 48228 .
Major facilities with environmental interests located in this zip code:
AMERICAN RENOVATING COMPANY (9201 FREELAND in DETROIT, MI)
AIR SYNTHETIC MINOR (AIRS/AFS) (Integrated Compliance Information System) - ICIS-05-1999-0619, FORMAL ENFORCEMENT ACTION (Resource Conservation and Recovery Act (tracking hazardous waste)) Business SIC classification: REPAIR SHOPS AND RELATED SERVICES
GARDNER ELEMENTARY SCHOOL (6528 MANSFIELD STREET in DETROIT, MI)
(National Center for Education Statistics) - STATE ID-01362 (Resource Conservation and Recovery Act (tracking hazardous waste)) Organizations: DETROIT PUBLIC SCHOOLS (CONTACT/OWNER)
, DETROIT CITY SCHOOL DISTRICT (SCHOOL DISTRICT)
Alternative names: GARDNER ELEM SCHOOL
FARMER JACK (18718 BORMAN AVE in DETROIT, MI)
(Integrated Compliance Information System) - ICIS-05-1998-0600, FORMAL ENFORCEMENT ACTION (Resource Conservation and Recovery Act (tracking hazardous waste)) Business SIC classification: GROCERY STORESOrganizations: BORMANS INC (CONTACT/OWNER)
EPPERT OIL COMPANY (9100 FREELAND STREET in DETROIT, MI)
OIL CONTROL (Facility Response Plan for oil discharge) HAZARDOUS WASTE BIENNIAL REPORTER (Resource Conservation and Recovery Act (tracking hazardous waste)) Large Quantity Generators, more that 1000 kg of hazardous waste/month (Resource Conservation and Recovery Act (tracking hazardous waste)) TRI REPORTER (Tracking of toxic chemicals releasing facilities) Business SIC classification: LUBRICATING OILS AND GREASESBusiness NAICS classification: PETROLEUM LUBRICATING OIL AND GREASE MANUFACTURING.Organizations: D.A. STUART COMPANY (CONTACT/GENERAL)
, D A STUART CO (CONTACT/OPERATOR)
, VERLIN EPPERT (PROPERTY OWNER) (CONTACT/OWNER)
Alternative names: D.A. STUART CO., D.A. STUART COMPANY DETROIT, D.A.STUART CO. (FREELAND FACILITY), STUART D A CO-FREELAND FACILITY
DETROIT CITY OF (1126 CITY COUNTY BLDG in DETROIT, MI)
(Integrated Compliance Information System) - ICIS-05-1998-0803, FORMAL ENFORCEMENT ACTION COMPLIANCE ACTIVITY (Tracking inspections of insecticide, fungicide, and rodenticide, and toxic substances) Business SIC classification: AIR AND WATER RESOURCE AND SOLID WASTE MANAGEMENT
DETROIT COMMUNITY HIGH SCHOOL (9331 GRANDVILLE AVENUE in DETROIT, MI)
(National Center for Education Statistics) - STATE ID-08456
DIXON ELEMENTARY SCHOOL (19600 TIREMAN STREET in DETROIT, MI)
(National Center for Education Statistics) - STATE ID-00925 Organizations: DETROIT CITY SCHOOL DISTRICT (SCHOOL DISTRICT)
CHEM-STRIP INC (12430 EVERGREEN ROAD in DETROIT, MI)
SUPERFUND (Superfund database) COMPLIANCE ACTIVITY (Tracking inspections of insecticide, fungicide, and rodenticide, and toxic substances) HAZARDOUS WASTE BIENNIAL REPORTER (Resource Conservation and Recovery Act (tracking hazardous waste)) Large Quantity Generators, more that 1000 kg of hazardous waste/month (Resource Conservation and Recovery Act (tracking hazardous waste)) TRI REPORTER (Tracking of toxic chemicals releasing facilities) Business SIC classification: SPECIAL TRADE CONTRACTORSAlternative names: CHEM STRIP FIRE, CLEM STRIP FIRE
GIBRALTER NATIONAL CORP (8951 SCHAEFER HWY in DETROIT, MI)
AIR SYNTHETIC MINOR (AIRS/AFS) CRITERIA AND HAZARDOUS AIR POLLUTANT INVENTORY (Inventory of air pollution sources) (Resource Conservation and Recovery Act (tracking hazardous waste)) Business SIC classification: CEMENT, HYDRAULICBusiness NAICS classification: CEMENT MANUFACTURING.Organizations: DESERT SANDS INC (CONTACT/OPERATOR)
Alternative names: GIBRALTAR NATIONAL CORPORATION
GREAT ATLANTIC AND PACIFIC TEA CO (12334 BURT RD in DETROIT, MI)
(Resource Conservation and Recovery Act (tracking hazardous waste)) Organizations: RICHARD H NIEHAUS (CONTACT/OPERATOR)
MI DEPT/TRANSPORTATION BRIDGE (M-39 UNDER PLYMOUTH RD in DETROIT, MI)
(Resource Conservation and Recovery Act (tracking hazardous waste)) Organizations: MICH DEPT OF TRANSPORTATION (CONTACT/OPERATOR)
Alternative names: MIDOT BRIDGE M-39 UNDER PLYMOUTH RD
FALCON HOLDINGS (15525 CHICAGO AVE in DETROIT, MI)
(Resource Conservation and Recovery Act (tracking hazardous waste)) Business NAICS classification: LIMITED-SERVICE RESTAURANTS.Organizations: FALCON HOLDINGS LLC (CONTACT/OPERATOR)
Housing units lacking complete plumbing facilities: 8.8%
Housing units lacking complete kitchen facilities: 10.4%
79.7% Utility gas 16.5% Electricity 2.3% Bottled, tank, or LP gas 1.3% No fuel used
Population in 1990: 67,215.
Place of birth for U.S.-born residents:
This state: 42,150Northeast: 912Midwest: 1,112South: 4,516West: 438
62% of the 48228 zip code residents lived in the same house 5 years ago.
Out of people who lived in different houses, 86% lived in this county.
Out of people who lived in different counties, 50% lived in Michigan.
89% of the 48228 zip code residents lived in the same house 1 year ago.
Out of people who lived in different houses, 74% moved from this county.
Out of people who lived in different houses, 7% moved from different county within same state.
Out of people who lived in different houses, 11% moved from different state.
Out of people who lived in different houses, 7% moved from abroad.
Private vs. public school enrollment:
Students in private schools in grades 1 to 8 (elementary and middle school): 504
Students in private schools in grades 9 to 12 (high school): 355
Students in private undergraduate colleges: 332
Occupation by median earnings in the past 12 months ($)
85,607 Health diagnosing and treating practitioners and other technical occupations 82,984 Law enforcement workers including supervisors 63,418 Legal occupations 58,928 Architecture and engineering occupations 57,329 Community and social service occupations 56,682 Management occupations
Companies with federal contracts located in this zip code:
METRO PACKAGING INC (19000 FITZPATRICK in DETROIT, MI; small business) in 30 contracts from 2003 to 2006
Contracts for Diesel Engines and Components, Packing and Gasket Materials, Vehicular Power Transmission Components, Pipe, Tube and Rigid Tubing, and more by Defense Logistics Agency, ArmySigned by year: 2000: $0; 2001: $0; 2002: $0; 2003: $245,177; 2004: $394,179; 2005: $538,079; 2006: $12,379.
Biggest contracts: with Defense Logistics Agency for Diesel Engines and Components. Signed on 2005-06-07. Completion date: 2005-06-07.
with Defense Logistics Agency for Packing and Gasket Materials. Taking place in MD. Signed on 2004-03-09. Completion date: 2004-04-10.
with Defense Logistics Agency for Packing and Gasket Materials. Signed on 2005-05-19. Completion date: 2005-07-28.
, same as above. Signed on 2004-12-04. Completion date: 2005-02-02.
AERFLOW VENTILATING CO INC (18610 FITZPATRICK in DETROIT, MI; small business)
$9,291 with Army for Maintenance, Repair or Alteration of Real Property -- Other Administrative Facilities and Service Buildings. Signed on 2001-09-24. Completion date: 2001-11-23.
Top industries in this zip code by the number of employees in 2005:
Accommodation and Food Services: Limited-Service Restaurants (50-99 employees: 1 establishment, 20-49 employees: 5 establishments, 10-19 employees: 2 establishments, 5-9 employees: 4 establishments, 1-4 employees: 11 establishments)Accommodation and Food Services: Full-Service Restaurants (100-249: 1, 50-99: 1, 20-49: 1, 5-9: 3, 1-4: 7)Accommodation and Food Services: Hotels (except Casino Hotels) and Motels (100-249: 1, 20-49: 1)Wholesale Trade: Other Grocery and Related Products Merchant Wholesalers (100-249: 1, 1-4: 2)Wholesale Trade: Packaged Frozen Food Merchant Wholesalers (100-249: 1)Other Services (except Public Administration): Religious Organizations (20-49: 1, 10-19: 4, 5-9: 5, 1-4: 9)Health Care and Social Assistance: Other Residential Care Facilities (50-99: 1, 20-49: 2, 1-4: 1)
People in group quarters in 2010:
222 people in nursing facilities/skilled-nursing facilities
40 people in residential treatment centers for juveniles (non-correctional)
40 people in residential treatment centers for adults
17 people in group homes for juveniles (non-correctional)
15 people in group homes intended for adults
3 people in correctional residential facilities
3 people in other noninstitutional facilities
People in group quarters in 2000:
237 people in nursing homes
27 people in homes for abused, dependent, and neglected children
22 people in unknown juvenile institutions
14 people in homes for the mentally ill
10 people in religious group quarters
6 people in homes for the mentally retarded
5 people in other group homes
Fatal accident statistics in 2014:
Fatal accident count: 7Vehicles involved in fatal accidents: 11Fatal accidents caused by drunken drivers: 0Fatalities: 8Persons involved in fatal accidents: 19Pedestrians involved in fatal accidents: 2
Fatal accident statistics in 2013:
Fatal accident count: 5Vehicles involved in fatal accidents: 11Fatal accidents caused by drunken drivers: 0Fatalities: 5Persons involved in fatal accidents: 12Pedestrians involved in fatal accidents: 4
Home Mortgage Disclosure Act Aggregated Statistics For Year 2009(Based on 28 full and 6 partial tracts) A) FHA, FSA/RHS & VA B) Conventional C) Refinancings D) Home Improvement Loans E) Loans on Dwellings For 5+ Families F) Non-occupant Loans on G) Loans On Manufactured Number Average Value Number Average Value Number Average Value Number Average Value Number Average Value Number Average Value Number Average Value
LOANS ORIGINATED 50 $49,860 58 $60,359 145 $67,418 47 $9,347 6 $1,137,712 75 $58,883 0 $0 APPLICATIONS APPROVED, NOT ACCEPTED 12 $65,468 22 $61,373 30 $68,732 7 $10,399 0 $0 18 $61,785 0 $0 APPLICATIONS DENIED 69 $61,967 95 $62,263 213 $61,829 185 $20,875 0 $0 111 $54,280 2 $66,745 APPLICATIONS WITHDRAWN 12 $62,747 11 $51,280 65 $69,278 7 $23,571 0 $0 13 $49,398 0 $0 FILES CLOSED FOR INCOMPLETENESS 8 $69,245 11 $78,726 18 $64,458 7 $24,460 0 $0 9 $60,036 0 $0
Aggregated Statistics For Year 2008(Based on 28 full and 6 partial tracts) A) FHA, FSA/RHS & VA B) Conventional C) Refinancings D) Home Improvement Loans E) Loans on Dwellings For 5+ Families F) Non-occupant Loans on G) Loans On Manufactured Number Average Value Number Average Value Number Average Value Number Average Value Number Average Value Number Average Value Number Average Value
LOANS ORIGINATED 70 $61,433 305 $69,260 302 $69,078 78 $18,820 4 $1,658,005 219 $58,318 4 $50,735 APPLICATIONS APPROVED, NOT ACCEPTED 8 $58,770 66 $72,485 85 $78,866 20 $18,177 2 $398,320 24 $56,477 0 $0 APPLICATIONS DENIED 74 $67,763 553 $76,817 1,011 $75,491 379 $28,223 0 $0 471 $64,954 13 $79,457 APPLICATIONS WITHDRAWN 37 $79,157 72 $75,383 241 $83,063 16 $53,657 0 $0 53 $63,743 0 $0 FILES CLOSED FOR INCOMPLETENESS 7 $91,617 53 $73,622 55 $75,445 12 $44,852 0 $0 46 $64,076 0 $0
Aggregated Statistics For Year 2007(Based on 28 full and 6 partial tracts) A) FHA, FSA/RHS & VA B) Conventional C) Refinancings D) Home Improvement Loans E) Loans on Dwellings For 5+ Families F) Non-occupant Loans on G) Loans On Manufactured Number Average Value Number Average Value Number Average Value Number Average Value Number Average Value Number Average Value Number Average Value
LOANS ORIGINATED 46 $80,688 1,171 $73,329 1,030 $72,368 175 $35,194 1 $190,160 692 $65,523 4 $38,865 APPLICATIONS APPROVED, NOT ACCEPTED 3 $90,963 488 $75,819 412 $80,116 42 $29,978 0 $0 238 $69,028 0 $0 APPLICATIONS DENIED 35 $84,449 1,795 $79,719 2,315 $81,964 639 $35,018 0 $0 1,066 $74,285 15 $36,922 APPLICATIONS WITHDRAWN 15 $84,143 270 $77,451 543 $82,339 46 $54,174 0 $0 175 $67,890 0 $0 FILES CLOSED FOR INCOMPLETENESS 3 $77,790 130 $82,125 153 $89,640 9 $37,399 1 $432,000 62 $67,413 0 $0
Aggregated Statistics For Year 2006(Based on 28 full and 6 partial tracts) A) FHA, FSA/RHS & VA B) Conventional C) Refinancings D) Home Improvement Loans E) Loans on Dwellings For 5+ Families F) Non-occupant Loans on G) Loans On Manufactured Number Average Value Number Average Value Number Average Value Number Average Value Number Average Value Number Average Value Number Average Value
LOANS ORIGINATED 83 $84,887 2,638 $66,467 1,985 $71,854 223 $30,723 1 $214,920 1,326 $62,216 2 $106,000 APPLICATIONS APPROVED, NOT ACCEPTED 17 $87,930 1,068 $69,304 799 $75,996 79 $33,958 0 $0 421 $68,278 0 $0 APPLICATIONS DENIED 40 $88,004 2,822 $72,618 3,224 $83,134 639 $31,244 1 $386,000 1,347 $72,062 13 $55,098 APPLICATIONS WITHDRAWN 28 $76,978 880 $76,902 1,247 $81,283 71 $65,000 0 $0 426 $68,235 0 $0 FILES CLOSED FOR INCOMPLETENESS 3 $84,430 187 $74,951 429 $86,359 12 $52,425 0 $0 81 $71,436 0 $0
Aggregated Statistics For Year 2005(Based on 28 full and 6 partial tracts) A) FHA, FSA/RHS & VA B) Conventional C) Refinancings D) Home Improvement Loans E) Loans on Dwellings For 5+ Families F) Non-occupant Loans on G) Loans On Manufactured Number Average Value Number Average Value Number Average Value Number Average Value Number Average Value Number Average Value Number Average Value
LOANS ORIGINATED 251 $88,477 2,806 $64,503 2,741 $74,475 263 $43,573 6 $935,755 1,476 $64,142 4 $58,785 APPLICATIONS APPROVED, NOT ACCEPTED 22 $83,480 1,188 $67,159 943 $76,266 87 $53,889 0 $0 407 $63,514 0 $0 APPLICATIONS DENIED 75 $90,986 2,544 $70,023 3,694 $80,309 553 $37,131 2 $264,990 1,157 $65,376 13 $61,575 APPLICATIONS WITHDRAWN 45 $85,885 934 $80,851 1,821 $90,952 202 $125,128 2 $47,500 466 $79,828 3 $111,043 FILES CLOSED FOR INCOMPLETENESS 15 $92,271 216 $70,773 483 $83,453 22 $49,683 0 $0 103 $67,390 0 $0
Aggregated Statistics For Year 2004(Based on 28 full and 6 partial tracts) A) FHA, FSA/RHS & VA B) Conventional C) Refinancings D) Home Improvement Loans E) Loans on Dwellings For 5+ Families F) Non-occupant Loans on G) Loans On Manufactured Number Average Value Number Average Value Number Average Value Number Average Value Number Average Value Number Average Value Number Average Value
LOANS ORIGINATED 374 $87,243 1,989 $66,966 3,146 $72,684 271 $35,932 4 $666,490 1,146 $60,855 10 $63,720 APPLICATIONS APPROVED, NOT ACCEPTED 40 $85,828 832 $68,953 1,123 $75,877 43 $33,805 0 $0 399 $63,939 2 $71,750 APPLICATIONS DENIED 123 $87,560 1,343 $71,710 2,992 $77,471 537 $27,523 2 $799,520 620 $62,249 8 $54,856 APPLICATIONS WITHDRAWN 36 $85,357 404 $72,454 1,526 $79,783 75 $49,655 1 $63,390 200 $67,044 0 $0 FILES CLOSED FOR INCOMPLETENESS 29 $86,614 122 $76,523 364 $82,707 8 $32,764 0 $0 56 $64,044 0 $0
Aggregated Statistics For Year 2003(Based on 28 full and 6 partial tracts) A) FHA, FSA/RHS & VA B) Conventional C) Refinancings D) Home Improvement Loans E) Loans on Dwellings For 5+ Families F) Non-occupant Loans on Number Average Value Number Average Value Number Average Value Number Average Value Number Average Value Number Average Value
LOANS ORIGINATED 502 $89,420 1,276 $72,057 3,765 $70,440 270 $16,519 6 $320,738 789 $57,969 APPLICATIONS APPROVED, NOT ACCEPTED 34 $82,933 546 $68,139 1,159 $70,569 103 $20,991 0 $0 252 $61,586 APPLICATIONS DENIED 107 $85,116 845 $72,708 2,813 $71,391 646 $12,204 0 $0 455 $60,859 APPLICATIONS WITHDRAWN 80 $88,011 302 $72,595 1,345 $76,898 51 $30,125 0 $0 148 $66,520 FILES CLOSED FOR INCOMPLETENESS 43 $88,501 108 $75,132 254 $74,769 11 $25,215 1 $51,000 42 $55,005
Aggregated Statistics For Year 2002(Based on 28 full and 6 partial tracts) A) FHA, FSA/RHS & VA B) Conventional C) Refinancings D) Home Improvement Loans E) Loans on Dwellings For 5+ Families F) Non-occupant Loans on Number Average Value Number Average Value Number Average Value Number Average Value Number Average Value Number Average Value
LOANS ORIGINATED 689 $83,871 990 $66,413 3,139 $66,395 303 $11,428 2 $523,525 589 $56,001 APPLICATIONS APPROVED, NOT ACCEPTED 32 $80,672 299 $66,276 953 $66,808 111 $20,920 0 $0 153 $56,195 APPLICATIONS DENIED 124 $81,972 482 $68,552 2,671 $64,589 686 $8,868 0 $0 321 $52,359 APPLICATIONS WITHDRAWN 97 $85,818 252 $71,996 1,244 $67,587 38 $25,067 0 $0 125 $54,138 FILES CLOSED FOR INCOMPLETENESS 17 $78,059 97 $69,437 401 $69,681 6 $15,798 0 $0 38 $55,550
Aggregated Statistics For Year 2001(Based on 28 full and 6 partial tracts) A) FHA, FSA/RHS & VA B) Conventional C) Refinancings D) Home Improvement Loans E) Loans on Dwellings For 5+ Families F) Non-occupant Loans on Number Average Value Number Average Value Number Average Value Number Average Value Number Average Value Number Average Value
LOANS ORIGINATED 889 $79,106 855 $63,788 3,399 $63,325 418 $11,916 11 $501,972 529 $50,337 APPLICATIONS APPROVED, NOT ACCEPTED 37 $74,675 184 $67,092 801 $59,055 158 $16,126 0 $0 127 $47,075 APPLICATIONS DENIED 164 $78,488 514 $59,017 3,056 $57,678 1,088 $10,187 4 $473,102 262 $49,947 APPLICATIONS WITHDRAWN 125 $72,744 168 $62,999 1,346 $59,799 74 $25,027 4 $140,472 107 $55,868 FILES CLOSED FOR INCOMPLETENESS 25 $82,709 27 $53,372 389 $64,523 12 $17,128 0 $0 25 $60,742
Aggregated Statistics For Year 2000(Based on 28 full and 6 partial tracts) A) FHA, FSA/RHS & VA B) Conventional C) Refinancings D) Home Improvement Loans E) Loans on Dwellings For 5+ Families F) Non-occupant Loans on Number Average Value Number Average Value Number Average Value Number Average Value Number Average Value Number Average Value
LOANS ORIGINATED 713 $76,486 748 $61,058 2,121 $54,036 542 $9,365 3 $269,693 379 $44,385 APPLICATIONS APPROVED, NOT ACCEPTED 39 $68,109 167 $62,029 731 $53,863 321 $14,064 0 $0 96 $41,346 APPLICATIONS DENIED 151 $76,298 546 $85,382 2,332 $51,048 1,408 $11,275 7 $1,124,736 310 $46,466 APPLICATIONS WITHDRAWN 95 $70,004 250 $57,362 1,085 $51,398 91 $28,725 0 $0 102 $48,240 FILES CLOSED FOR INCOMPLETENESS 36 $65,943 43 $59,224 239 $57,984 11 $22,342 0 $0 21 $69,174
Aggregated Statistics For Year 1999(Based on 18 full and 3 partial tracts) A) FHA, FSA/RHS & VA B) Conventional C) Refinancings D) Home Improvement Loans E) Loans on Dwellings For 5+ Families F) Non-occupant Loans on Number Average Value Number Average Value Number Average Value Number Average Value Number Average Value Number Average Value
LOANS ORIGINATED 522 $67,332 376 $84,806 1,821 $51,270 334 $13,498 2 $249,420 252 $41,022 APPLICATIONS APPROVED, NOT ACCEPTED 18 $63,908 76 $52,171 529 $47,919 177 $15,228 0 $0 67 $43,066 APPLICATIONS DENIED 70 $65,806 216 $56,298 1,502 $47,158 736 $11,419 1 $490,000 151 $44,072 APPLICATIONS WITHDRAWN 68 $66,650 130 $60,318 836 $46,685 46 $19,825 2 $652,155 76 $39,199 FILES CLOSED FOR INCOMPLETENESS 9 $60,401 11 $53,154 271 $47,815 8 $22,858 0 $0 17 $41,548
Private Mortgage Insurance Companies Aggregated Statistics For Year 2009(Based on 10 full and 4 partial tracts) A) Conventional C) Non-occupant Loans on Number Average Value Number Average Value
LOANS ORIGINATED 2 $62,345 0 $0 APPLICATIONS APPROVED, NOT ACCEPTED 9 $75,697 0 $0 APPLICATIONS DENIED 0 $0 0 $0 APPLICATIONS WITHDRAWN 3 $14,000 0 $0 FILES CLOSED FOR INCOMPLETENESS 2 $86,590 2 $86,590
Aggregated Statistics For Year 2008(Based on 26 full and 6 partial tracts) A) Conventional B) Refinancings C) Non-occupant Loans on Number Average Value Number Average Value Number Average Value
LOANS ORIGINATED 121 $83,133 16 $80,082 19 $68,254 APPLICATIONS APPROVED, NOT ACCEPTED 210 $83,649 42 $91,309 30 $76,139 APPLICATIONS DENIED 34 $87,137 4 $78,250 12 $85,590 APPLICATIONS WITHDRAWN 8 $86,776 2 $112,930 2 $72,500 FILES CLOSED FOR INCOMPLETENESS 23 $94,996 4 $100,980 14 $98,496
Aggregated Statistics For Year 2007(Based on 28 full and 6 partial tracts) A) Conventional B) Refinancings C) Non-occupant Loans on Number Average Value Number Average Value Number Average Value
LOANS ORIGINATED 519 $84,222 147 $88,928 136 $78,391 APPLICATIONS APPROVED, NOT ACCEPTED 103 $76,958 72 $93,546 48 $79,752 APPLICATIONS DENIED 41 $82,639 14 $89,576 28 $75,410 APPLICATIONS WITHDRAWN 50 $81,645 15 $88,614 16 $81,572 FILES CLOSED FOR INCOMPLETENESS 3 $79,113 0 $0 1 $48,000
Aggregated Statistics For Year 2006(Based on 28 full and 6 partial tracts) A) Conventional B) Refinancings C) Non-occupant Loans on Number Average Value Number Average Value Number Average Value
LOANS ORIGINATED 241 $75,595 129 $88,510 97 $67,850 APPLICATIONS APPROVED, NOT ACCEPTED 74 $76,393 54 $92,879 12 $66,477 APPLICATIONS DENIED 9 $86,783 7 $90,879 8 $93,798 APPLICATIONS WITHDRAWN 34 $72,990 14 $90,621 10 $47,991 FILES CLOSED FOR INCOMPLETENESS 3 $79,167 1 $76,000 3 $79,167
Aggregated Statistics For Year 2005(Based on 28 full and 6 partial tracts) A) Conventional B) Refinancings C) Non-occupant Loans on Number Average Value Number Average Value Number Average Value
LOANS ORIGINATED 256 $79,117 151 $87,454 97 $70,335 APPLICATIONS APPROVED, NOT ACCEPTED 103 $79,065 73 $86,480 32 $72,491 APPLICATIONS DENIED 11 $67,055 4 $96,545 8 $68,708 APPLICATIONS WITHDRAWN 29 $79,330 28 $90,657 14 $63,740 FILES CLOSED FOR INCOMPLETENESS 8 $60,939 10 $86,188 8 $66,626
Aggregated Statistics For Year 2004(Based on 28 full and 6 partial tracts) A) Conventional B) Refinancings C) Non-occupant Loans on Number Average Value Number Average Value Number Average Value
LOANS ORIGINATED 464 $75,560 165 $88,036 190 $65,265 APPLICATIONS APPROVED, NOT ACCEPTED 161 $81,490 83 $85,820 49 $64,392 APPLICATIONS DENIED 16 $70,564 6 $83,423 3 $45,000 APPLICATIONS WITHDRAWN 40 $81,171 14 $86,581 19 $64,026 FILES CLOSED FOR INCOMPLETENESS 2 $118,930 4 $76,850 0 $0
Aggregated Statistics For Year 2003(Based on 28 full and 6 partial tracts) A) Conventional B) Refinancings C) Non-occupant Loans on Number Average Value Number Average Value Number Average Value
LOANS ORIGINATED 497 $78,803 282 $87,247 121 $62,130 APPLICATIONS APPROVED, NOT ACCEPTED 181 $76,325 134 $85,666 38 $62,750 APPLICATIONS DENIED 37 $82,976 10 $87,558 9 $83,783 APPLICATIONS WITHDRAWN 46 $74,946 21 $91,330 12 $53,134 FILES CLOSED FOR INCOMPLETENESS 0 $0 0 $0 0 $0
Aggregated Statistics For Year 2002(Based on 28 full and 6 partial tracts) A) Conventional B) Refinancings C) Non-occupant Loans on Number Average Value Number Average Value Number Average Value
LOANS ORIGINATED 412 $75,834 255 $85,050 96 $63,822 APPLICATIONS APPROVED, NOT ACCEPTED 100 $75,743 131 $81,793 32 $66,098 APPLICATIONS DENIED 25 $70,704 18 $87,568 12 $63,830 APPLICATIONS WITHDRAWN 42 $78,058 35 $80,795 19 $60,622 FILES CLOSED FOR INCOMPLETENESS 7 $71,693 0 $0 2 $63,915
Aggregated Statistics For Year 2001(Based on 28 full and 6 partial tracts) A) Conventional B) Refinancings C) Non-occupant Loans on Number Average Value Number Average Value Number Average Value
LOANS ORIGINATED 328 $71,649 224 $81,058 87 $52,454 APPLICATIONS APPROVED, NOT ACCEPTED 65 $77,216 115 $81,644 21 $66,286 APPLICATIONS DENIED 17 $74,476 14 $73,639 3 $67,353 APPLICATIONS WITHDRAWN 17 $69,981 12 $80,240 4 $66,178 FILES CLOSED FOR INCOMPLETENESS 4 $70,235 3 $85,540 2 $47,830
Aggregated Statistics For Year 2000(Based on 28 full and 6 partial tracts) A) Conventional B) Refinancings C) Non-occupant Loans on Number Average Value Number Average Value Number Average Value
LOANS ORIGINATED 310 $67,531 202 $60,023 62 $45,148 APPLICATIONS APPROVED, NOT ACCEPTED 41 $66,636 31 $67,456 8 $42,815 APPLICATIONS DENIED 19 $51,810 14 $79,926 12 $41,955 APPLICATIONS WITHDRAWN 12 $63,652 4 $66,390 5 $49,864 FILES CLOSED FOR INCOMPLETENESS 3 $72,157 0 $0 0 $0
Aggregated Statistics For Year 1999(Based on 18 full and 3 partial tracts) A) Conventional B) Refinancings C) Non-occupant Loans on Number Average Value Number Average Value Number Average Value
LOANS ORIGINATED 160 $58,861 82 $61,613 18 $46,540 APPLICATIONS APPROVED, NOT ACCEPTED 15 $65,430 13 $61,422 1 $51,850 APPLICATIONS DENIED 9 $71,838 10 $61,992 4 $58,232 APPLICATIONS WITHDRAWN 3 $52,190 0 $0 1 $26,920 FILES CLOSED FOR INCOMPLETENESS 0 $0 2 $56,000 0 $0
2002 - 2018 National Fire Incident Reporting System (NFIRS) incidents See full 2006 National Fire Incident Reporting System statistics for zip code 48228, Michigan
Most common first names in zip code 48228 among deceased individuals Name Count Lived (average)
John 852 73.4 years Mary 658 78.4 years Joseph 466 73.3 years William 428 73.0 years James 408 69.4 years Frank 338 74.9 years Helen 331 76.5 years Edward 295 71.0 years Anna 290 80.2 years Walter 269 73.2 years
Most common last names in zip code 48228 among deceased individuals Last name Count Lived (average)
Smith 170 70.3 years Williams 156 69.8 years Jones 131 70.6 years Johnson 130 70.2 years Brown 90 71.6 years Davis 81 71.5 years Miller 79 69.5 years Jackson 78 66.7 years Harris 72 68.8 years Thomas 71 70.6 years
Businesses in zip code 48228
Name Count Name Count
Advance Auto Parts 1 Marriott 1 AutoZone 1 McDonald's 1 Burger King 2 Pizza Hut 1 CVS 2 Popeyes 1 Church's Chicken 1 Red Robin 1 DHL 1 Taco Bell 1 Dairy Queen 1 U-Haul 2 H&R Block 2 Walgreens 1 Hilton 1 Wendy's 1 Little Caesars Pizza 1 White Castle 1

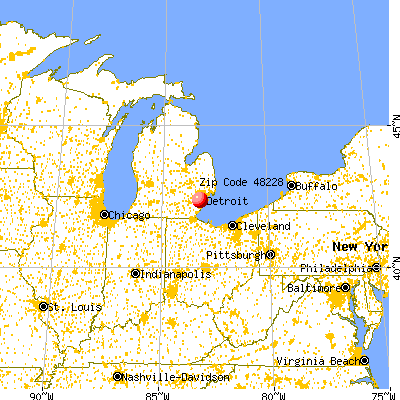


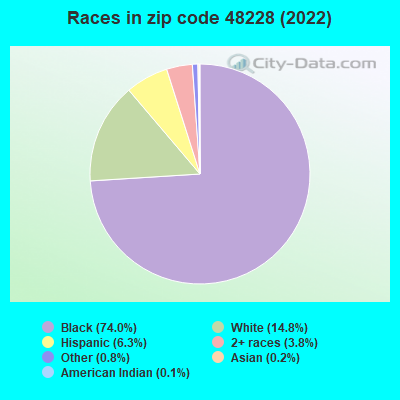


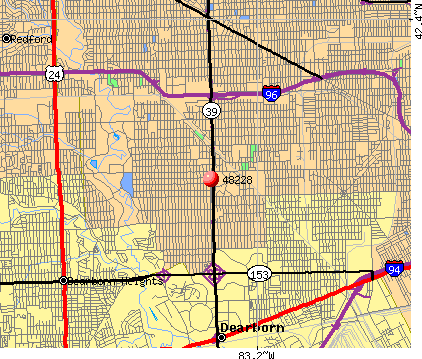 Nearest zip codes: 48227, 48126, 48223, 48128, 48120, 48124.
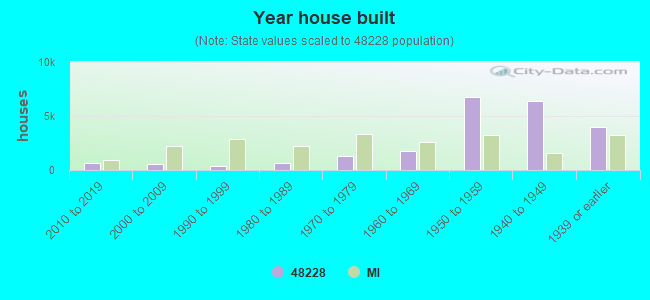

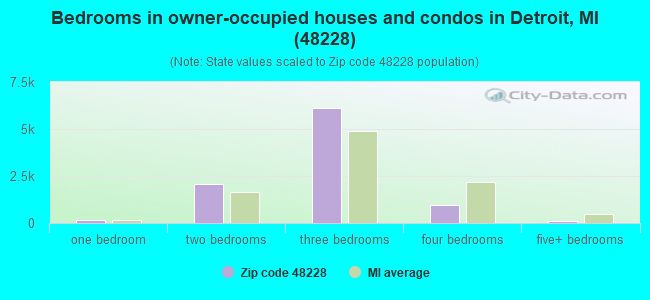
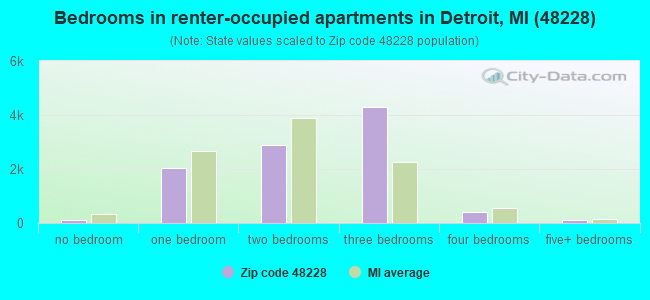
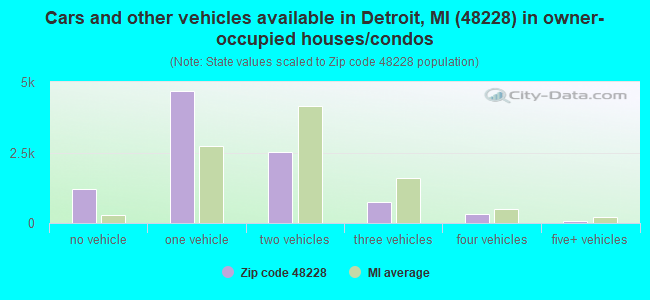
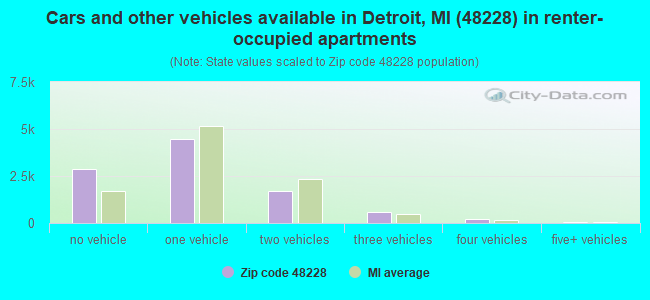


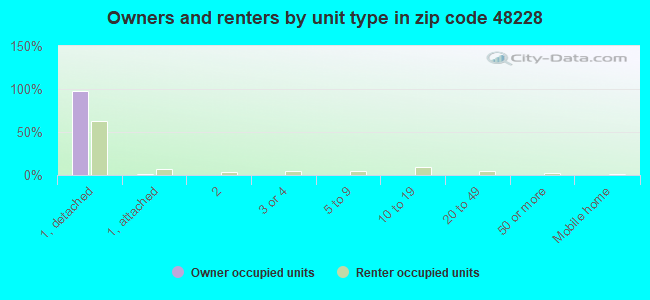
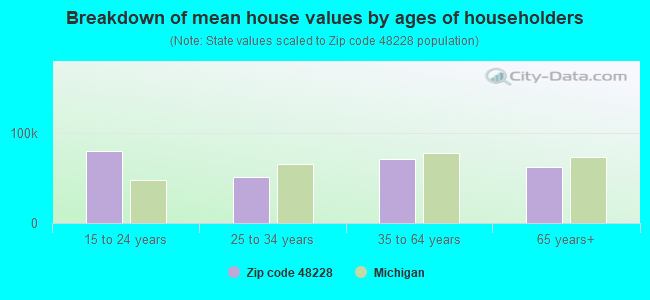


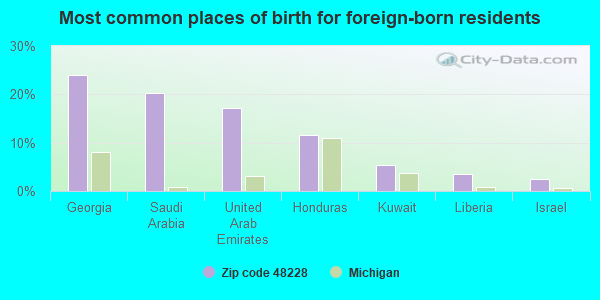
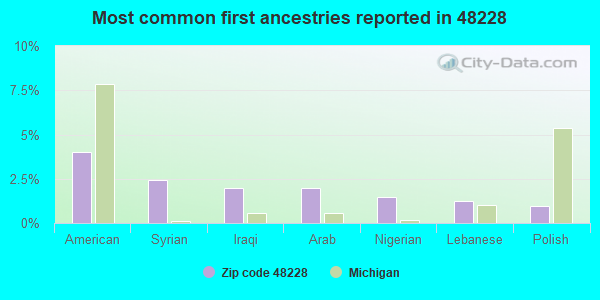
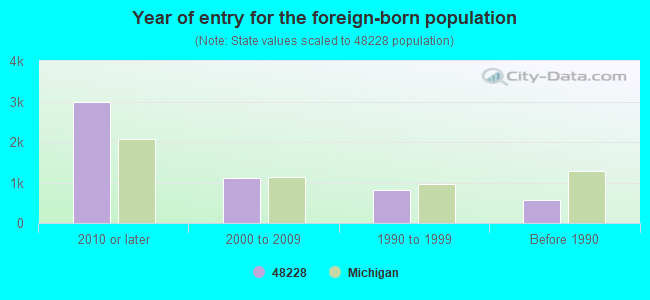


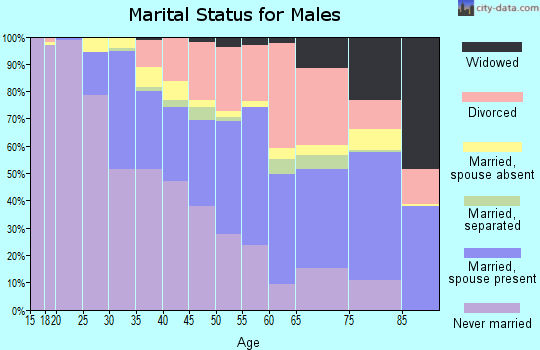
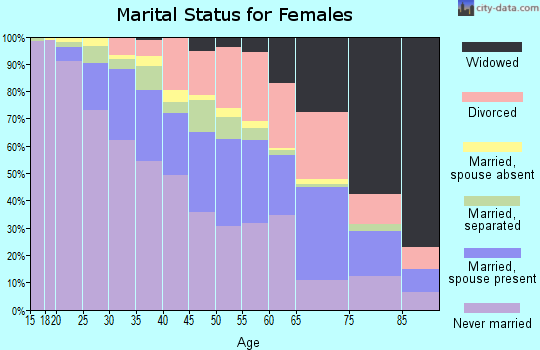
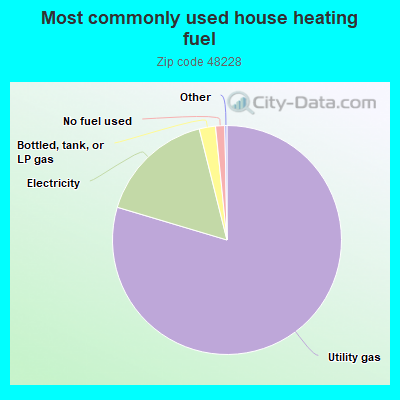
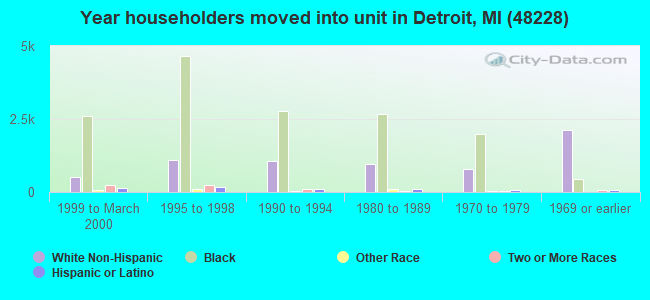
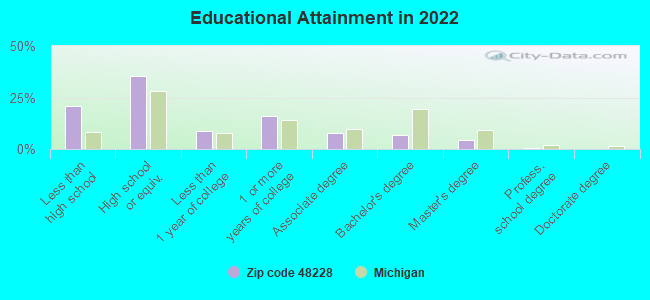
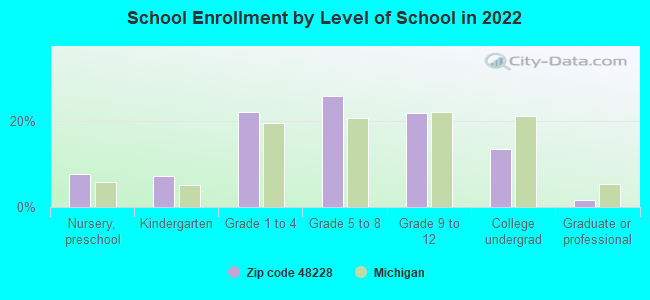
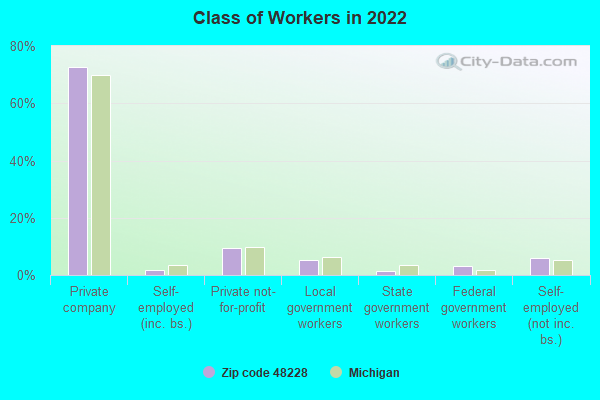
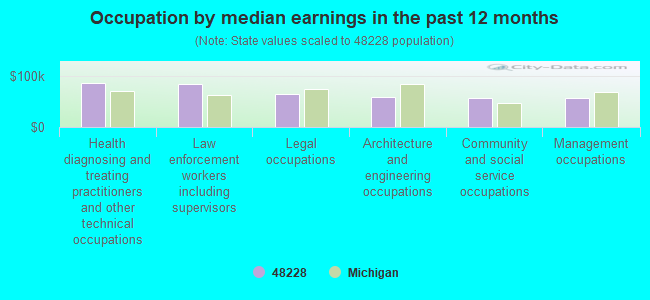
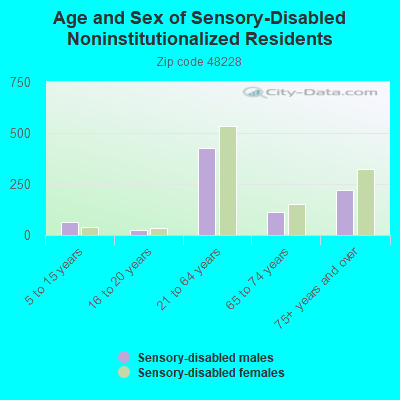
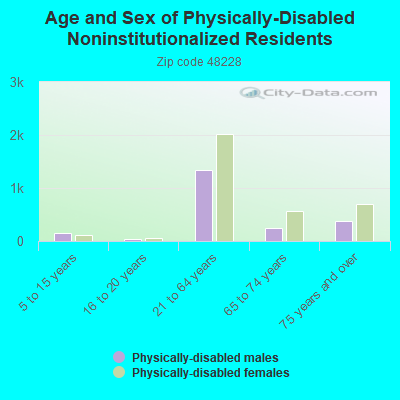
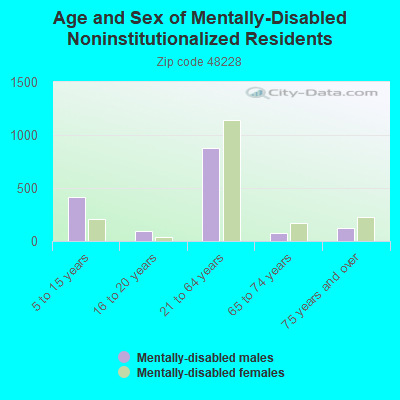
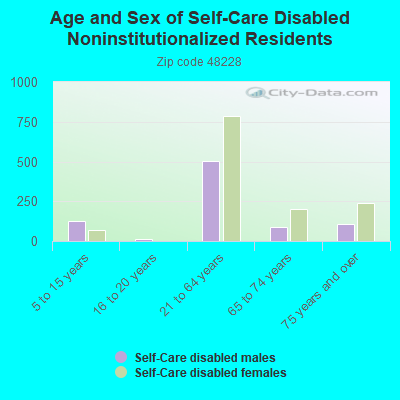
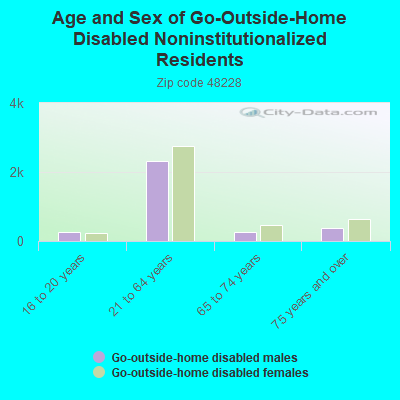
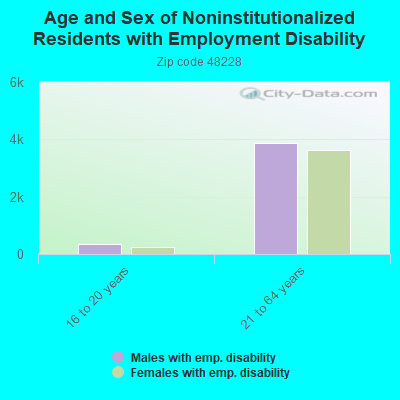
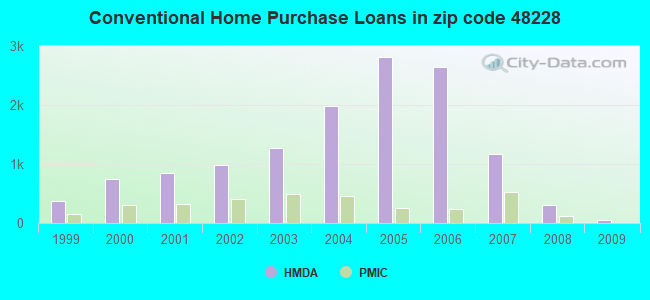
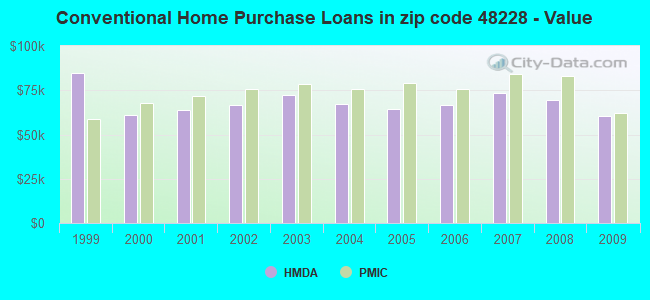
 According to the data from the years 2002 - 2018 the average number of fires per year is 275. The highest number of fires - 487 took place in 2013, and the least - 0 in 2007. The data has a growing trend.
 When looking into fire subcategories, the most reports belonged to: Structure Fires (62.7%), and Mobile Property/Vehicle Fires (19.5%).