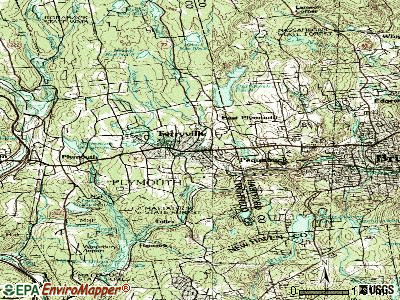
Terryville, Connecticut

Terryville: Lake Winfield, Terryville
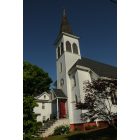
Terryville: St Paul Church
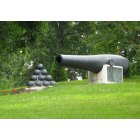
Terryville: Dorence Atwater Monument, Terryville, CT
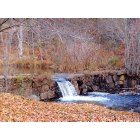
Terryville: Little waterfall, off Greystone Road, Terryville

Terryville: Spring Iris in bloom

Terryville: St Paul Church

Terryville: Cemetery East Plymouth Road, near East Church
Terryville: Over Preston Road in Terryville
- add
your
Submit your own pictures of this place and show them to the world
- OSM Map
- General Map
- Google Map
- MSN Map
Population change since 2000: +0.5%
| Males: 2,662 | |
| Females: 2,725 |
| Median resident age: | 39.9 years |
| Connecticut median age: | 40.9 years |
Zip codes: 06786.
| Terryville: | $68,071 |
| CT: | $88,429 |
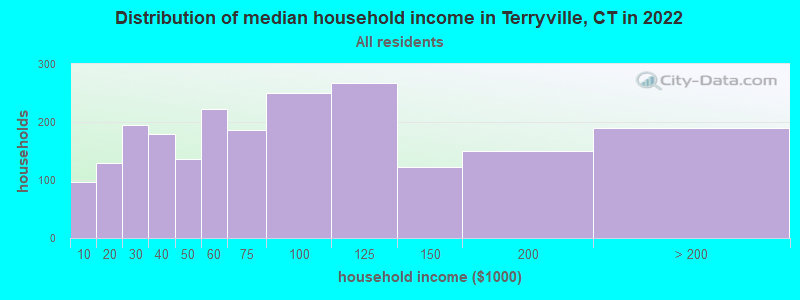
Estimated per capita income in 2022: $37,935 (it was $22,202 in 2000)
Terryville CDP income, earnings, and wages data
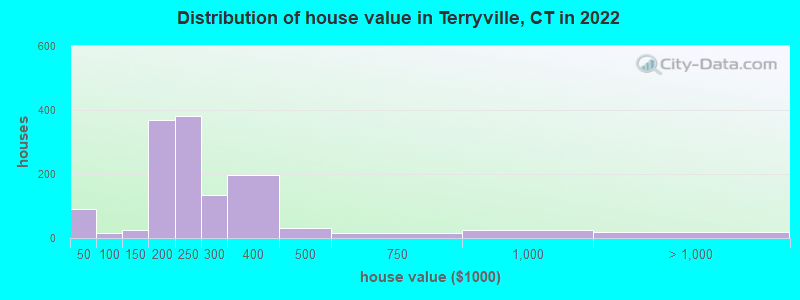
Estimated median house or condo value in 2022: $228,571 (it was $120,500 in 2000)
| Terryville: | $228,571 |
| CT: | $347,200 |
Mean prices in 2022: all housing units: $269,511; detached houses: $281,220; townhouses or other attached units: $216,973; in 2-unit structures: $177,759; in 3-to-4-unit structures: $205,234
Median gross rent in 2022: $1,118.
(13.1% for White Non-Hispanic residents, 100.0% for Black residents)
Detailed information about poverty and poor residents in Terryville, CT
Compare current foreclosures near Terryville, CT:
| Photo | Address | Area | Beds / Baths | Price | Details |
|---|---|---|---|---|---|

|
#1
E Hill St
Terryville, CT 06786
|
888 sq. feet
|
1 baths 2 beds |
show details | |

|
#2
Roosevelt Ave
Terryville, CT 06786
|
1,118 sq. feet
|
2 baths 2 beds |
show details | |

|
#3
Scott Rd
Terryville, CT 06786
|
1,995 sq. feet
|
2 baths 3 beds |
show details | |

|
#4
Seymour Rd
Terryville, CT 06786
|
1,028 sq. feet
|
2 baths 3 beds |
show details | |

|
#5
Scott Rd
Terryville, CT 06786
|
864 sq. feet
|
1 baths 4 beds |
show details | |

|
#6
Diamond St
Terryville, CT 06786
|
1,094 sq. feet
|
2 baths 3 beds |
show details | |

|
#7
Sylvan Ave
Terryville, CT 06786
|
1,691 sq. feet
|
1 baths 4 beds |
show details | |

|
#8
N Harwinton Ave
Terryville, CT 06786
|
2,046 sq. feet
|
3 baths 3 beds |
show details | |

|
#9
Walnut St
Terryville, CT 06786
|
1,080 sq. feet
|
1 baths 3 beds |
show details | |

|
#10
Fall Mountain Ter
Terryville, CT 06786
|
912 sq. feet
|
1 baths 3 beds |
show details |
| Photo | Address | Area | Beds / Baths | Price | Details |
|---|---|---|---|---|---|

|
#11
Lakeview Rd
Terryville, CT 06786
|
1,012 sq. feet
|
1 baths 3 beds |
show details | |

|
#12
Allen St
Terryville, CT 06786
|
1,179 sq. feet
|
1 baths 2 beds |
show details | |

|
#13
Overlook Ter
Terryville, CT 06786
|
1,210 sq. feet
|
1 baths 3 beds |
show details | |

|
#14
Armbruster Rd
Terryville, CT 06786
|
1,132 sq. feet
|
1 baths 3 beds |
show details | |

|
#15
Preston Rd
Terryville, CT 06786
|
1,165 sq. feet
|
1 baths 3 beds |
show details | |

|
#16
Ridge Rd
Terryville, CT 06786
|
3,157 sq. feet
|
3 baths 5 beds |
show details | |

|
#17
Main St Apt 25
Terryville, CT 06786
|
- sq. feet
|
- baths - beds |
show details | |

|
#18
Sherman Ave
Meriden, CT 06450
|
2,860 sq. feet
|
3 baths 6 beds |
$450,000
|
show details |

|
#19
Janwood Rd
Waterbury, CT 06708
|
1,200 sq. feet
|
2 baths 3 beds |
$260,000
|
show details |

|
#20
Clinton Hill Rd
Wolcott, CT 06716
|
1,828 sq. feet
|
1 baths 3 beds |
$240,000
|
show details |
| Photo | Address | Area | Beds / Baths | Price | Details |
|---|---|---|---|---|---|

|
#21
Birge Rd
Bristol, CT 06010
|
1,426 sq. feet
|
2 baths 3 beds |
$356,000
|
show details |

|
#22
W Morris Rd
Morris, CT 06763
|
2,893 sq. feet
|
2 baths 4 beds |
$519,900
|
show details |

|
#23
Birchwood Dr
Hamden, CT 06518
|
2,604 sq. feet
|
2 baths 3 beds |
$569,900
|
show details |

|
#24
Chestnut St
Naugatuck, CT 06770
|
1,012 sq. feet
|
1 baths 2 beds |
$274,900
|
show details |

|
#25
Main St
Terryville, CT 06786
|
- sq. feet
|
- baths - beds |
show details | |

|
#26
Preston Ter
Waterbury, CT 06705
|
896 sq. feet
|
2 baths 2 beds |
show details | |

|
#27
Stafford Ct
Meriden, CT 06450
|
1,426 sq. feet
|
3 baths 3 beds |
show details | |

|
#28
Washington Rd
Woodbury, CT 06798
|
544 sq. feet
|
1 baths 1 beds |
show details | |

|
#29
Woodhaven St
Waterbury, CT 06708
|
1,460 sq. feet
|
2 baths 3 beds |
show details | |

|
#30
Center Ct
Newington, CT 06111
|
1,201 sq. feet
|
1 baths 3 beds |
show details |
| Photo | Address | Area | Beds / Baths | Price | Details |
|---|---|---|---|---|---|

|
#31
Edson Ave
Waterbury, CT 06705
|
1,300 sq. feet
|
1 baths 3 beds |
show details | |

|
#32
Highland Ave
Waterbury, CT 06708
|
1,761 sq. feet
|
2 baths 3 beds |
show details | |

|
#33
Frost Rd
Waterbury, CT 06705
|
816 sq. feet
|
2 baths 2 beds |
show details | |

|
#34
New Hanover Ave
Meriden, CT 06451
|
1,365 sq. feet
|
3 baths 2 beds |
show details | |

|
#35
Norris St
Waterbury, CT 06705
|
1,040 sq. feet
|
1 baths 2 beds |
show details | |

|
#36
Fairfield Rd
West Hartford, CT 06117
|
1,667 sq. feet
|
2 baths 3 beds |
show details | |

|
#37
Echo Valley Rd
Plantsville, CT 06479
|
1,210 sq. feet
|
1 baths 3 beds |
show details | |

|
#38
New Haven Rd Apt 6-E
Naugatuck, CT 06770
|
1,008 sq. feet
|
1 baths 2 beds |
show details | |

|
#39
Symco Dr
New Britain, CT 06053
|
2,418 sq. feet
|
2 baths 6 beds |
show details | |

|
#40
Oakcrest Cir
Waterbury, CT 06708
|
1,434 sq. feet
|
3 baths 3 beds |
show details |
| Photo | Address | Area | Beds / Baths | Price | Details |
|---|---|---|---|---|---|

|
#41
Burritt St
Plantsville, CT 06479
|
1,106 sq. feet
|
2 baths 3 beds |
show details | |

|
#42
Grandview Ave
Waterbury, CT 06708
|
2,992 sq. feet
|
2 baths 4 beds |
show details | |

|
#43
Talcott Forest Rd Apt J
Farmington, CT 06032
|
836 sq. feet
|
1 baths 1 beds |
show details | |

|
#44
Hartford Ave
Newington, CT 06111
|
1,366 sq. feet
|
2 baths 3 beds |
show details | |

|
#45
Austin St
New Britain, CT 06051
|
1,314 sq. feet
|
1 baths 3 beds |
show details | |

|
#46
White Pine Rd
Torrington, CT 06790
|
1,440 sq. feet
|
3 baths 3 beds |
show details | |

|
#47
New Hanover Ave
Meriden, CT 06451
|
1,152 sq. feet
|
2 baths 3 beds |
show details | |

|
#48
Spring St
Meriden, CT 06451
|
898 sq. feet
|
1 baths 2 beds |
show details | |

|
#49
Shirley St Apt 2
Waterbury, CT 06708
|
1,088 sq. feet
|
2 baths 2 beds |
show details | |

|
Check over 1 million property listings on Foreclosure.com!
|
browse all offers | |||


- 4,20483.8%White alone
- 50310.0%Hispanic
- 2565.1%Two or more races
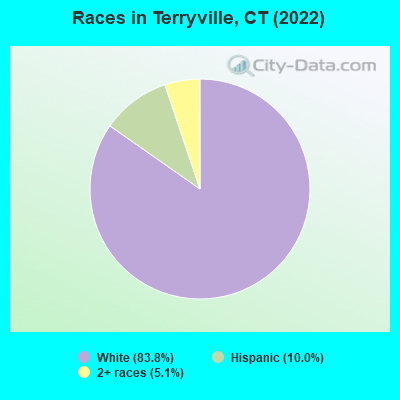
Races in Terryville detailed stats: ancestries, foreign born residents, place of birth
According to our research of Connecticut and other state lists, there were 14 registered sex offenders living in Terryville, Connecticut as of July 18, 2024.
The ratio of all residents to sex offenders in Terryville is 387 to 1.
 Recent articles from our blog. Our writers, many of them Ph.D. graduates or candidates, create easy-to-read articles on a wide variety of topics.

 | Moving - thinking of bristol, plymouth, terryville, wolcott, woodbury (130 replies) |
| Connecticut Weather Discussion 3 (8061 replies) |
| CT 2022 governor election (716 replies) |
| Hospital Recommendations Near Terryville (6 replies) |
| Connecticut Weather Discussion 2 (9111 replies) |
| No well and septic please (12 replies) |
Latest news from Terryville, CT collected exclusively by city-data.com from local newspapers, TV, and radio stations
Ancestries: American (23.5%), Irish (12.4%), Polish (9.9%), Italian (7.9%), French Canadian (7.6%), Eastern European (5.6%).
Current Local Time: EST time zone
Elevation: 609 feet
Land area: 2.77 square miles.
Population density: 1,945 people per square mile (low).
139 residents are foreign born (1.5% Latin America, 0.8% Europe, 0.3% Asia).
| This place: | 2.8% |
| Connecticut: | 15.0% |
Median real estate property taxes paid for housing units with mortgages in 2022: $4,719 (2.0%)
Median real estate property taxes paid for housing units with no mortgage in 2022: $4,455 (2.2%)
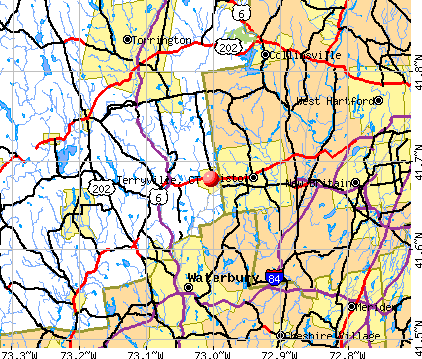
Nearest city with pop. 50,000+: Bristol, CT  (3.6 miles , pop. 60,062).
Nearest city with pop. 200,000+: North Hempstead, NY (71.3 miles , pop. 222,611).
Nearest city with pop. 1,000,000+: Bronx, NY (73.2 miles , pop. 1,332,650).
Nearest cities:
), )Latitude: 41.68 N, Longitude: 73.00 W
Daytime population change due to commuting: -1,206 (-24.0%)
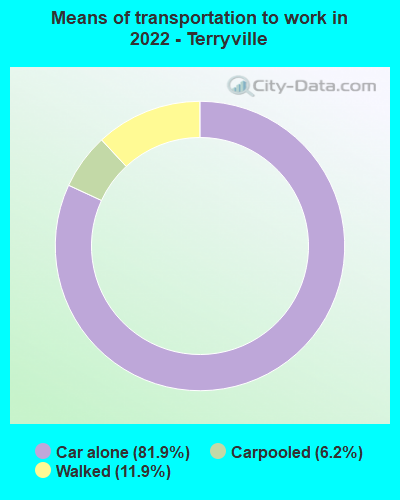
Workers who live and work in this place: 583 (21.3%)
Area code commonly used in this area: 860
| Here: | 3.6% |
| Connecticut: | 3.9% |
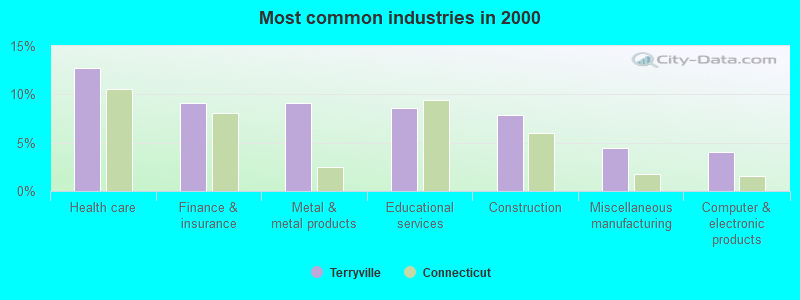
- Health care (12.7%)
- Finance & insurance (9.2%)
- Metal & metal products (9.1%)
- Educational services (8.6%)
- Construction (7.9%)
- Miscellaneous manufacturing (4.4%)
- Computer & electronic products (4.0%)
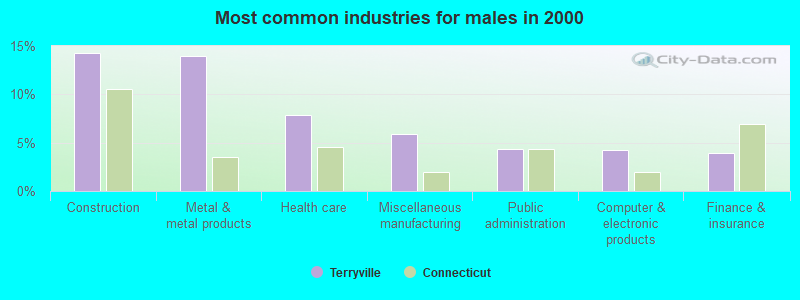
- Construction (14.2%)
- Metal & metal products (13.9%)
- Health care (7.9%)
- Miscellaneous manufacturing (5.9%)
- Public administration (4.4%)
- Computer & electronic products (4.3%)
- Finance & insurance (3.9%)
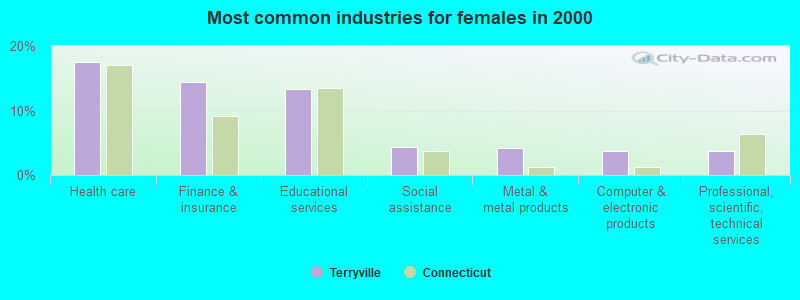
- Health care (17.6%)
- Finance & insurance (14.4%)
- Educational services (13.3%)
- Social assistance (4.3%)
- Metal & metal products (4.2%)
- Computer & electronic products (3.8%)
- Professional, scientific, technical services (3.7%)
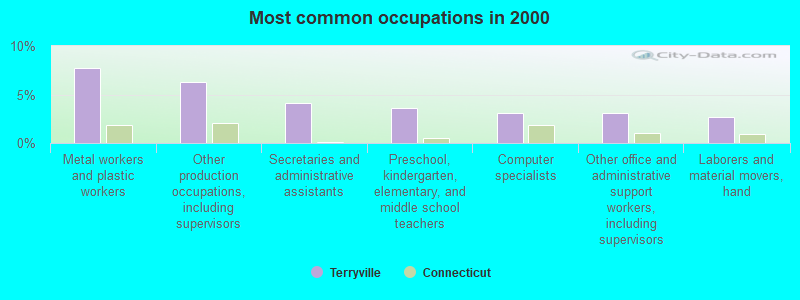
- Metal workers and plastic workers (7.7%)
- Other production occupations, including supervisors (6.3%)
- Secretaries and administrative assistants (4.2%)
- Preschool, kindergarten, elementary, and middle school teachers (3.6%)
- Computer specialists (3.1%)
- Other office and administrative support workers, including supervisors (3.1%)
- Laborers and material movers, hand (2.7%)
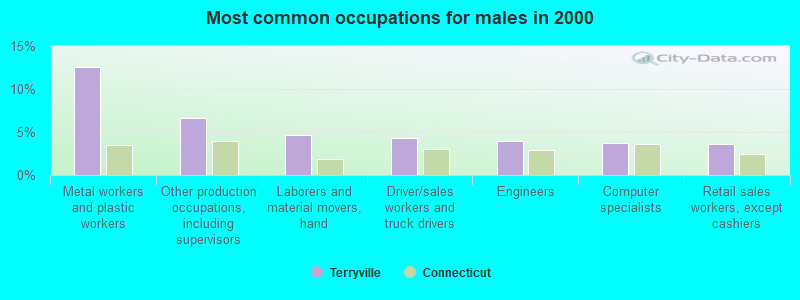
- Metal workers and plastic workers (12.6%)
- Other production occupations, including supervisors (6.6%)
- Laborers and material movers, hand (4.6%)
- Driver/sales workers and truck drivers (4.4%)
- Engineers (4.0%)
- Computer specialists (3.7%)
- Retail sales workers, except cashiers (3.6%)
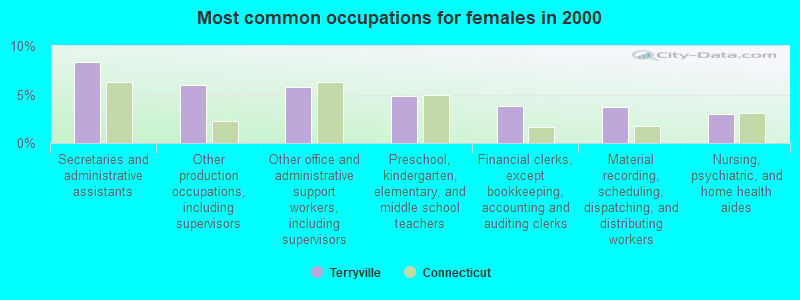
- Secretaries and administrative assistants (8.3%)
- Other production occupations, including supervisors (6.0%)
- Other office and administrative support workers, including supervisors (5.8%)
- Preschool, kindergarten, elementary, and middle school teachers (4.9%)
- Financial clerks, except bookkeeping, accounting and auditing clerks (3.8%)
- Material recording, scheduling, dispatching, and distributing workers (3.7%)
- Nursing, psychiatric, and home health aides (3.0%)
Average climate in Terryville, Connecticut
Based on data reported by over 4,000 weather stations


(lower is better)
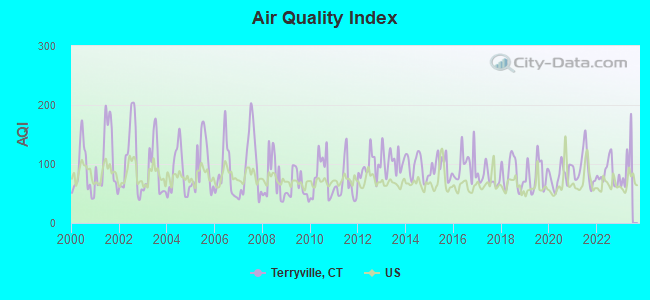
Air Quality Index (AQI) level in 2022 was 84.0. This is about average.
| City: | 84.0 |
| U.S.: | 72.6 |
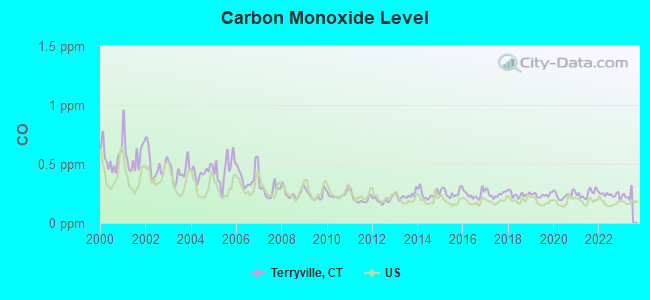
Carbon Monoxide (CO) [ppm] level in 2022 was 0.239. This is about average. Closest monitor was 4.5 miles away from the city center.
| City: | 0.239 |
| U.S.: | 0.251 |
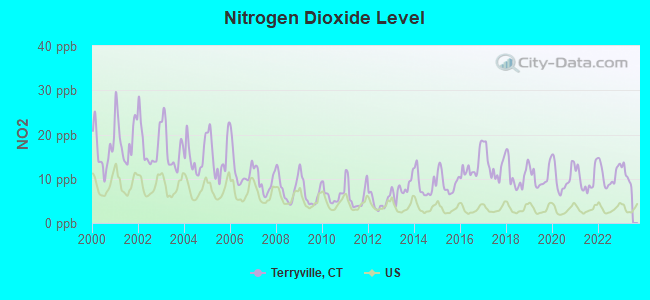
Nitrogen Dioxide (NO2) [ppb] level in 2022 was 10.8. This is significantly worse than average. Closest monitor was 1.0 miles away from the city center.
| City: | 10.8 |
| U.S.: | 5.1 |
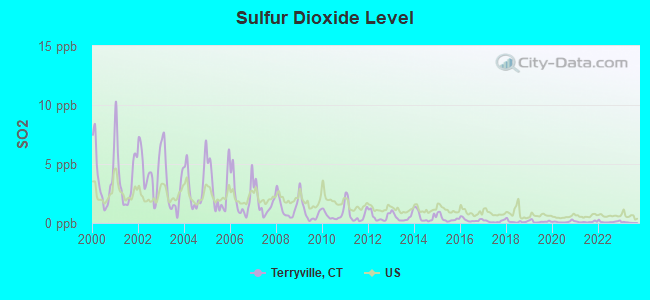
Sulfur Dioxide (SO2) [ppb] level in 2022 was 0.109. This is significantly better than average. Closest monitor was 1.0 miles away from the city center.
| City: | 0.109 |
| U.S.: | 1.515 |
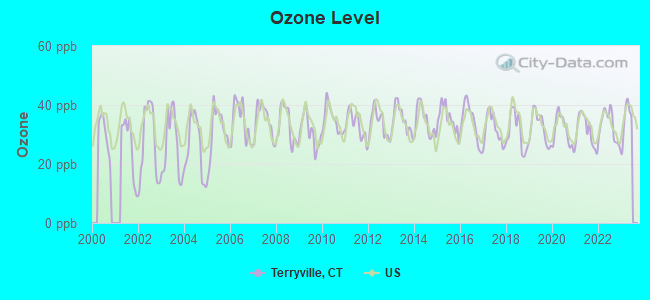
Ozone [ppb] level in 2022 was 33.0. This is about average. Closest monitor was 7.2 miles away from the city center.
| City: | 33.0 |
| U.S.: | 33.3 |
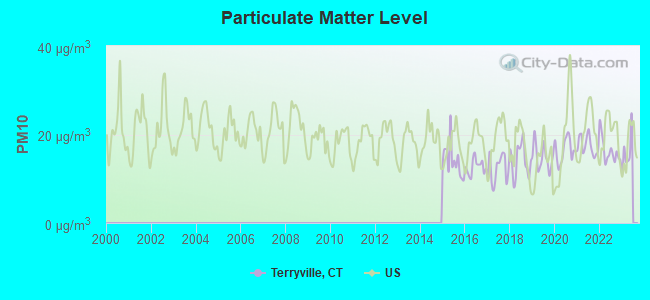
Particulate Matter (PM10) [µg/m3] level in 2022 was 16.3. This is about average. Closest monitor was 6.8 miles away from the city center.
| City: | 16.3 |
| U.S.: | 19.2 |
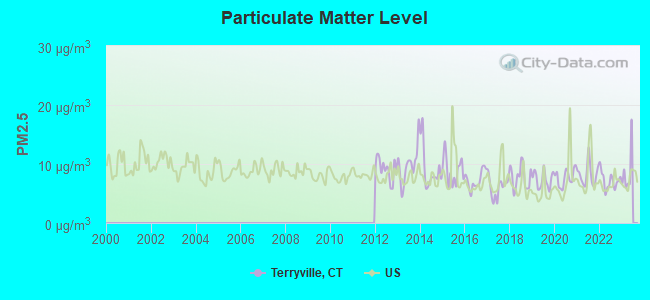
Particulate Matter (PM2.5) [µg/m3] level in 2022 was 7.21. This is about average. Closest monitor was 4.5 miles away from the city center.
| City: | 7.21 |
| U.S.: | 8.11 |
Tornado activity:
Terryville-area historical tornado activity is slightly above Connecticut state average. It is 20% smaller than the overall U.S. average.
On 7/10/1989, a category F4 (max. wind speeds 207-260 mph) tornado 21.4 miles away from the Terryville place center injured 40 people and caused between $50,000,000 and $500,000,000 in damages.
On 10/3/1979, a category F4 tornado 22.1 miles away from the place center killed 3 people and injured 500 people and caused between $50,000,000 and $500,000,000 in damages.
Earthquake activity:
Terryville-area historical earthquake activity is significantly above Connecticut state average. It is 70% smaller than the overall U.S. average.On 10/7/1983 at 10:18:46, a magnitude 5.3 (5.1 MB, 5.3 LG, 5.1 ML, Class: Moderate, Intensity: VI - VII) earthquake occurred 171.3 miles away from the city center
On 4/20/2002 at 10:50:47, a magnitude 5.3 (5.3 ML, Depth: 3.0 mi) earthquake occurred 199.1 miles away from the city center
On 4/20/2002 at 10:50:47, a magnitude 5.2 (5.2 MB, 4.2 MS, 5.2 MW, 5.0 MW) earthquake occurred 197.5 miles away from the city center
On 1/19/1982 at 00:14:42, a magnitude 4.7 (4.5 MB, 4.7 MD, 4.5 LG, Class: Light, Intensity: IV - V) earthquake occurred 144.8 miles away from Terryville center
On 8/23/2011 at 17:51:04, a magnitude 5.8 (5.8 MW, Depth: 3.7 mi) earthquake occurred 369.6 miles away from Terryville center
On 10/16/2012 at 23:12:25, a magnitude 4.7 (4.7 ML, Depth: 10.0 mi) earthquake occurred 178.5 miles away from the city center
Magnitude types: regional Lg-wave magnitude (LG), body-wave magnitude (MB), duration magnitude (MD), local magnitude (ML), surface-wave magnitude (MS), moment magnitude (MW)
Natural disasters:
The number of natural disasters in Litchfield County (23) is greater than the US average (15).Major Disasters (Presidential) Declared: 13
Emergencies Declared: 10
Causes of natural disasters: Storms: 7, Hurricanes: 5, Floods: 4, Snowstorms: 4, Blizzards: 3, Snows: 2, Tropical Storms: 2, Winter Storms: 2, Snowfall: 1, Tornado: 1, Wind: 1 (Note: some incidents may be assigned to more than one category).
Hospitals and medical centers near Terryville:
- COOK-WILLOW REST CONV HOSP (Nursing Home, about 3 miles away; PLYMOUTH, CT)
- INGRAHAM MANOR (Nursing Home, about 3 miles away; BRISTOL, CT)
- COOK WILLOW CONVALESCENT HOSPI (Nursing Home, about 3 miles away; PLYMOUTH, CT)
- PINES AT BRISTOL FOR NURSING AND REHABILITATION, THE (Nursing Home, about 4 miles away; BRISTOL, CT)
- SHERIDEN WOOD HEALTH CARE CENTER (Nursing Home, about 5 miles away; BRISTOL, CT)
- SHERIDEN WOODS (Nursing Home, about 5 miles away; BRISTOL, CT)
- FMC DIALYSIS SERVICES FORESTVILLE (Dialysis Facility, about 5 miles away; BRISTOL, CT)
Amtrak stations near Terryville:
- 13 miles: BERLIN (KENSINGTON, DEPOT RD.) . Services: ticket office, partially wheelchair accessible, enclosed waiting area, public restrooms, public payphones, free short-term parking, free long-term parking, call for car rental service, call for taxi service, public transit connection.
- 15 miles: MERIDEN (60 STATE ST.) . Services: ticket office, partially wheelchair accessible, enclosed waiting area, public restrooms, public payphones, vending machines, call for car rental service, call for taxi service, public transit connection.
- 18 miles: HARTFORD (1 UNION PLACE) . Services: ticket office, partially wheelchair accessible, enclosed waiting area, public restrooms, public payphones, full-service food facilities, snack bar, vending machines, ATM, paid short-term parking, paid long-term parking, call for car rental service, taxi stand, intercity bus service, public transit connection.
Colleges/universities with over 2000 students nearest to Terryville:
- Tunxis Community College (about 7 miles; Farmington, CT; Full-time enrollment: 2,787)
- University of Connecticut-Tri-Campus (about 9 miles; Waterbury, CT; FT enrollment: 2,250)
- Naugatuck Valley Community College (about 10 miles; Waterbury, CT; FT enrollment: 4,491)
- Post University (about 11 miles; Waterbury, CT; FT enrollment: 5,808)
- Central Connecticut State University (about 13 miles; New Britain, CT; FT enrollment: 9,989)
- Trinity College (about 17 miles; Hartford, CT; FT enrollment: 2,355)
- University of Hartford (about 17 miles; West Hartford, CT; FT enrollment: 6,398)
Public high schools in Terryville:
- TERRYVILLE HIGH SCHOOL (Students: 429, Location: 21 NORTH MAIN STREET, Grades: 9-12)
- PLYMOUTH ALTERNATIVE HIGH SCHOOL (Location: 77 MAIN STREET, Grades: 10-12)
Public elementary/middle schools in Terryville:
- HARRY S. FISHER ELEMENTARY SCHOOL (Students: 470, Location: 79 NORTH MAIN STREET, Grades: PK-5)
- ELI TERRY JR. MIDDLE SCHOOL (Location: 79 NORTH MAIN STREET, Grades: 6-8)
Points of interest:
Notable locations in Terryville: Plymouth Town Hall (A), Lock Museum of America Library (B), Lock Museum of America (C), Plymouth Volunteer Ambulance Corps (D), Plymouth Fire Marshal's Office (E), Plymouth Ambulance Service (F), Terryville Volunteer Fire Department Headquarters (G). Display/hide their locations on the map
Church in Terryville: Immaculate Conception Roman Catholic Church (A). Display/hide its location on the map
Cemeteries: Old Cemetery (1), East Church Cemetery (2), Church of the Immaculate Conception Cemetery (3), Saint Marys Cemetery (4), Saint Michaels Cemetery (5). Display/hide their locations on the map
Reservoirs: Middle Pond (A), Upper Pond (B). Display/hide their locations on the map
Streams, rivers, and creeks: Marsh Brook (A), Poland River (B). Display/hide their locations on the map
Park in Terryville: East Plymouth Historic District (1). Display/hide its location on the map
Tourist attraction: Ad-Venture Balloon Inc (19 Crescent).
Hotels: Jay's Motel (51 South Main Street), Plymouth Motor Lodge (325 Main Street).
Birthplace of: Pete Appleton - Baseball player, Ted Knight - (1923-1986), actor.
| This place: | 2.4 people |
| Connecticut: | 2.5 people |
| This place: | 64.2% |
| Whole state: | 66.3% |
| This place: | 9.5% |
| Whole state: | 6.6% |
Likely homosexual households (counted as self-reported same-sex unmarried-partner households)
- Lesbian couples: 0.1% of all households
- Gay men: 0.1% of all households
3 people in other noninstitutional facilities in 2010
7 people in religious group quarters in 2000
Banks with branches in Terryville (2011 data):
- Webster Bank, National Association: Terryville Branch at One North Riverside Ave, branch established on 1976/09/30. Info updated 2008/12/23: Bank assets: $18,674.3 mil, Deposits: $13,861.5 mil, headquarters in Waterbury, CT, positive income, Commercial Lending Specialization, 167 total offices, Holding Company: Webster Financial Corporation
- NEW ENGLAND BANK: Terryville Branch at Eight South Main Street, branch established on 2002/10/01. Info updated 2009/06/12: Bank assets: $724.5 mil, Deposits: $582.4 mil, headquarters in Enfield, CT, positive income, Commercial Lending Specialization, 15 total offices, Holding Company: New England Bancshares, Inc.
- Thomaston Savings Bank: Terryville Branch at 203 Main Street, branch established on 1961/10/02. Info updated 2006/11/03: Bank assets: $692.2 mil, Deposits: $559.9 mil, headquarters in Thomaston, CT, positive income, Mortgage Lending Specialization, 9 total offices
For population 15 years and over in Terryville:
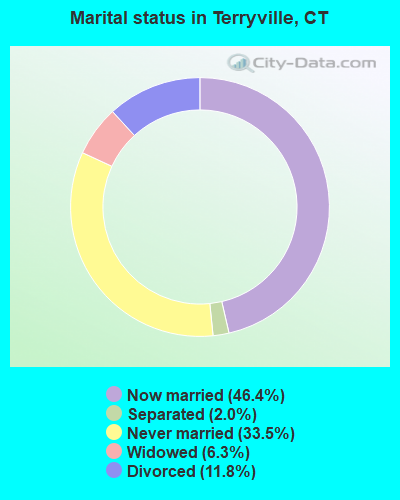
- Never married: 33.5%
- Now married: 46.4%
- Separated: 2.0%
- Widowed: 6.3%
- Divorced: 11.8%
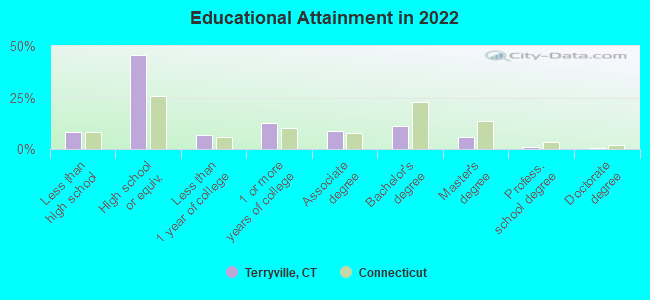
For population 25 years and over in Terryville:
- High school or higher: 91.6%
- Bachelor's degree or higher: 17.8%
- Graduate or professional degree: 6.9%
- Unemployed: 5.6%
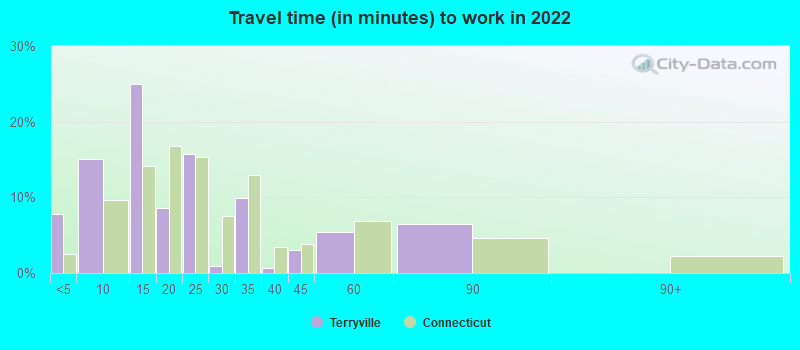
- Mean travel time to work (commute): 26.6 minutes
| Here: | 9.6 |
| Connecticut average: | 12.6 |
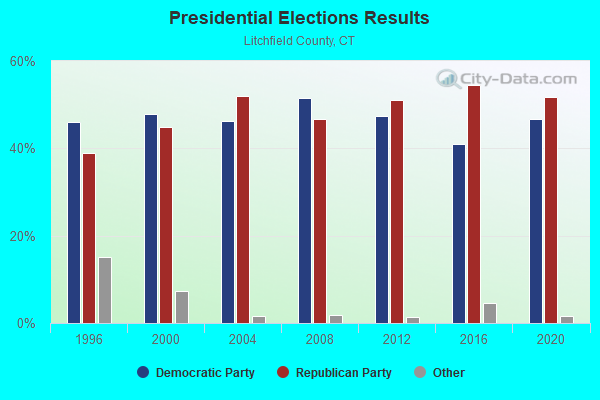
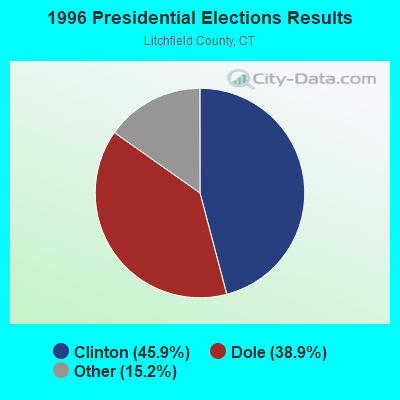
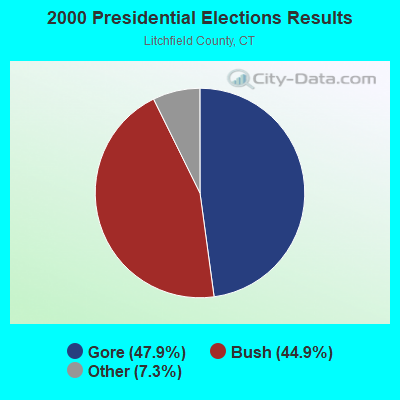
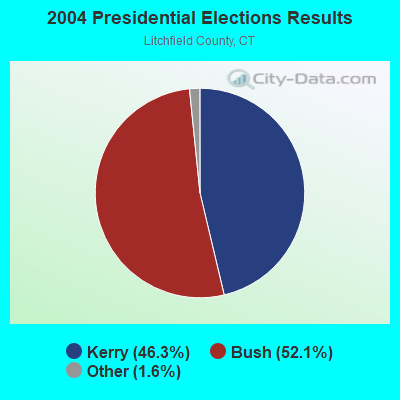
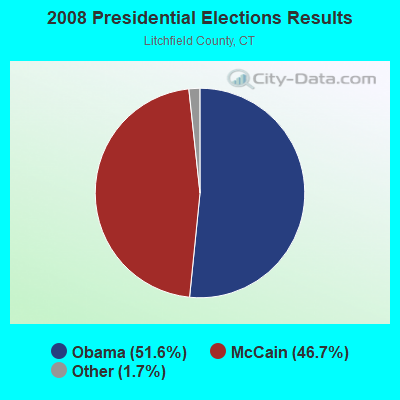
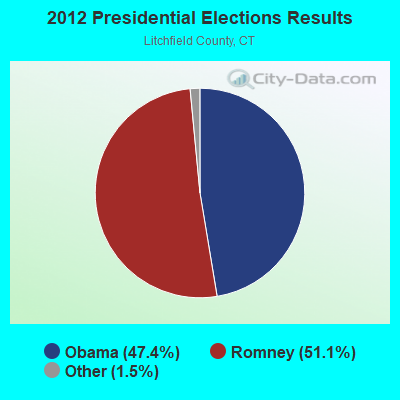
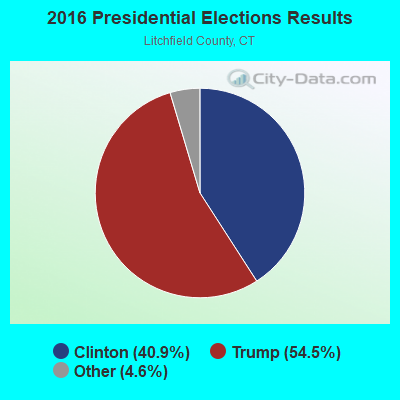
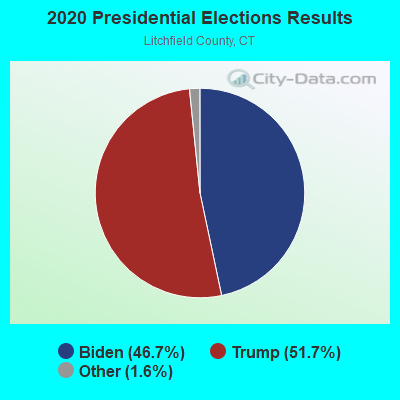
Graphs represent county-level data. Detailed 2008 Election Results
Religion statistics for Terryville, CT (based on Litchfield County data)
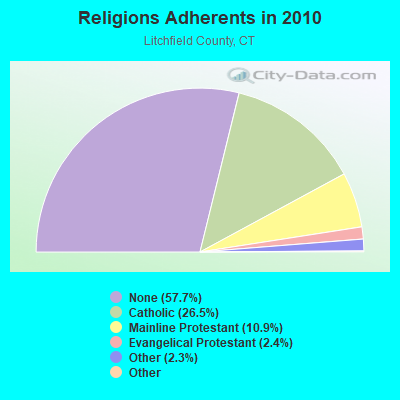
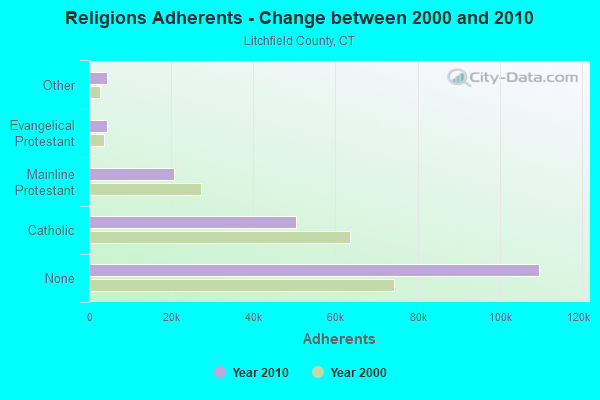
| Religion | Adherents | Congregations |
|---|---|---|
| Catholic | 50,354 | 30 |
| Mainline Protestant | 20,681 | 87 |
| Evangelical Protestant | 4,483 | 39 |
| Other | 4,420 | 16 |
| Orthodox | 175 | 2 |
| Black Protestant | 160 | 2 |
| None | 109,654 | - |
Food Environment Statistics:
| This county: | 2.29 / 10,000 pop. |
| Connecticut: | 2.21 / 10,000 pop. |
| This county: | 0.05 / 10,000 pop. |
| Connecticut: | 0.07 / 10,000 pop. |
| Here: | 0.64 / 10,000 pop. |
| State: | 1.02 / 10,000 pop. |
| This county: | 2.98 / 10,000 pop. |
| Connecticut: | 2.27 / 10,000 pop. |
| Litchfield County: | 11.07 / 10,000 pop. |
| Connecticut: | 9.19 / 10,000 pop. |
| This county: | 6.9% |
| Connecticut: | 7.3% |
| This county: | 21.1% |
| Connecticut: | 21.5% |
| Here: | 11.8% |
| Connecticut: | 15.8% |
Health and Nutrition:
| Here: | 51.0% |
| Connecticut: | 50.0% |
| Terryville: | 48.7% |
| Connecticut: | 47.5% |
| This city: | 28.8 |
| State: | 28.7 |
| This city: | 21.6% |
| Connecticut: | 20.9% |
| Terryville: | 10.3% |
| Connecticut: | 10.5% |
| This city: | 6.9 |
| State: | 6.8 |
| Terryville: | 35.1% |
| Connecticut: | 34.2% |
| Terryville: | 57.8% |
| Connecticut: | 56.4% |
| Terryville: | 78.3% |
| Connecticut: | 78.9% |
More about Health and Nutrition of Terryville, CT Residents
| Businesses in Terryville, CT | ||||
| Name | Count | Name | Count | |
|---|---|---|---|---|
| Advance Auto Parts | 1 | Rite Aid | 1 | |
| Chevrolet | 1 | Subway | 1 | |
| Dunkin Donuts | 1 | UPS | 1 | |
| McDonald's | 1 | |||
Strongest AM radio stations in Terryville:
- WTIC (1080 AM; 50 kW; HARTFORD, CT; Owner: INFINITY RADIO OPERATIONS INC.)
- WPRX (1120 AM; 1 kW; BRISTOL, CT; Owner: NIEVEZQUEZ PRODUCTIONS, INC)
- WNNZ (640 AM; 50 kW; WESTFIELD, MA; Owner: CLEAR CHANNEL BROADCASTING LICENSES, INC.)
- WLAT (910 AM; 5 kW; NEW BRITAIN, CT; Owner: MEGA COMMUNICATIONS OF NEW BRITAIN LICENSEE, LLC)
- WSNG (610 AM; 1 kW; TORRINGTON, CT; Owner: BUCKLEY BROADCASTING CORPORATION OF)
- WATR (1320 AM; 5 kW; WATERBURY, CT; Owner: WATR, INC.)
- WXCT (990 AM; 2 kW; SOUTHINGTON, CT; Owner: THE ADD RADIO GROUP, INC.)
- WFNW (1380 AM; 5 kW; NAUGATUCK, CT; Owner: CANDIDO DIAS CARRELO)
- WPOP (1410 AM; 5 kW; HARTFORD, CT; Owner: CAPSTAR TX LIMITED PARTNERSHIP)
- WFAN (660 AM; 50 kW; NEW YORK, NY; Owner: INFINITY BROADCASTING OPERATIONS, INC.)
- WCRN (830 AM; 50 kW; WORCESTER, MA; Owner: CARTER BROADCASTING CORPORATION)
- WWCO (1240 AM; 1 kW; WATERBURY, CT; Owner: BUCKLEY BROADCASTING CORPORATION)
- WCBS (880 AM; 50 kW; NEW YORK, NY; Owner: INFINITY BROADCASTING OPERATIONS, INC.)
Strongest FM radio stations in Terryville:
- WJMJ (88.9 FM; HARTFORD, CT; Owner: ST. THOMAS SEMINARY)
- WRCH (100.5 FM; NEW BRITAIN, CT; Owner: INFINITY RADIO OPERATIONS INC.)
- WWYZ (92.5 FM; WATERBURY, CT; Owner: CAPSTAR TX LIMITED PARTNERSHIP)
- WKSS (95.7 FM; HARTFORD-MERIDEN, CT; Owner: CAPSTAR TX LIMITED PARTNERSHIP)
- WHCN (105.9 FM; HARTFORD, CT; Owner: CAPSTAR TX LIMITED PARTNERSHIP)
- WZMX (93.7 FM; HARTFORD, CT; Owner: INFINITY RADIO OPERATIONS INC.)
- WMRQ (104.1 FM; WATERBURY, CT; Owner: CAPSTAR TX LIMITED PARTNERSHIP)
- WPKT (90.5 FM; MERIDEN, CT; Owner: CONNECTICUT PUBLIC BROADCASTING, INC)
- WDRC-FM (102.9 FM; HARTFORD, CT; Owner: BUCKLEY BROADCASTING CORPORATION)
- WTIC-FM (96.5 FM; HARTFORD, CT; Owner: INFINITY RADIO OPERATIONS INC.)
- WWUH (91.3 FM; WEST HARTFORD, CT; Owner: UNIVERSITY OF HARTFORD)
- WKCI-FM (101.3 FM; HAMDEN, CT; Owner: CLEAR CHANNEL BROADCASTING LICENSES, INC.)
- WCCC-FM (106.9 FM; HARTFORD, CT; Owner: MARLIN BROADCASTING, LLC)
- WPLR (99.1 FM; NEW HAVEN, CT; Owner: COX RADIO, INC.)
- WZBG (97.3 FM; LITCHFIELD, CT; Owner: LOCAL GIRLS & BOYS B/CASTING CORP.)
- W218AV (91.5 FM; WARREN, CT; Owner: MONROE BOARD OF EDUCATION)
- W227AJ (93.3 FM; NORTHFORD, CT; Owner: SACRED HEART UNIVERSITY)
- WRKI (95.1 FM; BROOKFIELD, CT; Owner: CUMULUS LICENSING CORP.)
- W206AW (89.1 FM; PAWLING, NY; Owner: SOUND OF LIFE, INC.)
- WAPJ (89.9 FM; TORRINGTON, CT; Owner: NUTMEG CONSERVATORY FOR THE ARTS, INC.)
TV broadcast stations around Terryville:
- WTIC-TV (Channel 61; HARTFORD, CT; Owner: TRIBUNE TELEVISION COMPANY)
- W11BJ (Channel 11; HARTFORD, CT; Owner: COMMUNICATIONS SITE MANAGEMENT LLC)
- WTXX (Channel 20; WATERBURY, CT; Owner: WTXX INC.)
- WVIT (Channel 30; NEW BRITAIN, CT; Owner: OUTLET BROADCASTING, INC)
- WEDH (Channel 24; HARTFORD, CT; Owner: CONNECTICUT PUBLIC BROADCASTING, INC.)
- WUVN (Channel 18; HARTFORD, CT; Owner: ENTRAVISION HOLDINGS, LLC)
- WFSB (Channel 3; HARTFORD, CT; Owner: MEREDITH CORPORATION)
- WTNH (Channel 8; NEW HAVEN, CT; Owner: WTNH BROADCASTING, INC.)
- WCTX (Channel 59; NEW HAVEN, CT; Owner: WTNH BROADCASTING, INC.)
- WEDY (Channel 65; NEW HAVEN, CT; Owner: CONNECTICUT PUBLIC BROADCASTING, INC.)
- WHCT-LP (Channel 38; HARTFORD, CT; Owner: VENTURE TECHNOLOGIES GROUP, LLC)
- W12BH (Channel 12; WATERBURY, CT; Owner: CONN.PUBLIC BROADCASTING, INC.)
- WHTX-LP (Channel 10; HARTFORD, CT; Owner: ENTRAVISION HOLDINGS, LLC)
- WHPX (Channel 26; NEW LONDON, CT; Owner: PAXSON HARTFORD LICENSE, INC.)
- WRDM-LP (Channel 13; HARTFORD, CT; Owner: ZGS HARTFORD, INC.)
- WMLD-LP (Channel 6; HARTFORD, CT; Owner: HARVARD BROADCASTING, INC.)
- WEDW (Channel 49; BRIDGEPORT, CT; Owner: CONNECTICUT PUBLIC BROADCASTING, INC.)
- WUTH-CA (Channel 47; HARTFORD, CT; Owner: ENTRAVISION HOLDINGS, LLC)
- WSAH (Channel 43; BRIDGEPORT, CT; Owner: WSAH LICENSE, INC.)
- W51BZ (Channel 51; NEW HAVEN, CT; Owner: it COMMUNICATIONS, INC.)
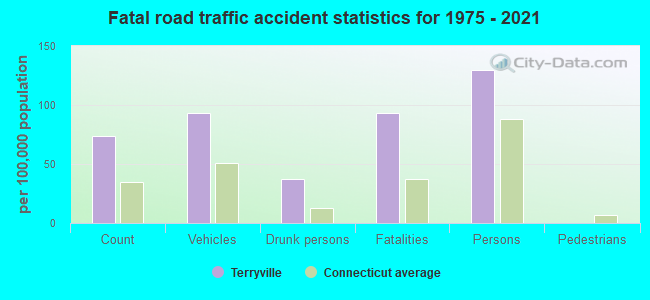
Terryville fatal accident list:
May 16, 1999 01:25 AM, Oldwaerburyroad, Vehicles: 1, Persons: 1, Fatalities: 1, Drunk persons involved: 1
Aug 27, 1993 11:07 PM, 6, Vehicles: 1, Persons: 2, Fatalities: 2
Sep 26, 1991 03:20 PM, 72, Vehicles: 2, Persons: 3, Fatalities: 1
FCC Registered Cell Phone Towers:
1 (See the full list of FCC Registered Cell Phone Towers in Terryville)FCC Registered Antenna Towers:
7 (See the full list of FCC Registered Antenna Towers)FCC Registered Broadcast Land Mobile Towers:
4- 62-135 Town Hill Rd, Fair Grounds (Lat: 41.668389 Lon: -73.019861), Type: Mtower, Structure height: 51.8 m, Call Sign: WDE657,
Assigned Frequencies: 453.675 MHz, Grant Date: 04/26/2023, Expiration Date: 04/29/2033, Registrant: Northeastern Communications Inc, 7 Great Hill Rd, Naugatuck, CT 06770, Phone: (203) 575-9008, Email:
- 96 E Washington Rd (Lat: 41.667889 Lon: -73.001500), Call Sign: WSM673, Licensee ID: L00026712,
Assigned Frequencies: 152.960 MHz, Grant Date: 02/08/2005, Expiration Date: 02/12/2015, Cancellation Date: 04/18/2015, Registrant: Pete & Steve Contractors & Engineers, 96 E Washington Rd, Terryville, CT 06786, Phone: (860) 589-3600
- 317 Washington Road (Lat: 41.670028 Lon: -73.018722), Type: Bant, Structure height: 7.6 m, Overall height: 13.7 m, Call Sign: KCF531,
Assigned Frequencies: 47.7000 MHz, Grant Date: 11/13/2003, Expiration Date: 01/18/2014, Cancellation Date: 03/22/2014, Registrant: New England Communications Systems, 427 Haydens Station Rd, Windsor, CT 06095, Phone: (860) 669-8630
- Lat: 41.688778 Lon: -73.034528, Call Sign: WQIG388,
Assigned Frequencies: 72.1600 MHz, 72.3200 MHz, Grant Date: 01/31/2008, Expiration Date: 01/31/2018, Cancellation Date: 04/14/2018, Certifier: Gerard Peruase, Registrant: Primex Wireless, Inc., 965 Wells St, Lake Geneva, WI 53147, Phone: (800) 537-0464
FCC Registered Amateur Radio Licenses:
67 (See the full list of FCC Registered Amateur Radio Licenses in Terryville)FAA Registered Aircraft Manufacturers and Dealers:
4 (See the full list of FAA Registered Manufacturers and Dealers in Terryville)FAA Registered Aircraft:
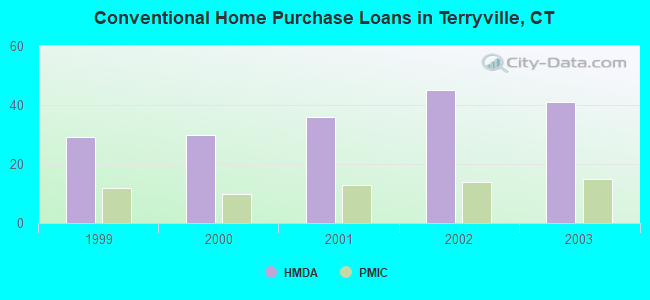
12 (See the full list of FAA Registered Aircraft)| Home Mortgage Disclosure Act Aggregated Statistics For Year 2003 (Based on 2 partial tracts) | ||||||||||||
| A) FHA, FSA/RHS & VA Home Purchase Loans | B) Conventional Home Purchase Loans | C) Refinancings | D) Home Improvement Loans | E) Loans on Dwellings For 5+ Families | F) Non-occupant Loans on < 5 Family Dwellings (A B C & D) | |||||||
|---|---|---|---|---|---|---|---|---|---|---|---|---|
| Number | Average Value | Number | Average Value | Number | Average Value | Number | Average Value | Number | Average Value | Number | Average Value | |
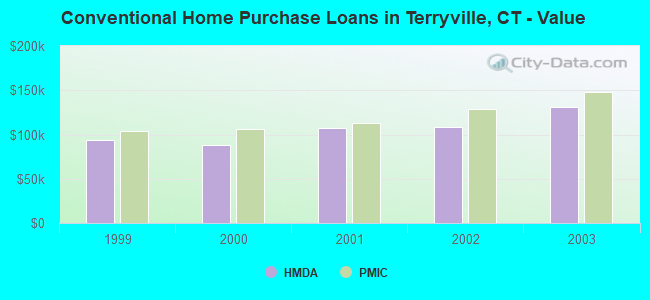
| LOANS ORIGINATED | 15 | $139,326 | 41 | $130,855 | 182 | $109,759 | 6 | $34,523 | 0 | $0 | 11 | $94,857 |
| APPLICATIONS APPROVED, NOT ACCEPTED | 0 | $0 | 4 | $150,810 | 22 | $112,489 | 3 | $59,607 | 1 | $129,580 | 1 | $37,000 |
| APPLICATIONS DENIED | 1 | $119,270 | 6 | $67,017 | 61 | $124,016 | 6 | $39,475 | 0 | $0 | 2 | $137,930 |
| APPLICATIONS WITHDRAWN | 2 | $136,820 | 6 | $95,577 | 30 | $120,805 | 2 | $23,800 | 0 | $0 | 4 | $100,165 |
| FILES CLOSED FOR INCOMPLETENESS | 0 | $0 | 0 | $0 | 7 | $130,750 | 2 | $28,210 | 0 | $0 | 0 | $0 |
Detailed HMDA statistics for the following Tracts: 4253.00 , 4255.00
| Private Mortgage Insurance Companies Aggregated Statistics For Year 2003 (Based on 2 partial tracts) | ||||||
| A) Conventional Home Purchase Loans | B) Refinancings | C) Non-occupant Loans on < 5 Family Dwellings (A & B) | ||||
|---|---|---|---|---|---|---|
| Number | Average Value | Number | Average Value | Number | Average Value | |
| LOANS ORIGINATED | 15 | $148,353 | 11 | $147,767 | 0 | $0 |
| APPLICATIONS APPROVED, NOT ACCEPTED | 2 | $103,145 | 2 | $155,895 | 1 | $87,270 |
| APPLICATIONS DENIED | 0 | $0 | 1 | $146,330 | 0 | $0 |
| APPLICATIONS WITHDRAWN | 2 | $140,055 | 0 | $0 | 0 | $0 |
| FILES CLOSED FOR INCOMPLETENESS | 0 | $0 | 0 | $0 | 0 | $0 |
Detailed PMIC statistics for the following Tracts: 4253.00 , 4255.00
2002 - 2018 National Fire Incident Reporting System (NFIRS) incidents
- Fire incident types reported to NFIRS in Terryville, CT
- 23150.1%Structure Fires
- 13228.6%Outside Fires
- 7416.1%Mobile Property/Vehicle Fires
- 245.2%Other
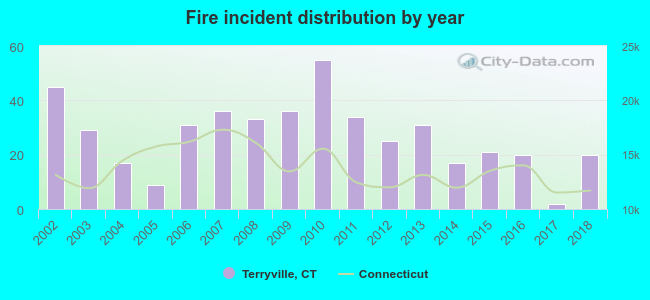 Based on the data from the years 2002 - 2018 the average number of fires per year is 27. The highest number of fires - 55 took place in 2010, and the least - 2 in 2017. The data has a dropping trend.
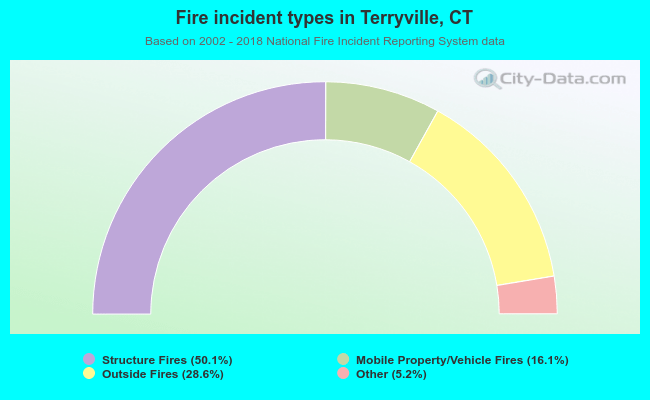 When looking into fire subcategories, the most reports belonged to: Structure Fires (50.1%), and Outside Fires (28.6%).
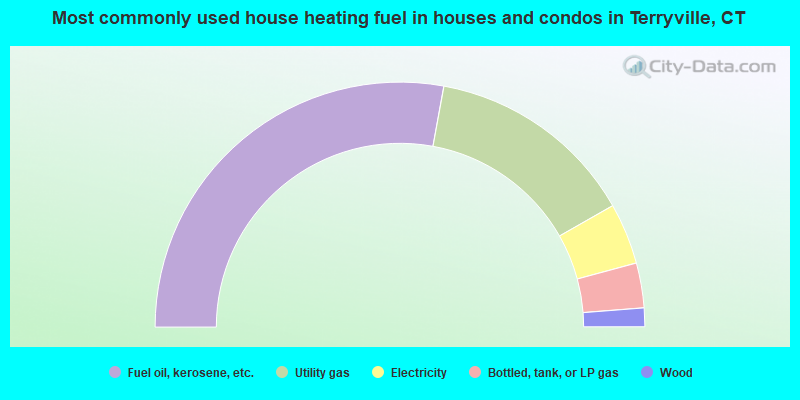
- 55.8%Fuel oil, kerosene, etc.
- 27.8%Utility gas
- 8.1%Electricity
- 5.9%Bottled, tank, or LP gas
- 2.5%Wood
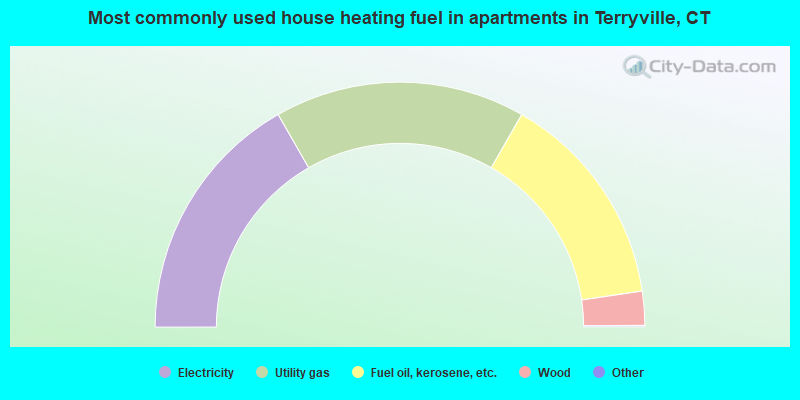
- 33.5%Electricity
- 33.2%Utility gas
- 28.8%Fuel oil, kerosene, etc.
- 4.5%Wood
Terryville compared to Connecticut state average:
- Median house value below state average.
- Unemployed percentage below state average.
- Black race population percentage significantly below state average.
- Hispanic race population percentage below state average.
- Foreign-born population percentage significantly below state average.
- Length of stay since moving in significantly above state average.
- Percentage of population with a bachelor's degree or higher below state average.
Terryville on our top lists:
- #50 on the list of "Top 101 cities with the most residents born in United Kingdom (population 500+)"
- #50 on the list of "Top 101 cities with the most residents born in Yugoslavia (population 500+)"
- #50 on the list of "Top 101 cities with the most residents born in Asia, n.e.c. (population 500+)"
- #50 on the list of "Top 101 cities with the most residents born in Melanesia (population 500+)"
- #50 on the list of "Top 101 cities with the most residents born in Micronesia (population 500+)"
- #50 on the list of "Top 101 cities with the most residents born in Polynesia (population 500+)"
- #51 on the list of "Top 101 cities with largest percentage of males in occupations: health technologists and technicians (population 5,000+)"
- #72 on the list of "Top 101 cities with the most residents born in Other South Eastern Asia (population 500+)"
- #78 on the list of "Top 101 cities with the most residents born in Born at sea (population 500+)"
- #79 on the list of "Top 101 cities with the smallest percentage of likely homosexual households (counted as self-reported same-sex unmarried-partner households) (population 5,000+)"
- #7 on the list of "Top 101 counties with the lowest Particulate Matter (PM10) Annual air pollution readings in 2012 (µg/m3)"
- #10 on the list of "Top 101 counties with the lowest number of births per 1000 residents 2007-2013"
- #21 on the list of "Top 101 counties with the largest decrease in the number of births per 1000 residents 2000-2006 to 2007-2013 (pop 50,000+)"
- #38 on the list of "Top 101 counties with the lowest Particulate Matter (PM2.5) Annual air pollution readings in 2012 (µg/m3)"
- #39 on the list of "Top 101 counties with the highest carbon monoxide air pollution readings in 2012 (ppm)"

|
|
Total of 66 patent applications in 2008-2024.