Kimberly, Wisconsin Submit your own pictures of this village and show them to the world
OSM Map
General Map
Google Map
MSN Map
OSM Map
General Map
Google Map
MSN Map
OSM Map
General Map
Google Map
MSN Map
OSM Map
General Map
Google Map
MSN Map
Please wait while loading the map...
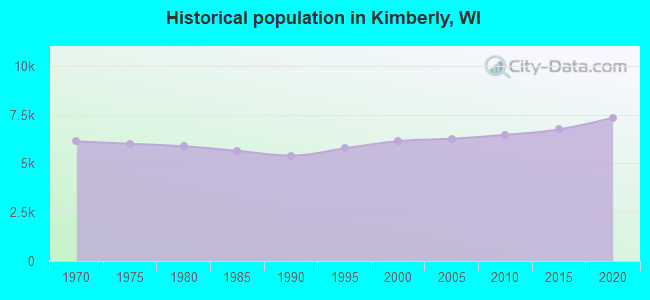
Population in 2022: 7,502 (100% urban, 0% rural). Population change since 2000: +22.1%Males: 3,786 Females: 3,716
March 2022 cost of living index in Kimberly: 92.1 (less than average, U.S. average is 100) Percentage of residents living in poverty in 2022: 9.2%for White Non-Hispanic residents , 100.0% for Black residents , 52.2% for Hispanic or Latino residents , 30.3% for other race residents , 25.2% for two or more races residents )Business Search - 14 Million verified businesses
Data:
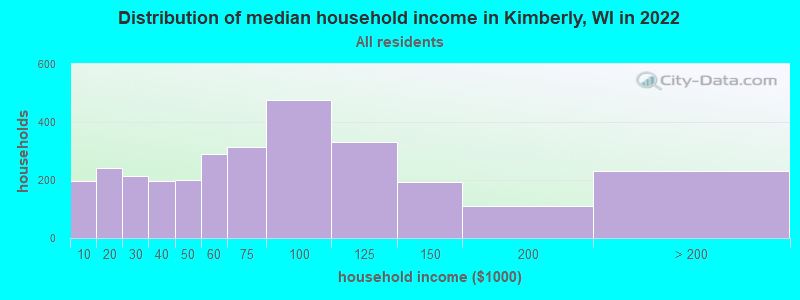
Median household income ($)
Median household income (% change since 2000)
Household income diversity
Ratio of average income to average house value (%)
Ratio of average income to average rent
Median household income ($) - White
Median household income ($) - Black or African American
Median household income ($) - Asian
Median household income ($) - Hispanic or Latino
Median household income ($) - American Indian and Alaska Native
Median household income ($) - Multirace
Median household income ($) - Other Race
Median household income for houses/condos with a mortgage ($)
Median household income for apartments without a mortgage ($)
Races - White alone (%)
Races - White alone (% change since 2000)
Races - Black alone (%)
Races - Black alone (% change since 2000)
Races - American Indian alone (%)
Races - American Indian alone (% change since 2000)
Races - Asian alone (%)
Races - Asian alone (% change since 2000)
Races - Hispanic (%)
Races - Hispanic (% change since 2000)
Races - Native Hawaiian and Other Pacific Islander alone (%)
Races - Native Hawaiian and Other Pacific Islander alone (% change since 2000)
Races - Two or more races (%)
Races - Two or more races (% change since 2000)
Races - Other race alone (%)
Races - Other race alone (% change since 2000)
Racial diversity
Unemployment (%)
Unemployment (% change since 2000)
Unemployment (%) - White
Unemployment (%) - Black or African American
Unemployment (%) - Asian
Unemployment (%) - Hispanic or Latino
Unemployment (%) - American Indian and Alaska Native
Unemployment (%) - Multirace
Unemployment (%) - Other Race
Population density (people per square mile)
Population - Males (%)
Population - Females (%)
Population - Males (%) - White
Population - Males (%) - Black or African American
Population - Males (%) - Asian
Population - Males (%) - Hispanic or Latino
Population - Males (%) - American Indian and Alaska Native
Population - Males (%) - Multirace
Population - Males (%) - Other Race
Population - Females (%) - White
Population - Females (%) - Black or African American
Population - Females (%) - Asian
Population - Females (%) - Hispanic or Latino
Population - Females (%) - American Indian and Alaska Native
Population - Females (%) - Multirace
Population - Females (%) - Other Race
Coronavirus confirmed cases (Jul 03, 2024)
Deaths caused by coronavirus (Jul 03, 2024)
Coronavirus confirmed cases (per 100k population) (Jul 03, 2024)
Deaths caused by coronavirus (per 100k population) (Jul 03, 2024)
Daily increase in number of cases (Jul 03, 2024)
Weekly increase in number of cases (Jul 03, 2024)
Cases doubled (in days) (Jul 03, 2024)
Hospitalized patients (Apr 18, 2022)
Negative test results (Apr 18, 2022)
Total test results (Apr 18, 2022)
COVID Vaccine doses distributed (per 100k population) (Sep 19, 2023)
COVID Vaccine doses administered (per 100k population) (Sep 19, 2023)
COVID Vaccine doses distributed (Sep 19, 2023)
COVID Vaccine doses administered (Sep 19, 2023)
Likely homosexual households (%)
Likely homosexual households (% change since 2000)
Likely homosexual households - Lesbian couples (%)
Likely homosexual households - Lesbian couples (% change since 2000)
Likely homosexual households - Gay men (%)
Likely homosexual households - Gay men (% change since 2000)
Cost of living index
Median gross rent ($)
Median contract rent ($)
Median monthly housing costs ($)
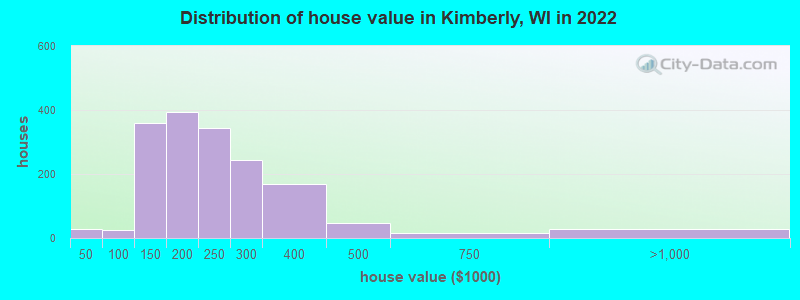
Median house or condo value ($)
Median house or condo value ($ change since 2000)
Mean house or condo value by units in structure - 1, detached ($)
Mean house or condo value by units in structure - 1, attached ($)
Mean house or condo value by units in structure - 2 ($)
Mean house or condo value by units in structure by units in structure - 3 or 4 ($)
Mean house or condo value by units in structure - 5 or more ($)
Mean house or condo value by units in structure - Boat, RV, van, etc. ($)
Mean house or condo value by units in structure - Mobile home ($)
Median house or condo value ($) - White
Median house or condo value ($) - Black or African American
Median house or condo value ($) - Asian
Median house or condo value ($) - Hispanic or Latino
Median house or condo value ($) - American Indian and Alaska Native
Median house or condo value ($) - Multirace
Median house or condo value ($) - Other Race
Median resident age
Resident age diversity
Median resident age - Males
Median resident age - Females
Median resident age - White
Median resident age - Black or African American
Median resident age - Asian
Median resident age - Hispanic or Latino
Median resident age - American Indian and Alaska Native
Median resident age - Multirace
Median resident age - Other Race
Median resident age - Males - White
Median resident age - Males - Black or African American
Median resident age - Males - Asian
Median resident age - Males - Hispanic or Latino
Median resident age - Males - American Indian and Alaska Native
Median resident age - Males - Multirace
Median resident age - Males - Other Race
Median resident age - Females - White
Median resident age - Females - Black or African American
Median resident age - Females - Asian
Median resident age - Females - Hispanic or Latino
Median resident age - Females - American Indian and Alaska Native
Median resident age - Females - Multirace
Median resident age - Females - Other Race
Commute - mean travel time to work (minutes)
Travel time to work - Less than 5 minutes (%)
Travel time to work - Less than 5 minutes (% change since 2000)
Travel time to work - 5 to 9 minutes (%)
Travel time to work - 5 to 9 minutes (% change since 2000)
Travel time to work - 10 to 19 minutes (%)
Travel time to work - 10 to 19 minutes (% change since 2000)
Travel time to work - 20 to 29 minutes (%)
Travel time to work - 20 to 29 minutes (% change since 2000)
Travel time to work - 30 to 39 minutes (%)
Travel time to work - 30 to 39 minutes (% change since 2000)
Travel time to work - 40 to 59 minutes (%)
Travel time to work - 40 to 59 minutes (% change since 2000)
Travel time to work - 60 to 89 minutes (%)
Travel time to work - 60 to 89 minutes (% change since 2000)
Travel time to work - 90 or more minutes (%)
Travel time to work - 90 or more minutes (% change since 2000)
Marital status - Never married (%)
Marital status - Now married (%)
Marital status - Separated (%)
Marital status - Widowed (%)
Marital status - Divorced (%)
Median family income ($)
Median family income (% change since 2000)
Median non-family income ($)
Median non-family income (% change since 2000)
Median per capita income ($)
Median per capita income (% change since 2000)
Median family income ($) - White
Median family income ($) - Black or African American
Median family income ($) - Asian
Median family income ($) - Hispanic or Latino
Median family income ($) - American Indian and Alaska Native
Median family income ($) - Multirace
Median family income ($) - Other Race
Median year house/condo built
Median year apartment built
Year house built - Built 2005 or later (%)
Year house built - Built 2000 to 2004 (%)
Year house built - Built 1990 to 1999 (%)
Year house built - Built 1980 to 1989 (%)
Year house built - Built 1970 to 1979 (%)
Year house built - Built 1960 to 1969 (%)
Year house built - Built 1950 to 1959 (%)
Year house built - Built 1940 to 1949 (%)
Year house built - Built 1939 or earlier (%)
Average household size
Household density (households per square mile)
Average household size - White
Average household size - Black or African American
Average household size - Asian
Average household size - Hispanic or Latino
Average household size - American Indian and Alaska Native
Average household size - Multirace
Average household size - Other Race
Occupied housing units (%)
Vacant housing units (%)
Owner occupied housing units (%)
Renter occupied housing units (%)
Vacancy status - For rent (%)
Vacancy status - For sale only (%)
Vacancy status - Rented or sold, not occupied (%)
Vacancy status - For seasonal, recreational, or occasional use (%)
Vacancy status - For migrant workers (%)
Vacancy status - Other vacant (%)
Residents with income below the poverty level (%)
Residents with income below 50% of the poverty level (%)
Children below poverty level (%)
Poor families by family type - Married-couple family (%)
Poor families by family type - Male, no wife present (%)
Poor families by family type - Female, no husband present (%)
Poverty status for native-born residents (%)
Poverty status for foreign-born residents (%)
Poverty among high school graduates not in families (%)
Poverty among people who did not graduate high school not in families (%)
Residents with income below the poverty level (%) - White
Residents with income below the poverty level (%) - Black or African American
Residents with income below the poverty level (%) - Asian
Residents with income below the poverty level (%) - Hispanic or Latino
Residents with income below the poverty level (%) - American Indian and Alaska Native
Residents with income below the poverty level (%) - Multirace
Residents with income below the poverty level (%) - Other Race
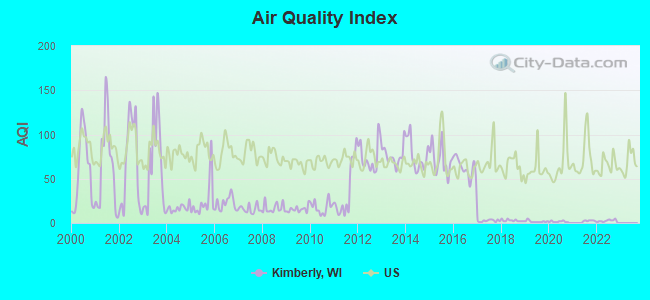
Air pollution - Air Quality Index (AQI)
Air pollution - CO
Air pollution - NO2
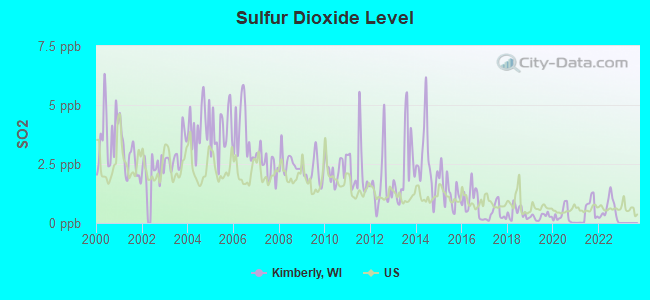
Air pollution - SO2
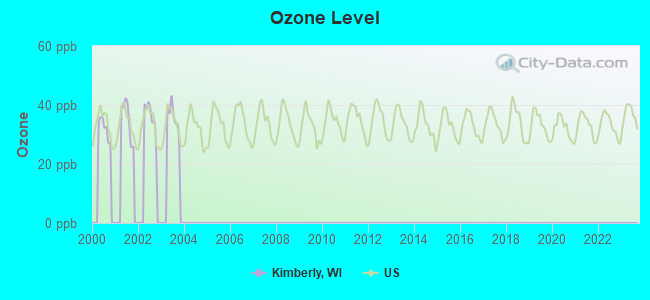
Air pollution - Ozone
Air pollution - PM10
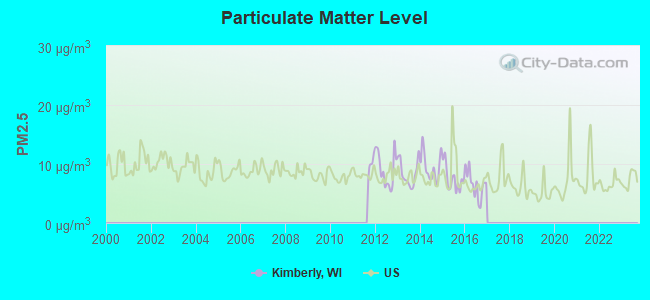
Air pollution - PM25
Air pollution - Pb
Crime - Murders per 100,000 population
Crime - Rapes per 100,000 population
Crime - Robberies per 100,000 population
Crime - Assaults per 100,000 population
Crime - Burglaries per 100,000 population
Crime - Thefts per 100,000 population
Crime - Auto thefts per 100,000 population
Crime - Arson per 100,000 population
Crime - City-data.com crime index
Crime - Violent crime index
Crime - Property crime index
Crime - Murders per 100,000 population (5 year average)
Crime - Rapes per 100,000 population (5 year average)
Crime - Robberies per 100,000 population (5 year average)
Crime - Assaults per 100,000 population (5 year average)
Crime - Burglaries per 100,000 population (5 year average)
Crime - Thefts per 100,000 population (5 year average)
Crime - Auto thefts per 100,000 population (5 year average)
Crime - Arson per 100,000 population (5 year average)
Crime - City-data.com crime index (5 year average)
Crime - Violent crime index (5 year average)
Crime - Property crime index (5 year average)
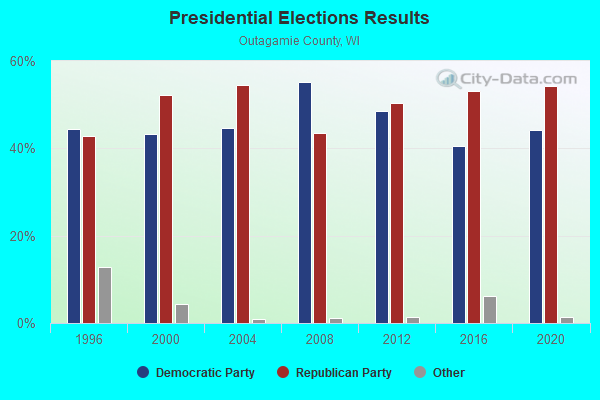
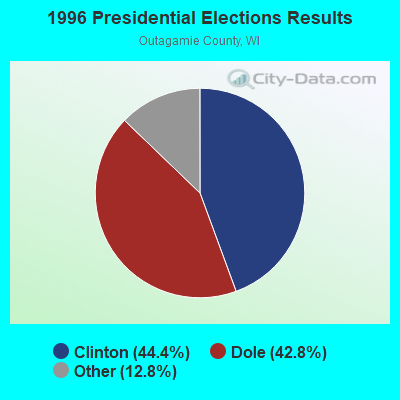
1996 Presidential Elections Results (%) - Democratic Party (Clinton)
1996 Presidential Elections Results (%) - Republican Party (Dole)
1996 Presidential Elections Results (%) - Other
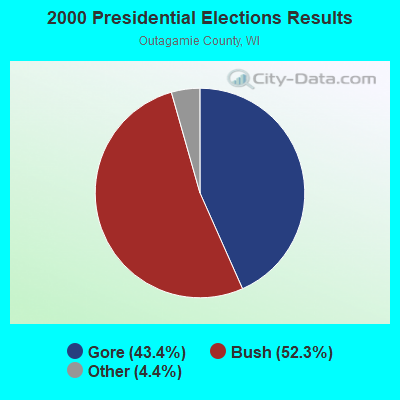
2000 Presidential Elections Results (%) - Democratic Party (Gore)
2000 Presidential Elections Results (%) - Republican Party (Bush)
2000 Presidential Elections Results (%) - Other
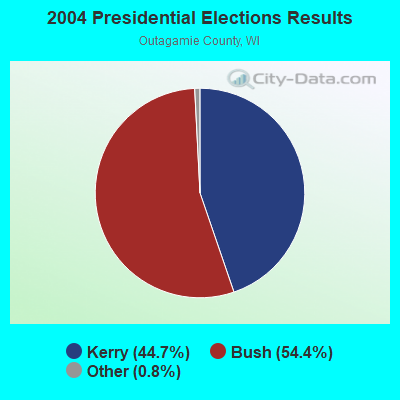
2004 Presidential Elections Results (%) - Democratic Party (Kerry)
2004 Presidential Elections Results (%) - Republican Party (Bush)
2004 Presidential Elections Results (%) - Other
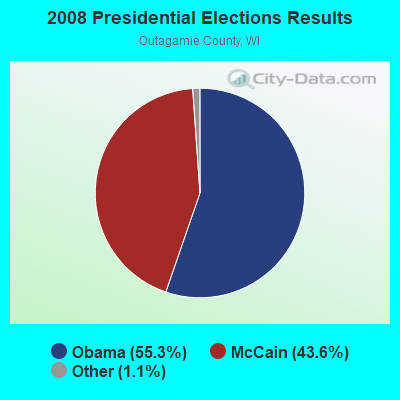
2008 Presidential Elections Results (%) - Democratic Party (Obama)
2008 Presidential Elections Results (%) - Republican Party (McCain)
2008 Presidential Elections Results (%) - Other
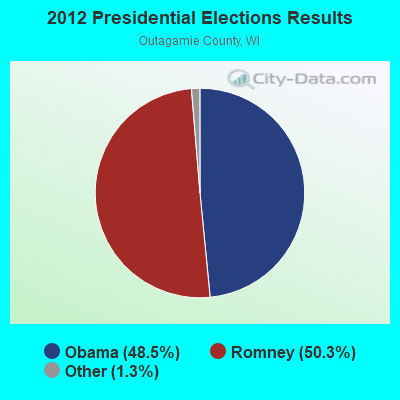
2012 Presidential Elections Results (%) - Democratic Party (Obama)
2012 Presidential Elections Results (%) - Republican Party (Romney)
2012 Presidential Elections Results (%) - Other
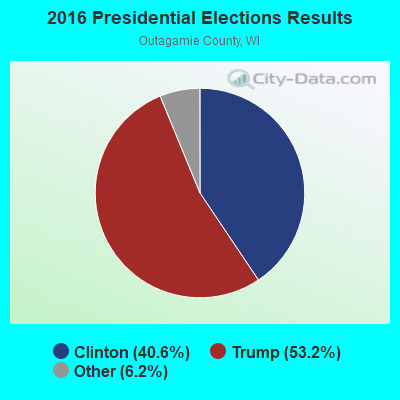
2016 Presidential Elections Results (%) - Democratic Party (Clinton)
2016 Presidential Elections Results (%) - Republican Party (Trump)
2016 Presidential Elections Results (%) - Other
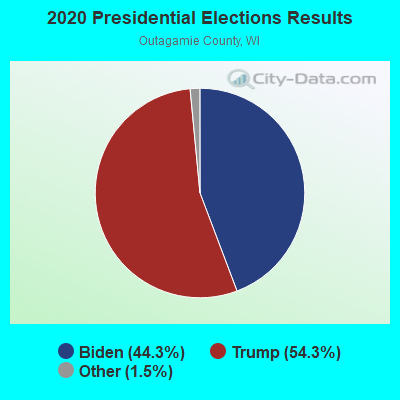
2020 Presidential Elections Results (%) - Democratic Party (Biden)
2020 Presidential Elections Results (%) - Republican Party (Trump)
2020 Presidential Elections Results (%) - Other
Ancestries Reported - Arab (%)
Ancestries Reported - Czech (%)
Ancestries Reported - Danish (%)
Ancestries Reported - Dutch (%)
Ancestries Reported - English (%)
Ancestries Reported - French (%)
Ancestries Reported - French Canadian (%)
Ancestries Reported - German (%)
Ancestries Reported - Greek (%)
Ancestries Reported - Hungarian (%)
Ancestries Reported - Irish (%)
Ancestries Reported - Italian (%)
Ancestries Reported - Lithuanian (%)
Ancestries Reported - Norwegian (%)
Ancestries Reported - Polish (%)
Ancestries Reported - Portuguese (%)
Ancestries Reported - Russian (%)
Ancestries Reported - Scotch-Irish (%)
Ancestries Reported - Scottish (%)
Ancestries Reported - Slovak (%)
Ancestries Reported - Subsaharan African (%)
Ancestries Reported - Swedish (%)
Ancestries Reported - Swiss (%)
Ancestries Reported - Ukrainian (%)
Ancestries Reported - United States (%)
Ancestries Reported - Welsh (%)
Ancestries Reported - West Indian (%)
Ancestries Reported - Other (%)
Educational Attainment - No schooling completed (%)
Educational Attainment - Less than high school (%)
Educational Attainment - High school or equivalent (%)
Educational Attainment - Less than 1 year of college (%)
Educational Attainment - 1 or more years of college (%)
Educational Attainment - Associate degree (%)
Educational Attainment - Bachelor's degree (%)
Educational Attainment - Master's degree (%)
Educational Attainment - Professional school degree (%)
Educational Attainment - Doctorate degree (%)
School Enrollment - Nursery, preschool (%)
School Enrollment - Kindergarten (%)
School Enrollment - Grade 1 to 4 (%)
School Enrollment - Grade 5 to 8 (%)
School Enrollment - Grade 9 to 12 (%)
School Enrollment - College undergrad (%)
School Enrollment - Graduate or professional (%)
School Enrollment - Not enrolled in school (%)
School enrollment - Public schools (%)
School enrollment - Private schools (%)
School enrollment - Not enrolled (%)
Median number of rooms in houses and condos
Median number of rooms in apartments
Housing units lacking complete plumbing facilities (%)
Housing units lacking complete kitchen facilities (%)
Density of houses
Urban houses (%)
Rural houses (%)
Households with people 60 years and over (%)
Households with people 65 years and over (%)
Households with people 75 years and over (%)
Households with one or more nonrelatives (%)
Households with no nonrelatives (%)
Population in households (%)
Family households (%)
Nonfamily households (%)
Population in families (%)
Family households with own children (%)
Median number of bedrooms in owner occupied houses
Mean number of bedrooms in owner occupied houses
Median number of bedrooms in renter occupied houses
Mean number of bedrooms in renter occupied houses
Median number of vehichles in owner occupied houses
Mean number of vehichles in owner occupied houses
Median number of vehichles in renter occupied houses
Mean number of vehichles in renter occupied houses
Mortgage status - with mortgage (%)
Mortgage status - with second mortgage (%)
Mortgage status - with home equity loan (%)
Mortgage status - with both second mortgage and home equity loan (%)
Mortgage status - without a mortgage (%)
Average family size
Average family size - White
Average family size - Black or African American
Average family size - Asian
Average family size - Hispanic or Latino
Average family size - American Indian and Alaska Native
Average family size - Multirace
Average family size - Other Race
Geographical mobility - Same house 1 year ago (%)
Geographical mobility - Moved within same county (%)
Geographical mobility - Moved from different county within same state (%)
Geographical mobility - Moved from different state (%)
Geographical mobility - Moved from abroad (%)
Place of birth - Born in state of residence (%)
Place of birth - Born in other state (%)
Place of birth - Native, outside of US (%)
Place of birth - Foreign born (%)
Housing units in structures - 1, detached (%)
Housing units in structures - 1, attached (%)
Housing units in structures - 2 (%)
Housing units in structures - 3 or 4 (%)
Housing units in structures - 5 to 9 (%)
Housing units in structures - 10 to 19 (%)
Housing units in structures - 20 to 49 (%)
Housing units in structures - 50 or more (%)
Housing units in structures - Mobile home (%)
Housing units in structures - Boat, RV, van, etc. (%)
House/condo owner moved in on average (years ago)
Renter moved in on average (years ago)
Year householder moved into unit - Moved in 1999 to March 2000 (%)
Year householder moved into unit - Moved in 1995 to 1998 (%)
Year householder moved into unit - Moved in 1990 to 1994 (%)
Year householder moved into unit - Moved in 1980 to 1989 (%)
Year householder moved into unit - Moved in 1970 to 1979 (%)
Year householder moved into unit - Moved in 1969 or earlier (%)
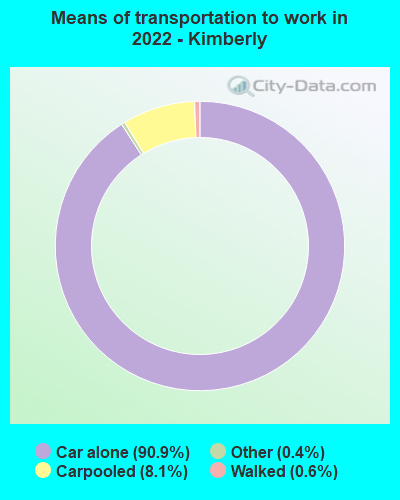
Means of transportation to work - Drove car alone (%)
Means of transportation to work - Carpooled (%)
Means of transportation to work - Public transportation (%)
Means of transportation to work - Bus or trolley bus (%)
Means of transportation to work - Streetcar or trolley car (%)
Means of transportation to work - Subway or elevated (%)
Means of transportation to work - Railroad (%)
Means of transportation to work - Ferryboat (%)
Means of transportation to work - Taxicab (%)
Means of transportation to work - Motorcycle (%)
Means of transportation to work - Bicycle (%)
Means of transportation to work - Walked (%)
Means of transportation to work - Other means (%)
Working at home (%)
Industry diversity
Most Common Industries - Agriculture, forestry, fishing and hunting, and mining (%)
Most Common Industries - Agriculture, forestry, fishing and hunting (%)
Most Common Industries - Mining, quarrying, and oil and gas extraction (%)
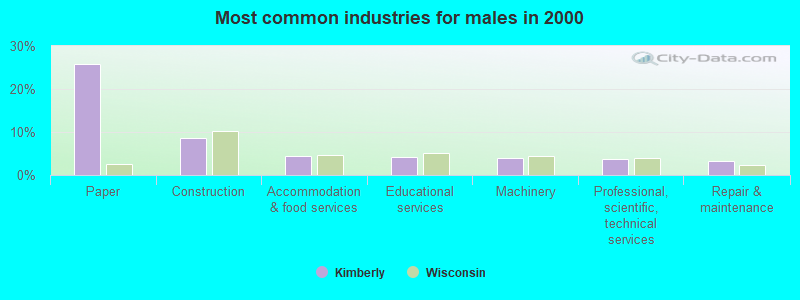
Most Common Industries - Construction (%)
Most Common Industries - Manufacturing (%)
Most Common Industries - Wholesale trade (%)
Most Common Industries - Retail trade (%)
Most Common Industries - Transportation and warehousing, and utilities (%)
Most Common Industries - Transportation and warehousing (%)
Most Common Industries - Utilities (%)
Most Common Industries - Information (%)
Most Common Industries - Finance and insurance, and real estate and rental and leasing (%)
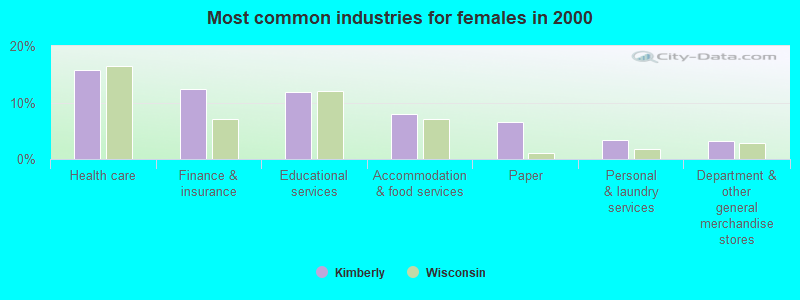
Most Common Industries - Finance and insurance (%)
Most Common Industries - Real estate and rental and leasing (%)
Most Common Industries - Professional, scientific, and management, and administrative and waste management services (%)
Most Common Industries - Professional, scientific, and technical services (%)
Most Common Industries - Management of companies and enterprises (%)
Most Common Industries - Administrative and support and waste management services (%)
Most Common Industries - Educational services, and health care and social assistance (%)
Most Common Industries - Educational services (%)
Most Common Industries - Health care and social assistance (%)
Most Common Industries - Arts, entertainment, and recreation, and accommodation and food services (%)
Most Common Industries - Arts, entertainment, and recreation (%)
Most Common Industries - Accommodation and food services (%)
Most Common Industries - Other services, except public administration (%)
Most Common Industries - Public administration (%)
Occupation diversity
Most Common Occupations - Management, business, science, and arts occupations (%)
Most Common Occupations - Management, business, and financial occupations (%)
Most Common Occupations - Management occupations (%)
Most Common Occupations - Business and financial operations occupations (%)
Most Common Occupations - Computer, engineering, and science occupations (%)
Most Common Occupations - Computer and mathematical occupations (%)
Most Common Occupations - Architecture and engineering occupations (%)
Most Common Occupations - Life, physical, and social science occupations (%)
Most Common Occupations - Education, legal, community service, arts, and media occupations (%)
Most Common Occupations - Community and social service occupations (%)
Most Common Occupations - Legal occupations (%)
Most Common Occupations - Education, training, and library occupations (%)
Most Common Occupations - Arts, design, entertainment, sports, and media occupations (%)
Most Common Occupations - Healthcare practitioners and technical occupations (%)
Most Common Occupations - Health diagnosing and treating practitioners and other technical occupations (%)
Most Common Occupations - Health technologists and technicians (%)
Most Common Occupations - Service occupations (%)
Most Common Occupations - Healthcare support occupations (%)
Most Common Occupations - Protective service occupations (%)
Most Common Occupations - Fire fighting and prevention, and other protective service workers including supervisors (%)
Most Common Occupations - Law enforcement workers including supervisors (%)
Most Common Occupations - Food preparation and serving related occupations (%)
Most Common Occupations - Building and grounds cleaning and maintenance occupations (%)
Most Common Occupations - Personal care and service occupations (%)
Most Common Occupations - Sales and office occupations (%)
Most Common Occupations - Sales and related occupations (%)
Most Common Occupations - Office and administrative support occupations (%)
Most Common Occupations - Natural resources, construction, and maintenance occupations (%)
Most Common Occupations - Farming, fishing, and forestry occupations (%)
Most Common Occupations - Construction and extraction occupations (%)
Most Common Occupations - Installation, maintenance, and repair occupations (%)
Most Common Occupations - Production, transportation, and material moving occupations (%)
Most Common Occupations - Production occupations (%)
Most Common Occupations - Transportation occupations (%)
Most Common Occupations - Material moving occupations (%)
People in Group quarters - Institutionalized population (%)
People in Group quarters - Correctional institutions (%)
People in Group quarters - Federal prisons and detention centers (%)
People in Group quarters - Halfway houses (%)
People in Group quarters - Local jails and other confinement facilities (including police lockups) (%)
People in Group quarters - Military disciplinary barracks (%)
People in Group quarters - State prisons (%)
People in Group quarters - Other types of correctional institutions (%)
People in Group quarters - Nursing homes (%)
People in Group quarters - Hospitals/wards, hospices, and schools for the handicapped (%)
People in Group quarters - Hospitals/wards and hospices for chronically ill (%)
People in Group quarters - Hospices or homes for chronically ill (%)
People in Group quarters - Military hospitals or wards for chronically ill (%)
People in Group quarters - Other hospitals or wards for chronically ill (%)
People in Group quarters - Hospitals or wards for drug/alcohol abuse (%)
People in Group quarters - Mental (Psychiatric) hospitals or wards (%)
People in Group quarters - Schools, hospitals, or wards for the mentally retarded (%)
People in Group quarters - Schools, hospitals, or wards for the physically handicapped (%)
People in Group quarters - Institutions for the deaf (%)
People in Group quarters - Institutions for the blind (%)
People in Group quarters - Orthopedic wards and institutions for the physically handicapped (%)
People in Group quarters - Wards in general hospitals for patients who have no usual home elsewhere (%)
People in Group quarters - Wards in military hospitals for patients who have no usual home elsewhere (%)
People in Group quarters - Juvenile institutions (%)
People in Group quarters - Long-term care (%)
People in Group quarters - Homes for abused, dependent, and neglected children (%)
People in Group quarters - Residential treatment centers for emotionally disturbed children (%)
People in Group quarters - Training schools for juvenile delinquents (%)
People in Group quarters - Short-term care, detention or diagnostic centers for delinquent children (%)
People in Group quarters - Type of juvenile institution unknown (%)
People in Group quarters - Noninstitutionalized population (%)
People in Group quarters - College dormitories (includes college quarters off campus) (%)
People in Group quarters - Military quarters (%)
People in Group quarters - On base (%)
People in Group quarters - Barracks, unaccompanied personnel housing (UPH), (Enlisted/Officer), ;and similar group living quarters for military personnel (%)
People in Group quarters - Transient quarters for temporary residents (%)
People in Group quarters - Military ships (%)
People in Group quarters - Group homes (%)
People in Group quarters - Homes or halfway houses for drug/alcohol abuse (%)
People in Group quarters - Homes for the mentally ill (%)
People in Group quarters - Homes for the mentally retarded (%)
People in Group quarters - Homes for the physically handicapped (%)
People in Group quarters - Other group homes (%)
People in Group quarters - Religious group quarters (%)
People in Group quarters - Dormitories (%)
People in Group quarters - Agriculture workers' dormitories on farms (%)
People in Group quarters - Job Corps and vocational training facilities (%)
People in Group quarters - Other workers' dormitories (%)
People in Group quarters - Crews of maritime vessels (%)
People in Group quarters - Other nonhousehold living situations (%)
People in Group quarters - Other noninstitutional group quarters (%)
Residents speaking English at home (%)
Residents speaking English at home - Born in the United States (%)
Residents speaking English at home - Native, born elsewhere (%)
Residents speaking English at home - Foreign born (%)
Residents speaking Spanish at home (%)
Residents speaking Spanish at home - Born in the United States (%)
Residents speaking Spanish at home - Native, born elsewhere (%)
Residents speaking Spanish at home - Foreign born (%)
Residents speaking other language at home (%)
Residents speaking other language at home - Born in the United States (%)
Residents speaking other language at home - Native, born elsewhere (%)
Residents speaking other language at home - Foreign born (%)
Class of Workers - Employee of private company (%)
Class of Workers - Self-employed in own incorporated business (%)
Class of Workers - Private not-for-profit wage and salary workers (%)
Class of Workers - Local government workers (%)
Class of Workers - State government workers (%)
Class of Workers - Federal government workers (%)
Class of Workers - Self-employed workers in own not incorporated business and Unpaid family workers (%)
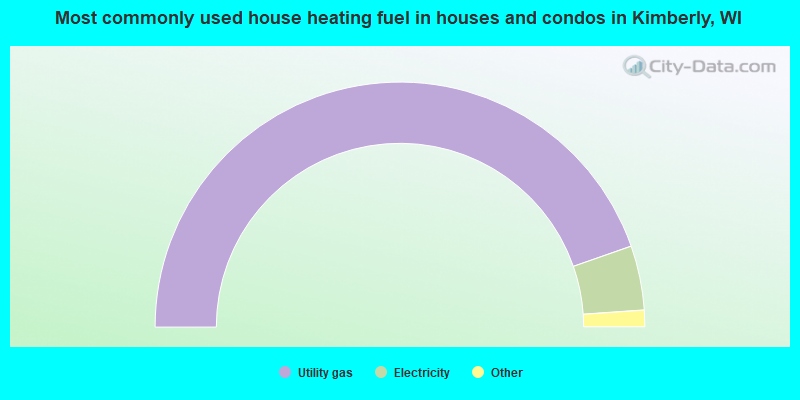
House heating fuel used in houses and condos - Utility gas (%)
House heating fuel used in houses and condos - Bottled, tank, or LP gas (%)
House heating fuel used in houses and condos - Electricity (%)
House heating fuel used in houses and condos - Fuel oil, kerosene, etc. (%)
House heating fuel used in houses and condos - Coal or coke (%)
House heating fuel used in houses and condos - Wood (%)
House heating fuel used in houses and condos - Solar energy (%)
House heating fuel used in houses and condos - Other fuel (%)
House heating fuel used in houses and condos - No fuel used (%)
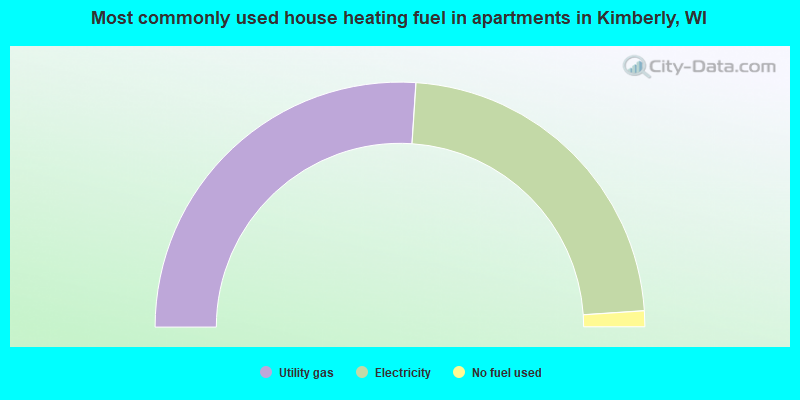
House heating fuel used in apartments - Utility gas (%)
House heating fuel used in apartments - Bottled, tank, or LP gas (%)
House heating fuel used in apartments - Electricity (%)
House heating fuel used in apartments - Fuel oil, kerosene, etc. (%)
House heating fuel used in apartments - Coal or coke (%)
House heating fuel used in apartments - Wood (%)
House heating fuel used in apartments - Solar energy (%)
House heating fuel used in apartments - Other fuel (%)
House heating fuel used in apartments - No fuel used (%)
Armed forces status - In Armed Forces (%)
Armed forces status - Civilian (%)
Armed forces status - Civilian - Veteran (%)
Armed forces status - Civilian - Nonveteran (%)
Fatal accidents locations in years 2005-2021
Fatal accidents locations in 2005
Fatal accidents locations in 2006
Fatal accidents locations in 2007
Fatal accidents locations in 2008
Fatal accidents locations in 2009
Fatal accidents locations in 2010
Fatal accidents locations in 2011
Fatal accidents locations in 2012
Fatal accidents locations in 2013
Fatal accidents locations in 2014
Fatal accidents locations in 2015
Fatal accidents locations in 2016
Fatal accidents locations in 2017
Fatal accidents locations in 2018
Fatal accidents locations in 2019
Fatal accidents locations in 2020
Fatal accidents locations in 2021
Alcohol use - People drinking some alcohol every month (%)
Alcohol use - People not drinking at all (%)
Alcohol use - Average days/month drinking alcohol
Alcohol use - Average drinks/week
Alcohol use - Average days/year people drink much
Audiometry - Average condition of hearing (%)
Audiometry - People that can hear a whisper from across a quiet room (%)
Audiometry - People that can hear normal voice from across a quiet room (%)
Audiometry - Ears ringing, roaring, buzzing (%)
Audiometry - Had a job exposure to loud noise (%)
Audiometry - Had off-work exposure to loud noise (%)
Blood Pressure & Cholesterol - Has high blood pressure (%)
Blood Pressure & Cholesterol - Checking blood pressure at home (%)
Blood Pressure & Cholesterol - Frequently checking blood cholesterol (%)
Blood Pressure & Cholesterol - Has high cholesterol level (%)
Consumer Behavior - Money monthly spent on food at supermarket/grocery store
Consumer Behavior - Money monthly spent on food at other stores
Consumer Behavior - Money monthly spent on eating out
Consumer Behavior - Money monthly spent on carryout/delivered foods
Consumer Behavior - Income spent on food at supermarket/grocery store (%)
Consumer Behavior - Income spent on food at other stores (%)
Consumer Behavior - Income spent on eating out (%)
Consumer Behavior - Income spent on carryout/delivered foods (%)
Current Health Status - General health condition (%)
Current Health Status - Blood donors (%)
Current Health Status - Has blood ever tested for HIV virus (%)
Current Health Status - Left-handed people (%)
Dermatology - People using sunscreen (%)
Diabetes - Diabetics (%)
Diabetes - Had a blood test for high blood sugar (%)
Diabetes - People taking insulin (%)
Diet Behavior & Nutrition - Diet health (%)
Diet Behavior & Nutrition - Milk product consumption (# of products/month)
Diet Behavior & Nutrition - Meals not home prepared (#/week)
Diet Behavior & Nutrition - Meals from fast food or pizza place (#/week)
Diet Behavior & Nutrition - Ready-to-eat foods (#/month)
Diet Behavior & Nutrition - Frozen meals/pizza (#/month)
Drug Use - People that ever used marijuana or hashish (%)
Drug Use - Ever used hard drugs (%)
Drug Use - Ever used any form of cocaine (%)
Drug Use - Ever used heroin (%)
Drug Use - Ever used methamphetamine (%)
Health Insurance - People covered by health insurance (%)
Kidney Conditions-Urology - Avg. # of times urinating at night
Medical Conditions - People with asthma (%)
Medical Conditions - People with anemia (%)
Medical Conditions - People with psoriasis (%)
Medical Conditions - People with overweight (%)
Medical Conditions - Elderly people having difficulties in thinking or remembering (%)
Medical Conditions - People who ever received blood transfusion (%)
Medical Conditions - People having trouble seeing even with glass/contacts (%)
Medical Conditions - People with arthritis (%)
Medical Conditions - People with gout (%)
Medical Conditions - People with congestive heart failure (%)
Medical Conditions - People with coronary heart disease (%)
Medical Conditions - People with angina pectoris (%)
Medical Conditions - People who ever had heart attack (%)
Medical Conditions - People who ever had stroke (%)
Medical Conditions - People with emphysema (%)
Medical Conditions - People with thyroid problem (%)
Medical Conditions - People with chronic bronchitis (%)
Medical Conditions - People with any liver condition (%)
Medical Conditions - People who ever had cancer or malignancy (%)
Mental Health - People who have little interest in doing things (%)
Mental Health - People feeling down, depressed, or hopeless (%)
Mental Health - People who have trouble sleeping or sleeping too much (%)
Mental Health - People feeling tired or having little energy (%)
Mental Health - People with poor appetite or overeating (%)
Mental Health - People feeling bad about themself (%)
Mental Health - People who have trouble concentrating on things (%)
Mental Health - People moving or speaking slowly or too fast (%)
Mental Health - People having thoughts they would be better off dead (%)
Oral Health - Average years since last visit a dentist
Oral Health - People embarrassed because of mouth (%)
Oral Health - People with gum disease (%)
Oral Health - General health of teeth and gums (%)
Oral Health - Average days a week using dental floss/device
Oral Health - Average days a week using mouthwash for dental problem
Oral Health - Average number of teeth
Pesticide Use - Households using pesticides to control insects (%)
Pesticide Use - Households using pesticides to kill weeds (%)
Physical Activity - People doing vigorous-intensity work activities (%)
Physical Activity - People doing moderate-intensity work activities (%)
Physical Activity - People walking or bicycling (%)
Physical Activity - People doing vigorous-intensity recreational activities (%)
Physical Activity - People doing moderate-intensity recreational activities (%)
Physical Activity - Average hours a day doing sedentary activities
Physical Activity - Average hours a day watching TV or videos
Physical Activity - Average hours a day using computer
Physical Functioning - People having limitations keeping them from working (%)
Physical Functioning - People limited in amount of work they can do (%)
Physical Functioning - People that need special equipment to walk (%)
Physical Functioning - People experiencing confusion/memory problems (%)
Physical Functioning - People requiring special healthcare equipment (%)
Prescription Medications - Average number of prescription medicines taking
Preventive Aspirin Use - Adults 40+ taking low-dose aspirin (%)
Reproductive Health - Vaginal deliveries (%)
Reproductive Health - Cesarean deliveries (%)
Reproductive Health - Deliveries resulted in a live birth (%)
Reproductive Health - Pregnancies resulted in a delivery (%)
Reproductive Health - Women breastfeeding newborns (%)
Reproductive Health - Women that had a hysterectomy (%)
Reproductive Health - Women that had both ovaries removed (%)
Reproductive Health - Women that have ever taken birth control pills (%)
Reproductive Health - Women taking birth control pills (%)
Reproductive Health - Women that have ever used Depo-Provera or injectables (%)
Reproductive Health - Women that have ever used female hormones (%)
Sexual Behavior - People 18+ that ever had sex (vaginal, anal, or oral) (%)
Sexual Behavior - Males 18+ that ever had vaginal sex with a woman (%)
Sexual Behavior - Males 18+ that ever performed oral sex on a woman (%)
Sexual Behavior - Males 18+ that ever had anal sex with a woman (%)
Sexual Behavior - Males 18+ that ever had any sex with a man (%)
Sexual Behavior - Females 18+ that ever had vaginal sex with a man (%)
Sexual Behavior - Females 18+ that ever performed oral sex on a man (%)
Sexual Behavior - Females 18+ that ever had anal sex with a man (%)
Sexual Behavior - Females 18+ that ever had any kind of sex with a woman (%)
Sexual Behavior - Average age people first had sex
Sexual Behavior - Average number of female sex partners in lifetime (males 18+)
Sexual Behavior - Average number of female vaginal sex partners in lifetime (males 18+)
Sexual Behavior - Average age people first performed oral sex on a woman (18+)
Sexual Behavior - Average number of woman performed oral sex on in lifetime (18+)
Sexual Behavior - Average number of male sex partners in lifetime (males 18+)
Sexual Behavior - Average number of male anal sex partners in lifetime (males 18+)
Sexual Behavior - Average age people first performed oral sex on a man (18+)
Sexual Behavior - Average number of male oral sex partners in lifetime (18+)
Sexual Behavior - People using protection when performing oral sex (%)
Sexual Behavior - Average number of times people have vaginal or anal sex a year
Sexual Behavior - People having sex without condom (%)
Sexual Behavior - Average number of male sex partners in lifetime (females 18+)
Sexual Behavior - Average number of male vaginal sex partners in lifetime (females 18+)
Sexual Behavior - Average number of female sex partners in lifetime (females 18+)
Sexual Behavior - Circumcised males 18+ (%)
Sleep Disorders - Average hours sleeping at night
Sleep Disorders - People that has trouble sleeping (%)
Smoking-Cigarette Use - People smoking cigarettes (%)
Taste & Smell - People 40+ having problems with smell (%)
Taste & Smell - People 40+ having problems with taste (%)
Taste & Smell - People 40+ that ever had wisdom teeth removed (%)
Taste & Smell - People 40+ that ever had tonsils teeth removed (%)
Taste & Smell - People 40+ that ever had a loss of consciousness because of a head injury (%)
Taste & Smell - People 40+ that ever had a broken nose or other serious injury to face or skull (%)
Taste & Smell - People 40+ that ever had two or more sinus infections (%)
Weight - Average height (inches)
Weight - Average weight (pounds)
Weight - Average BMI
Weight - People that are obese (%)
Weight - People that ever were obese (%)
Weight - People trying to lose weight (%)
According to our research of Wisconsin and other state lists, there were 10 registered sex offenders living in Kimberly, Wisconsin as of July 03, 2024 . The ratio of all residents to sex offenders in Kimberly is 671 to 1.The ratio of registered sex offenders to all residents in this city is lower than the state average.
Latest news from Kimberly, WI collected exclusively by city-data.com from local newspapers, TV, and radio stations
Ancestries: German (33.5%), Dutch (9.0%), French Canadian (6.4%), American (4.3%), Irish (3.8%), Polish (3.5%).
Current Local Time:
Land area: 1.88 square miles.
Population density: 3,986 people per square mile (average).
240 residents are foreign born (2.7% Asia , 0.5% Latin America ).
This village:
3.2%Wisconsin:
5.0%
Median real estate property taxes paid for housing units with mortgages in 2022: $2,788 (1.4%)Median real estate property taxes paid for housing units with no mortgage in 2022: $2,986 (1.4%)
Nearest city with pop. 50,000+: Appleton, WI
Nearest city with pop. 200,000+: Milwaukee, WI
Nearest city with pop. 1,000,000+: Chicago, IL
Nearest cities:
Latitude: 44.27 N, Longitude: 88.34 W
Daytime population change due to commuting: -373 (-5.0%)Workers who live and work in this village: 485 (14.7%)
Area code commonly used in this area: 920
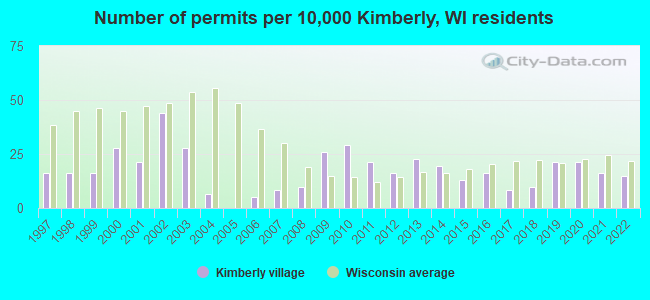
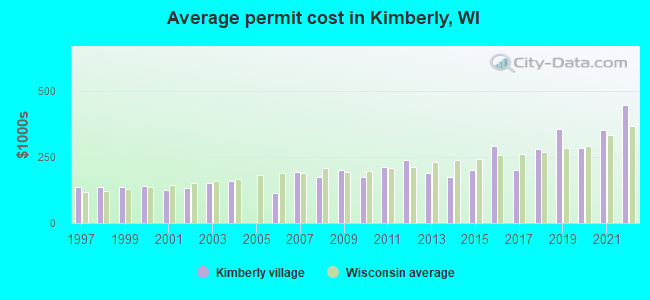
Single-family new house construction building permits:
2022: 9 buildings , average cost: $446,6002021: 10 buildings , average cost: $353,1002020: 13 buildings , average cost: $284,5002019: 13 buildings , average cost: $356,2002018: 6 buildings , average cost: $278,8002017: 5 buildings , average cost: $200,6002016: 10 buildings , average cost: $290,5002015: 8 buildings , average cost: $199,8002014: 12 buildings , average cost: $173,2002013: 14 buildings , average cost: $189,9002012: 10 buildings , average cost: $239,6002011: 13 buildings , average cost: $212,5002010: 18 buildings , average cost: $174,7002009: 16 buildings , average cost: $200,0002008: 6 buildings , average cost: $175,2002007: 5 buildings , average cost: $191,0002006: 3 buildings , average cost: $111,7002004: 4 buildings , average cost: $160,0002003: 17 buildings , average cost: $150,8002002: 27 buildings , average cost: $132,6002001: 13 buildings , average cost: $123,1002000: 17 buildings , average cost: $139,1001999: 10 buildings , average cost: $135,9001998: 10 buildings , average cost: $134,9001997: 10 buildings , average cost: $137,400Unemployment in December 2023:
Population change in the 1990s: +711 (+13.1%).
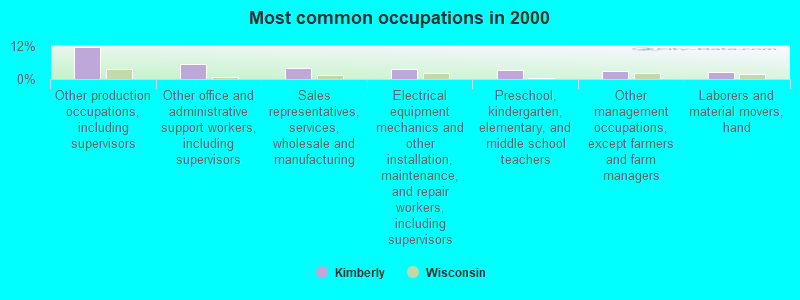
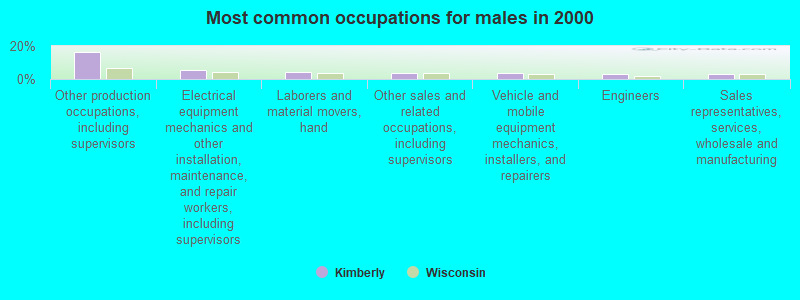
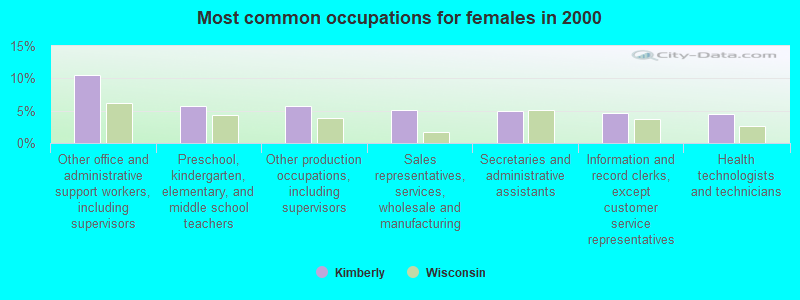
Most common occupations in Kimberly, WI (%)
Both Males Females
Other production occupations, including supervisors (11.7%)
Other office and administrative support workers, including supervisors (5.6%)
Sales representatives, services, wholesale and manufacturing (3.9%)
Electrical equipment mechanics and other installation, maintenance, and repair workers, including supervisors (3.5%)
Preschool, kindergarten, elementary, and middle school teachers (3.2%)
Other management occupations, except farmers and farm managers (2.8%)
Laborers and material movers, hand (2.6%)
Other production occupations, including supervisors (16.6%)
Electrical equipment mechanics and other installation, maintenance, and repair workers, including supervisors (5.7%)
Laborers and material movers, hand (4.1%)
Other sales and related occupations, including supervisors (3.9%)
Vehicle and mobile equipment mechanics, installers, and repairers (3.6%)
Engineers (3.0%)
Sales representatives, services, wholesale and manufacturing (3.0%)
Other office and administrative support workers, including supervisors (10.5%)
Preschool, kindergarten, elementary, and middle school teachers (5.7%)
Other production occupations, including supervisors (5.7%)
Sales representatives, services, wholesale and manufacturing (5.1%)
Secretaries and administrative assistants (5.0%)
Information and record clerks, except customer service representatives (4.6%)
Health technologists and technicians (4.5%)
Tornado activity:
Kimberly-area historical tornado activity is near Wisconsin state average. It is 19% greater than the overall U.S. average.
On 4/27/1984, a category F4 (max. wind speeds 207-260 mph) tornado 12.7 miles away from the Kimberly village center killed one person and injured 19 people and caused between $500,000 and $5,000,000 in damages.
On 4/21/1974, a category F4 tornado 16.7 miles away from the village center injured 35 people and caused between $500,000 and $5,000,000 in damages.
Earthquake activity:
Kimberly-area historical earthquake activity is significantly above Wisconsin state average. It is 14% smaller than the overall U.S. average. On 4/18/2008 at 09:36:59, a magnitude 5.4 (5.1 MB, 4.8 MS, 5.4 MW, 5.2 MW, Class: Moderate, Intensity: VI - VII) earthquake occurred 403.0 miles away from the city center On 6/28/2004 at 06:10:52, a magnitude 4.2 (4.2 MW, Depth: 6.2 mi, Class: Light, Intensity: IV - V) earthquake occurred 196.3 miles away from the city center On 5/2/2015 at 16:23:07, a magnitude 4.2 (4.2 MW, Depth: 2.8 mi) earthquake occurred 203.1 miles away from Kimberly center On 6/10/1987 at 23:48:54, a magnitude 5.1 (4.9 MB, 4.4 MS, 4.6 MS, 5.1 LG) earthquake occurred 377.5 miles away from Kimberly center On 4/18/2008 at 09:36:59, a magnitude 5.2 (5.2 MW, Depth: 8.9 mi) earthquake occurred 403.0 miles away from the city center On 2/10/2010 at 09:59:35, a magnitude 3.8 (3.8 MW, Depth: 6.2 mi, Class: Light, Intensity: II - III) earthquake occurred 159.2 miles away from the city center Magnitude types: regional Lg-wave magnitude (LG), body-wave magnitude (MB), surface-wave magnitude (MS), moment magnitude (MW) Natural disasters: The number of natural disasters in Outagamie County (9) is smaller than the US average (15).Major Disasters (Presidential) Declared: 6Emergencies Declared: 2Floods: 6, Storms: 5, Tornadoes: 3, Drought: 1, Hurricane: 1, Wind: 1, Other: 1 (Note: some incidents may be assigned to more than one category). Hospitals and medical centers near Kimberly: COLONY OAKS CARE CTR (Nursing Home, about 2 miles away; APPLETON, WI)
PARKSIDE CARE CENTER, LLC (Nursing Home, about 2 miles away; LITTLE CHUTE, WI)
APPLETON MED CTR (about 3 miles away; APPLETON, WI)
APPLETON HEALTH CARE CENTER (Nursing Home, about 4 miles away; APPLETON, WI)
FRANCISCAN CARE CENTER INC (Nursing Home, about 4 miles away; APPLETON, WI)
KAUKAUNA COMMUNITY HOSPITAL (Hospital, about 4 miles away; KAUKAUNA, WI)
ST PAUL ELDER SERVICES, INC (Nursing Home, about 4 miles away; KAUKAUNA, WI)
Amtrak station near Kimberly: 4 miles: APPLETON (500 N. ONEIDA ST.) - Bus Station Services: enclosed waiting area, intercity bus service.
Colleges/universities with over 2000 students nearest to Kimberly:
Lawrence University (about 4 miles; Appleton, WI ; Full-time enrollment: 2,821)
Fox Valley Technical College (about 7 miles; Appleton, WI ; FT enrollment: 5,682)
Saint Norbert College (about 19 miles; De Pere, WI ; FT enrollment: 2,324)
University of Wisconsin-Oshkosh (about 20 miles; Oshkosh, WI ; FT enrollment: 10,637)
Northeast Wisconsin Technical College (about 22 miles; Green Bay, WI ; FT enrollment: 6,069)
University of Wisconsin-Green Bay (about 28 miles; Green Bay, WI ; FT enrollment: 5,415)
Moraine Park Technical College (about 34 miles; Fond du Lac, WI ; FT enrollment: 3,079)
Public high schools in Kimberly: KIMBERLY HIGH Students: 1,379, Location: 1662 E KENNEDY AVE, Grades: 9-12)KORNERSTONE SCHOOL Students: 42, Location: 217 E KIMBERLY AVE, Grades: 8-12, Charter school )Public elementary/middle schools in Kimberly:
Private elementary/middle school in Kimberly: APPLETON CHRISTIAN SCHOOLS Students: 118, Location: 614 E KIMBERLY AVE, Grades: PK-8)
See full list of schools located in Kimberly Library in Kimberly: KIMBERLY--LITTLE CHUTE PUBLIC LIBRARY Operating income: $711,183; Location: 515 W. KIMBERLY AVE.; 104,034 books ; 13,261 e-books ; 7,994 audio materials ; 6,934 video materials ; 2 local licensed databases ; 28 state licensed databases ; 11 other licensed databases ; 170 print serial subscriptions )
Birthplace of: Chris Van Cuyk - Baseball player.
Outagamie County has a predicted average indoor radon screening level between 2 and 4 pCi/L (pico curies per liter) - Moderate Potential Drinking water stations with addresses in Kimberly and their reported violations in the past:
KIMBERLY WATERWORKS (Population served: 6,451, Groundwater):
Past monitoring violations:
Monitoring, Source Water (GWR) - In JUL-2013, Contaminant: E. COLI. Follow-up actions: St Public Notif requested (SEP-04-2013), St Violation/Reminder Notice (SEP-04-2013), St Compliance achieved (SEP-09-2013), St Public Notif received (JUN-11-2014)
9 regular monitoring violations
Average household size: This village:
2.4 peopleWisconsin:
2.4 people
Percentage of family households: This village:
64.3%Whole state:
64.4%
Percentage of households with unmarried partners: This village:
6.2%Whole state:
7.3%
Likely homosexual households (counted as self-reported same-sex unmarried-partner households)
Lesbian couples: 0.2% of all households Gay men: 0.1% of all households
People in group quarters in Kimberly in 2010:
19 people in nursing facilities/skilled-nursing facilities
8 people in group homes intended for adults
3 people in other noninstitutional facilities
people in other noninstitutional group quarters in 2000Banks with branches in Kimberly (2011 data):
Associated Bank, National Association: Kimberly Branch at 600 West Kimberly Avenue, branch established on 1920/09/20; Appleton East Loan Production Branch at 702 Eisenhower Drive, Suite D, branch established on 2004/06/30. Info updated 2008/09/12: Bank assets: $21,715.0 mil, Deposits: $15,244.4 mil, headquarters in Green Bay, WI, positive income , Commercial Lending Specialization, 282 total offices , Holding Company: Associated Banc-Corp
East Wisconsin Savings Bank, S.A.: 220 W Kimberly Ave Branch at 220 W Kimberly Ave, branch established on 1985/06/30. Info updated 2011/07/21: Bank assets: $239.7 mil, Deposits: $195.1 mil, headquarters in Kaukauna, WI, positive income , Mortgage Lending Specialization, 6 total offices
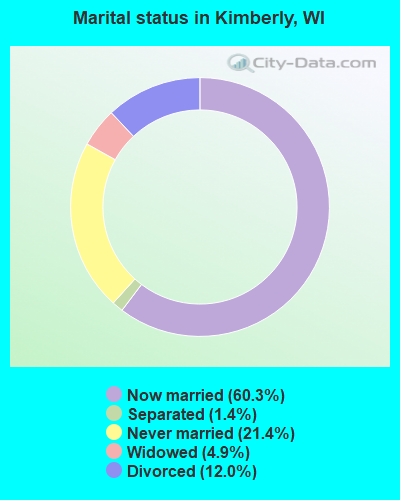
For population 15 years and over in Kimberly:
Never married: 21.4%Now married: 60.3%Separated: 1.4%Widowed: 4.9%Divorced: 12.0% For population 25 years and over in Kimberly:
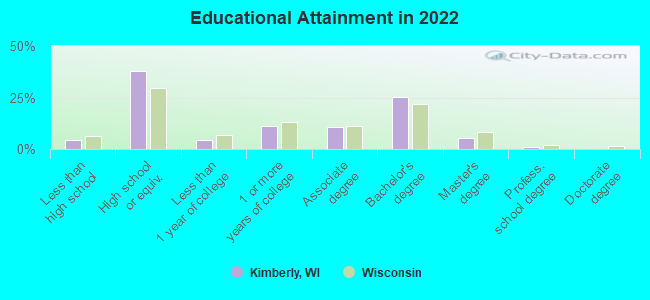
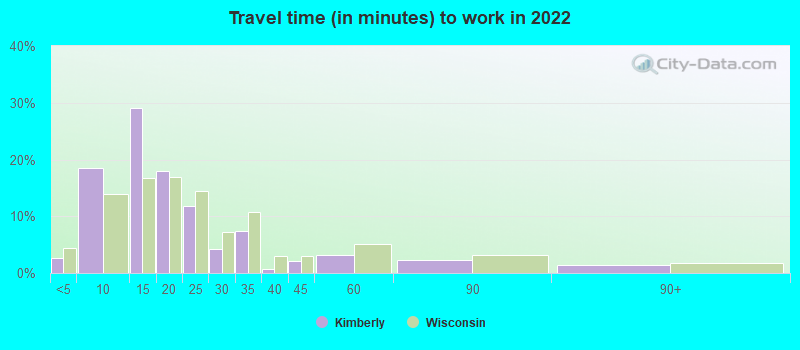
High school or higher: 94.6%Bachelor's degree or higher: 27.7%Graduate or professional degree: 5.8%Unemployed: 1.9%Mean travel time to work (commute): 17.8 minutes
Education Gini index (Inequality in education) Here:
8.7Wisconsin average:
10.4
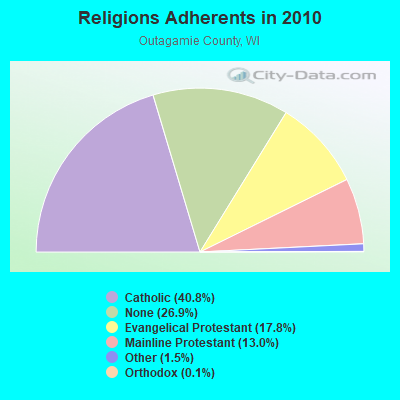
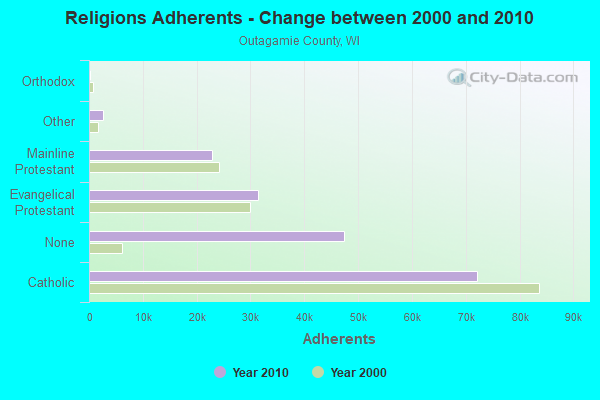
Religion statistics for Kimberly, WI (based on Outagamie County data)
Religion Adherents Congregations Catholic 72,014 23 Evangelical Protestant 31,447 72 Mainline Protestant 22,908 29 Other 2,635 13 Orthodox 224 2 None 47,467 -
Source: Clifford Grammich, Kirk Hadaway, Richard Houseal, Dale E.Jones, Alexei Krindatch, Richie Stanley and Richard H.Taylor. 2012. 2010 U.S.Religion Census: Religious Congregations & Membership Study. Association of Statisticians of American Religious Bodies. Jones, Dale E., et al. 2002. Congregations and Membership in the United States 2000. Nashville, TN: Glenmary Research Center. Graphs represent county-level data
Food Environment Statistics: Number of grocery stores : 29Outagamie County :
1.67 / 10,000 pop.Wisconsin :
1.86 / 10,000 pop.
Number of supercenters and club stores : 2Outagamie County :
0.12 / 10,000 pop.State :
0.11 / 10,000 pop.
Number of convenience stores (no gas) : 1This county :
0.06 / 10,000 pop.Wisconsin :
0.38 / 10,000 pop.
Number of convenience stores (with gas) : 71This county :
4.09 / 10,000 pop.Wisconsin :
4.12 / 10,000 pop.
Number of full-service restaurants : 149Outagamie County :
8.58 / 10,000 pop.Wisconsin :
8.64 / 10,000 pop.
Adult diabetes rate : Outagamie County :
7.5%Wisconsin :
7.6%
Adult obesity rate : This county :
27.1%Wisconsin :
27.5%
Low-income preschool obesity rate : This county :
14.1%State :
13.0%
Health and Nutrition: Healthy diet rate : This city:
52.1%Wisconsin:
49.5%
Average overall health of teeth and gums : This city:
50.7%Wisconsin:
46.6%
People feeling badly about themselves : Kimberly:
18.0%Wisconsin:
21.4%
People not drinking alcohol at all : Kimberly:
8.1%Wisconsin:
10.2%
Average hours sleeping at night : Kimberly:
6.8Wisconsin:
6.8
Overweight people : Here:
34.7%Wisconsin:
34.0%
General health condition : Kimberly:
58.9%Wisconsin:
56.3%
Average condition of hearing : Kimberly:
79.4%State:
78.5%
More about Health and Nutrition of Kimberly, WI Residents
Local government employment and payroll (March 2022)
Function
Full-time employees
Monthly full-time payroll
Average yearly full-time wage
Part-time employees
Monthly part-time payroll
Streets and Highways
6 $37,058 $74,116 1 $4,702 Other and Unallocable
4 $19,859 $59,577 0 $0 Financial Administration
4 $29,692 $89,076 2 $4,995 Parks and Recreation
3 $21,502 $86,008 1 $1,903 Sewerage
2 $14,875 $89,250 0 $0 Local Libraries
2 $14,207 $85,242 20 $45,891 Solid Waste Management
2 $12,272 $73,632 0 $0 Water Supply
2 $12,769 $76,614 6 $730 Other Government Administration
0 $0 18 $5,893 Judicial and Legal
0 $0 2 $4,160 Firefighters
0 $0 1 $1,049 Police - Other
0 $0 2 $3,192
Totals for Government
25 $162,234 $77,872 53 $72,515
Kimberly government finances - Expenditure in 2018 (per resident):
Construction - General - Other: $1,857,000 ($247.53)
Regular Highways: $1,297,000 ($172.89)Sewerage: $125,000 ($16.66)Parks and Recreation: $115,000 ($15.33)Housing and Community Development: $2,000 ($0.27)Current Operations - Regular Highways: $1,405,000 ($187.28)
Water Utilities: $1,255,000 ($167.29)Police Protection: $1,105,000 ($147.29)Sewerage: $1,082,000 ($144.23)Parks and Recreation: $280,000 ($37.32)Local Fire Protection: $239,000 ($31.86)Solid Waste Management: $166,000 ($22.13)Libraries: $164,000 ($21.86)General Public Buildings: $158,000 ($21.06)Central Staff Services: $154,000 ($20.53)General - Other: $137,000 ($18.26)Judicial and Legal Services: $93,000 ($12.40)Transit Utilities: $75,000 ($10.00)Financial Administration: $28,000 ($3.73)Health - Other: $6,000 ($0.80)Protective Inspection and Regulation - Other: $3,000 ($0.40)General - Interest on Debt: $296,000 ($39.46)
Other Capital Outlay - Central Staff Services: $156,000 ($20.79)
Regular Highways: $47,000 ($6.26)
Kimberly government finances - Revenue in 2018 (per resident):
Charges - Sewerage: $1,245,000 ($165.96)
Regular Highways: $1,007,000 ($134.23)Parks and Recreation: $104,000 ($13.86)Solid Waste Management: $30,000 ($4.00)Other: $7,000 ($0.93)Local Intergovernmental - Other: $59,000 ($7.86)
Miscellaneous - Sale of Property: $1,260,000 ($167.96)
General Revenue - Other: $851,000 ($113.44)Interest Earnings: $220,000 ($29.33)Special Assessments: $155,000 ($20.66)Fines and Forfeits: $92,000 ($12.26)Rents: $23,000 ($3.07)Donations From Private Sources: $6,000 ($0.80)Revenue - Water Utilities: $1,170,000 ($155.96)
State Intergovernmental - General Local Government Support: $558,000 ($74.38)
Highways: $380,000 ($50.65)Education: $129,000 ($17.20)Other: $21,000 ($2.80)Tax - Property: $3,570,000 ($475.87)
Occupation and Business License - Other: $93,000 ($12.40)Other Selective Sales: $56,000 ($7.46)Other License: $30,000 ($4.00)Other: $8,000 ($1.07)
Kimberly government finances - Debt in 2018 (per resident):
Long Term Debt - Outstanding Unspecified Public Purpose: $16,495,000 ($2198.75)
Issue, Unspecified Public Purpose: $13,000,000 ($1732.87)Beginning Outstanding - Unspecified Public Purpose: $3,751,000 ($500.00)Retired Unspecified Public Purpose: $256,000 ($34.12)
Kimberly government finances - Cash and Securities in 2018 (per resident):
Bond Funds - Cash and Securities: $9,145,000 ($1219.01)
Businesses in Kimberly, WI
Name Count Name Count
DHL 1 Subway 1 FedEx 1 Super 8 1 Hilton 1 U-Haul 1 Jones New York 1 UPS 1 Little Caesars Pizza 1 YMCA 1 McDonald's 1
Strongest AM radio stations in Kimberly:
WNAM (1280 AM; 50 kW; NEENAH-MENASHA, WI; Owner: CUMULUS LICENSING CORP.)
WJOK (1050 AM; 1 kW; KAUKAUNA, WI; Owner: STARBOARD BROADCASTING, INC.)
WHBY (1150 AM; 25 kW; KIMBERLY, WI; Owner: WOODWARD COMMUNICATIONS, INC.)
WSCO (1570 AM; 1 kW; APPLETON, WI; Owner: WOODWARD COMMUNICATIONS, INC.)
WTAQ (1360 AM; 10 kW; GREEN BAY, WI; Owner: MIDWEST COMMUNICATIONS, INC.)
WSPT (1010 AM; 50 kW; STEVENS POINT, WI)
WNFL (1440 AM; 5 kW; GREEN BAY, WI; Owner: MIDWEST COMMUNICATIONS, INC.)
WTMJ (620 AM; 50 kW; MILWAUKEE, WI; Owner: JOURNAL BROADCAST CORPORATION)
WSAU (550 AM; 20 kW; WAUSAU, WI; Owner: WRIG, INC.)
WDUX (800 AM; 5 kW; WAUPACA, WI; Owner: LAIRD BROADCASTING COMPANY, INC.)
WCUB (980 AM; 5 kW; TWO RIVERS, WI; Owner: CUB RADIO, INC.)
WISN (1130 AM; 50 kW; MILWAUKEE, WI; Owner: CAPSTAR TX LIMITED PARTNERSHIP)
WFCL (1380 AM; 4 kW; CLINTONVILLE, WI; Owner: RESULTS BROADCASTING CORP.)
Strongest FM radio stations in Kimberly:
WAPL-FM (105.7 FM; APPLETON, WI; Owner: WOODWARD COMMUNICATIONS, INC.)
WLFM (91.1 FM; APPLETON, WI; Owner: LAWRENCE UNIVERSITY OF WISCONSIN)
WNCY-FM (100.3 FM; NEENAH-MENASHA, WI; Owner: MIDWEST COMMUNICATIONS, INC.)
WPCK (104.9 FM; KAUKAUNA, WI; Owner: MIDWEST DIMENSIONS, INC.)
WEMI (91.9 FM; APPLETON, WI; Owner: EVANGEL MINISTRIES, INC.)
WOGB (103.1 FM; KAUKAUNA, WI; Owner: CUMULUS LICENSING CORP.)
WHID (88.1 FM; GREEN BAY, WI; Owner: BD OF REGENTS OF THE UNIV OF WI SYS)
WIXX (101.1 FM; GREEN BAY, WI; Owner: MIDWEST COMMUNICATIONS, INC.)
WPNE-FM (89.3 FM; GREEN BAY, WI; Owner: WISCONSIN EDUCATIONAL COMMUNICATIONS BOARD)
WXWX (107.5 FM; BRILLION, WI; Owner: CUMULUS LICENSING CORP.)
WKSZ (95.9 FM; DE PERE, WI; Owner: WOODWARD COMMUNICATIONS INC)
WROE (94.3 FM; NEENAH-MENASHA, WI; Owner: MIDWEST COMMUNICATIONS, INC.)
WORQ (90.1 FM; GREEN BAY, WI; Owner: LAKESHORE COMMUNICATIONS, INC.)
W271AC (102.1 FM; APPLETON, WI; Owner: FAMILY EDUC. BROADCASTING CORP.)
WECB (104.3 FM; SEYMOUR, WI; Owner: WOODWARD COMMUNICATIONS, INC.)
WEMY (91.5 FM; GREEN BAY, WI; Owner: EVANGEL MINISTRIES, INC)
WWWX (96.9 FM; OSHKOSH, WI; Owner: CUMULUS LICENSING CORP.)
WOZZ (93.5 FM; NEW LONDON, WI; Owner: MIDWEST COMMUNICATIONS, INC)
WVBO (103.9 FM; WINNECONNE, WI; Owner: CUMULUS LICENSING CORP.)
W270AJ (101.9 FM; GREEN BAY, WI; Owner: MIDWEST COMMUNICATIONS, INC)
TV broadcast stations around Kimberly:
WFRV-TV (Channel 5; GREEN BAY, WI; Owner: CBS BROADCASTING INC.)
WLUK-TV (Channel 11; GREEN BAY, WI; Owner: EMMIS TELEVISION LICENSE CORPORATION)
WBAY-TV (Channel 2; GREEN BAY, WI; Owner: YOUNG BROADCASTING OF GREEN BAY, INC.)
WPNE (Channel 38; GREEN BAY, WI; Owner: WISCONSIN EDUCATIONAL COMMUNICATIONS BOARD)
WGBA (Channel 26; GREEN BAY, WI; Owner: ARIES TELECOMMUNICATION CORPORATION)
WACY (Channel 32; APPLETON, WI; Owner: ACE TV, INC.)
WMMF-TV (Channel 68; FOND DU LAC, WI; Owner: PAPPAS TELECASTING OF WISCONSIN, A CALIFORNIA LTD PARTNRSHP)
WIWB (Channel 14; SURING, WI; Owner: ACME TV LICENSES OF WISCONSIN, LLC)
W49CB (Channel 49; GREEN BAY, WI; Owner: TRINITY BROADCASTING NETWORK)
W17CF (Channel 17; RIPON, WI; Owner: TRINITY BROADCASTING NETWORK)
W23BL (Channel 23; TRAVERSE CITY, MI; Owner: MS COMMUNICATIONS, LLC)
W30BU (Channel 30; GREEN BAY, WI; Owner: THREE ANGELS BROADCASTING NETWORK)
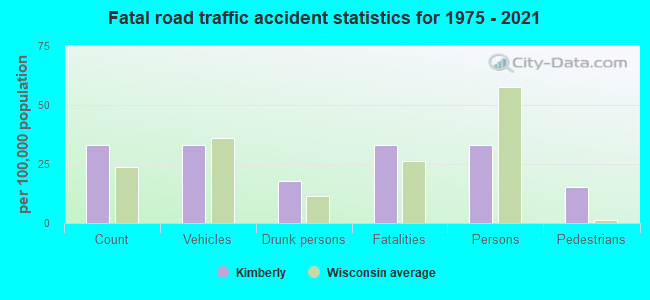
Kimberly fatal accident statistics for 1975 - 2021
Kimberly fatal accident list:
Jul 28, 2012 00:15 AM, Kimberly Ave, Lat: 44.270636, Lon: -88.345242, Vehicles: 1, Persons: 1, Pedestrians: 1, Fatalities: 1Vehicles: 1, Persons: 1, Fatalities: 1, Drunk persons involved: 1
FCC Registered Antenna Towers: 2
Michael J Kelley, Within Kimberly (Lat: 44.368056 Lon: -88.352222), Type: 68.3, Overall height: 68.3 m, Registrant: Wisconsin Electric Power Company, Mike.Kelley@wemail.Wisenergy.Com, , 2046 Milwa-ukee, Phone: (414) 221-2226 Within Kimberly (Lat: 44.368056 Lon: -88.352222), Type: 68.3, Overall height: 68.3 m, Registrant: Wisconsin Electric Power Company, Mike.Kelley@wemail.Wisenergy.Com, , 2046 Milwa-ukee, Phone: (414) 221-2226 FCC Registered Broadcast Land Mobile Towers: 3
Lat: 44.272889 Lon: -88.328917, Call Sign: WQDL251, Assigned Frequencies: 72.3200 MHz, Grant Date: 09/11/2015, Expiration Date: 09/22/2025, Certifier: Jim Zwiers, Registrant: Primex Wireless, Inc, 965 Wells Street, Lake Geneva, WI 53147, Phone: (800) 537-0464YMCA KIMBERLY, 225 W Kennedy Avenue (Lat: 44.258833 Lon: -88.335222), Call Sign: WQZD563, Assigned Frequencies: 452.162 MHz, 457.162 MHz, 457.037 MHz, Grant Date: 04/13/2017, Expiration Date: 04/13/2027, Certifier: Randy Hofstetter, Registrant: Baycom Inc., 2040 Radisson Street, Green Bay, WI 54302, Phone: (920) 544-4248, Fax: (920) 468-8615, Email:
Lat: 44.263056 Lon: -88.349444, Call Sign: WRXT944, Assigned Frequencies: 451.437 MHz, 451.462 MHz, 452.487 MHz, 456.462 MHz, 457.487 MHz, 462.487 MHz, 467.487 MHz, Grant Date: 06/27/2023, Expiration Date: 06/27/2033, Certifier: Brendan Mclean, Registrant: Acs, 647 Blackhawk Drive, Westmont, IL 60559, Phone: (630) 716-7915, Email:
FCC Registered Amateur Radio Licenses: 23 (
See the full list of FCC Registered Amateur Radio Licenses in Kimberly )
FAA Registered Aircraft: 2
Aircraft: BUCKEYE DREAM MACHINE (Category: Land, Seats: 2, Weight: Up to 12,499 Pounds), Engine: ROTAX 582DCDI (65 HP) (2 Cycle)N-Number: 3130A, N3130A, N-3130A, Serial Number: 6151, Year manufactured: 2001, Airworthiness Date: 06/09/2007, Certificate Issue Date: 10/21/2010Registrant (Individual): Terry J Kaminski, 616 Windmill Dr, Kimberly, WI 54136Aircraft: BUCKEYE DREAM MACHINE (Category: Land, Seats: 2, Weight: Up to 12,499 Pounds), Engine: ROTAX 503 DCDI (52 HP) (2 Cycle)N-Number: 3174L, N3174L, N-3174L, Serial Number: 3749, Year manufactured: 1997, Airworthiness Date: 08/18/2007, Certificate Issue Date: 02/12/2007Registrant (Individual): Terry J Kaminski, 616 Windmill Dr, Kimberly, WI 54136
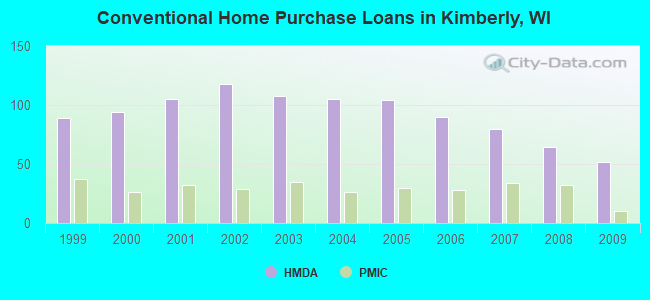
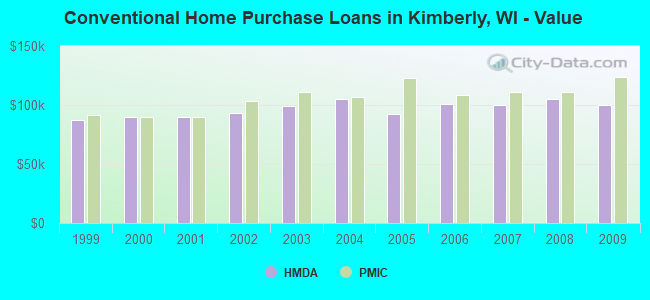
Home Mortgage Disclosure Act Aggregated Statistics For Year 2009(Based on 1 full and 1 partial tracts) A) FHA, FSA/RHS & VA B) Conventional C) Refinancings D) Home Improvement Loans F) Non-occupant Loans on Number Average Value Number Average Value Number Average Value Number Average Value Number Average Value
LOANS ORIGINATED 29 $111,908 52 $99,866 230 $107,744 18 $41,636 8 $129,014 APPLICATIONS APPROVED, NOT ACCEPTED 2 $142,565 1 $129,160 20 $133,308 3 $22,450 0 $0 APPLICATIONS DENIED 2 $108,530 2 $131,255 31 $125,837 1 $58,580 2 $174,320 APPLICATIONS WITHDRAWN 4 $87,250 3 $101,377 34 $110,131 1 $30,060 1 $65,000 FILES CLOSED FOR INCOMPLETENESS 0 $0 1 $161,670 5 $159,584 0 $0 0 $0
Aggregated Statistics For Year 2008(Based on 1 full and 1 partial tracts) A) FHA, FSA/RHS & VA B) Conventional C) Refinancings D) Home Improvement Loans E) Loans on Dwellings For 5+ Families F) Non-occupant Loans on Number Average Value Number Average Value Number Average Value Number Average Value Number Average Value Number Average Value
LOANS ORIGINATED 25 $108,264 64 $105,173 143 $112,190 30 $37,664 0 $0 25 $116,144 APPLICATIONS APPROVED, NOT ACCEPTED 0 $0 1 $224,900 9 $110,184 3 $28,237 0 $0 1 $128,710 APPLICATIONS DENIED 3 $76,073 0 $0 46 $114,665 7 $104,074 1 $80,000 1 $84,000 APPLICATIONS WITHDRAWN 0 $0 8 $99,966 25 $111,768 3 $50,667 0 $0 0 $0 FILES CLOSED FOR INCOMPLETENESS 0 $0 0 $0 5 $105,786 0 $0 0 $0 0 $0
Aggregated Statistics For Year 2007(Based on 1 full and 1 partial tracts) A) FHA, FSA/RHS & VA B) Conventional C) Refinancings D) Home Improvement Loans E) Loans on Dwellings For 5+ Families F) Non-occupant Loans on Number Average Value Number Average Value Number Average Value Number Average Value Number Average Value Number Average Value
LOANS ORIGINATED 12 $109,858 80 $100,232 130 $107,493 38 $41,967 1 $201,000 18 $133,306 APPLICATIONS APPROVED, NOT ACCEPTED 1 $104,000 5 $105,630 17 $93,264 3 $63,720 0 $0 0 $0 APPLICATIONS DENIED 0 $0 10 $87,886 71 $103,442 11 $39,527 0 $0 2 $79,595 APPLICATIONS WITHDRAWN 0 $0 8 $88,479 26 $110,533 7 $42,106 0 $0 1 $24,000 FILES CLOSED FOR INCOMPLETENESS 0 $0 1 $176,290 9 $115,912 0 $0 0 $0 0 $0
Aggregated Statistics For Year 2006(Based on 1 full and 1 partial tracts) A) FHA, FSA/RHS & VA B) Conventional C) Refinancings D) Home Improvement Loans F) Non-occupant Loans on G) Loans On Manufactured Number Average Value Number Average Value Number Average Value Number Average Value Number Average Value Number Average Value
LOANS ORIGINATED 9 $120,453 90 $100,496 148 $87,817 35 $26,039 9 $114,094 1 $33,000 APPLICATIONS APPROVED, NOT ACCEPTED 0 $0 12 $95,146 27 $89,091 2 $9,550 2 $139,075 0 $0 APPLICATIONS DENIED 1 $105,000 17 $110,724 66 $114,957 10 $45,861 6 $137,132 1 $85,000 APPLICATIONS WITHDRAWN 0 $0 7 $85,154 39 $101,212 6 $60,413 2 $119,220 0 $0 FILES CLOSED FOR INCOMPLETENESS 0 $0 4 $108,215 11 $122,162 0 $0 0 $0 0 $0
Aggregated Statistics For Year 2005(Based on 1 full and 1 partial tracts) A) FHA, FSA/RHS & VA B) Conventional C) Refinancings D) Home Improvement Loans F) Non-occupant Loans on Number Average Value Number Average Value Number Average Value Number Average Value Number Average Value
LOANS ORIGINATED 18 $110,877 104 $92,012 219 $87,820 47 $26,787 15 $105,321 APPLICATIONS APPROVED, NOT ACCEPTED 0 $0 8 $95,736 19 $78,002 1 $24,580 0 $0 APPLICATIONS DENIED 0 $0 20 $87,320 75 $107,620 14 $15,442 9 $106,622 APPLICATIONS WITHDRAWN 0 $0 12 $93,697 42 $104,415 4 $52,225 2 $81,740 FILES CLOSED FOR INCOMPLETENESS 0 $0 2 $140,675 36 $106,766 0 $0 1 $21,000
Aggregated Statistics For Year 2004(Based on 1 full and 1 partial tracts) A) FHA, FSA/RHS & VA B) Conventional C) Refinancings D) Home Improvement Loans F) Non-occupant Loans on Number Average Value Number Average Value Number Average Value Number Average Value Number Average Value
LOANS ORIGINATED 12 $106,448 105 $104,885 193 $101,779 52 $27,725 18 $138,659 APPLICATIONS APPROVED, NOT ACCEPTED 0 $0 5 $109,998 7 $121,854 1 $12,770 0 $0 APPLICATIONS DENIED 0 $0 9 $95,031 64 $90,765 11 $22,592 2 $108,015 APPLICATIONS WITHDRAWN 2 $98,000 8 $106,059 29 $91,917 1 $21,000 1 $46,000 FILES CLOSED FOR INCOMPLETENESS 0 $0 2 $37,015 24 $113,251 0 $0 0 $0
Aggregated Statistics For Year 2003(Based on 1 full and 1 partial tracts) A) FHA, FSA/RHS & VA B) Conventional C) Refinancings D) Home Improvement Loans F) Non-occupant Loans on Number Average Value Number Average Value Number Average Value Number Average Value Number Average Value
LOANS ORIGINATED 31 $102,234 108 $99,506 444 $94,833 17 $24,479 28 $115,640 APPLICATIONS APPROVED, NOT ACCEPTED 0 $0 2 $113,805 23 $104,603 0 $0 0 $0 APPLICATIONS DENIED 1 $76,000 8 $82,245 66 $91,682 5 $25,354 6 $101,800 APPLICATIONS WITHDRAWN 2 $140,160 13 $106,155 43 $98,407 1 $14,900 2 $142,775 FILES CLOSED FOR INCOMPLETENESS 0 $0 0 $0 10 $100,515 1 $14,000 0 $0
Aggregated Statistics For Year 2002(Based on 1 full and 1 partial tracts) A) FHA, FSA/RHS & VA B) Conventional C) Refinancings D) Home Improvement Loans E) Loans on Dwellings For 5+ Families F) Non-occupant Loans on Number Average Value Number Average Value Number Average Value Number Average Value Number Average Value Number Average Value
LOANS ORIGINATED 26 $99,787 118 $93,031 329 $88,435 31 $22,242 1 $206,000 20 $108,950 APPLICATIONS APPROVED, NOT ACCEPTED 1 $85,000 6 $96,567 20 $98,603 0 $0 1 $206,000 4 $99,048 APPLICATIONS DENIED 0 $0 7 $81,783 35 $89,921 6 $9,908 0 $0 2 $144,545 APPLICATIONS WITHDRAWN 0 $0 9 $91,242 24 $117,214 4 $19,808 0 $0 2 $108,770 FILES CLOSED FOR INCOMPLETENESS 0 $0 1 $217,670 4 $102,468 0 $0 0 $0 0 $0
Aggregated Statistics For Year 2001(Based on 1 full and 1 partial tracts) A) FHA, FSA/RHS & VA B) Conventional C) Refinancings D) Home Improvement Loans F) Non-occupant Loans on Number Average Value Number Average Value Number Average Value Number Average Value Number Average Value
LOANS ORIGINATED 18 $84,351 105 $89,584 273 $76,943 40 $20,450 17 $107,360 APPLICATIONS APPROVED, NOT ACCEPTED 1 $94,380 3 $79,353 15 $79,863 4 $7,935 1 $193,280 APPLICATIONS DENIED 3 $61,000 7 $58,369 34 $83,371 6 $9,753 0 $0 APPLICATIONS WITHDRAWN 2 $100,870 7 $92,353 33 $77,155 1 $18,060 2 $100,870 FILES CLOSED FOR INCOMPLETENESS 0 $0 0 $0 4 $78,370 0 $0 0 $0
Aggregated Statistics For Year 2000(Based on 1 full and 1 partial tracts) A) FHA, FSA/RHS & VA B) Conventional C) Refinancings D) Home Improvement Loans F) Non-occupant Loans on Number Average Value Number Average Value Number Average Value Number Average Value Number Average Value
LOANS ORIGINATED 15 $87,765 94 $89,412 86 $50,587 45 $18,168 15 $84,850 APPLICATIONS APPROVED, NOT ACCEPTED 0 $0 1 $17,160 2 $43,370 2 $19,760 0 $0 APPLICATIONS DENIED 0 $0 6 $64,822 28 $52,212 7 $19,116 0 $0 APPLICATIONS WITHDRAWN 0 $0 9 $93,817 9 $42,082 4 $22,572 0 $0 FILES CLOSED FOR INCOMPLETENESS 0 $0 2 $117,290 1 $73,000 0 $0 0 $0
Aggregated Statistics For Year 1999(Based on 1 full and 1 partial tracts) A) FHA, FSA/RHS & VA B) Conventional C) Refinancings D) Home Improvement Loans F) Non-occupant Loans on Number Average Value Number Average Value Number Average Value Number Average Value Number Average Value
LOANS ORIGINATED 13 $80,494 89 $87,138 154 $61,397 38 $17,649 14 $55,134 APPLICATIONS APPROVED, NOT ACCEPTED 0 $0 6 $50,085 8 $73,891 2 $22,715 0 $0 APPLICATIONS DENIED 0 $0 7 $48,461 23 $60,983 9 $33,746 1 $5,930 APPLICATIONS WITHDRAWN 1 $88,960 7 $80,234 10 $69,165 2 $58,405 0 $0 FILES CLOSED FOR INCOMPLETENESS 0 $0 1 $89,360 4 $75,265 0 $0 0 $0
Detailed HMDA statistics for the following Tracts:
0116.00
, 0117.00
Private Mortgage Insurance Companies Aggregated Statistics For Year 2009(Based on 1 full and 1 partial tracts) A) Conventional B) Refinancings Number Average Value Number Average Value
LOANS ORIGINATED 10 $123,346 17 $129,641 APPLICATIONS APPROVED, NOT ACCEPTED 2 $100,000 2 $145,950 APPLICATIONS DENIED 1 $158,190 0 $0 APPLICATIONS WITHDRAWN 0 $0 2 $117,900 FILES CLOSED FOR INCOMPLETENESS 0 $0 0 $0
Aggregated Statistics For Year 2008(Based on 1 full and 1 partial tracts) A) Conventional B) Refinancings C) Non-occupant Loans on Number Average Value Number Average Value Number Average Value
LOANS ORIGINATED 32 $111,379 13 $126,060 1 $210,640 APPLICATIONS APPROVED, NOT ACCEPTED 1 $116,060 2 $186,510 0 $0 APPLICATIONS DENIED 1 $127,420 0 $0 0 $0 APPLICATIONS WITHDRAWN 0 $0 0 $0 0 $0 FILES CLOSED FOR INCOMPLETENESS 0 $0 0 $0 0 $0
Aggregated Statistics For Year 2007(Based on 1 full and 1 partial tracts) A) Conventional B) Refinancings C) Non-occupant Loans on Number Average Value Number Average Value Number Average Value
LOANS ORIGINATED 34 $111,363 14 $138,245 2 $138,885 APPLICATIONS APPROVED, NOT ACCEPTED 4 $99,570 1 $170,770 0 $0 APPLICATIONS DENIED 0 $0 0 $0 0 $0 APPLICATIONS WITHDRAWN 1 $94,000 2 $122,000 0 $0 FILES CLOSED FOR INCOMPLETENESS 0 $0 0 $0 0 $0
Aggregated Statistics For Year 2006(Based on 1 full and 1 partial tracts) A) Conventional B) Refinancings C) Non-occupant Loans on Number Average Value Number Average Value Number Average Value
LOANS ORIGINATED 28 $108,390 12 $116,754 1 $83,000 APPLICATIONS APPROVED, NOT ACCEPTED 2 $119,560 3 $113,333 1 $95,000 APPLICATIONS DENIED 0 $0 0 $0 0 $0 APPLICATIONS WITHDRAWN 2 $101,000 1 $120,000 0 $0 FILES CLOSED FOR INCOMPLETENESS 0 $0 0 $0 0 $0
Aggregated Statistics For Year 2005(Based on 1 full and 1 partial tracts) A) Conventional B) Refinancings C) Non-occupant Loans on Number Average Value Number Average Value Number Average Value
LOANS ORIGINATED 30 $122,759 21 $114,678 1 $104,000 APPLICATIONS APPROVED, NOT ACCEPTED 3 $141,200 4 $116,885 0 $0 APPLICATIONS DENIED 0 $0 0 $0 0 $0 APPLICATIONS WITHDRAWN 0 $0 0 $0 0 $0 FILES CLOSED FOR INCOMPLETENESS 0 $0 0 $0 0 $0
Aggregated Statistics For Year 2004(Based on 1 full and 1 partial tracts) A) Conventional B) Refinancings C) Non-occupant Loans on Number Average Value Number Average Value Number Average Value
LOANS ORIGINATED 26 $106,489 20 $102,818 2 $86,000 APPLICATIONS APPROVED, NOT ACCEPTED 5 $100,728 3 $122,493 0 $0 APPLICATIONS DENIED 0 $0 0 $0 0 $0 APPLICATIONS WITHDRAWN 1 $81,290 1 $188,320 0 $0 FILES CLOSED FOR INCOMPLETENESS 0 $0 1 $140,000 0 $0
Aggregated Statistics For Year 2003(Based on 1 full and 1 partial tracts) A) Conventional B) Refinancings Number Average Value Number Average Value
LOANS ORIGINATED 35 $110,601 43 $118,315 APPLICATIONS APPROVED, NOT ACCEPTED 2 $71,000 7 $101,607 APPLICATIONS DENIED 0 $0 2 $82,805 APPLICATIONS WITHDRAWN 0 $0 1 $177,930 FILES CLOSED FOR INCOMPLETENESS 0 $0 0 $0
Aggregated Statistics For Year 2002(Based on 1 full and 1 partial tracts) A) Conventional B) Refinancings C) Non-occupant Loans on Number Average Value Number Average Value Number Average Value
LOANS ORIGINATED 29 $103,527 37 $108,566 2 $119,595 APPLICATIONS APPROVED, NOT ACCEPTED 3 $107,480 6 $154,750 0 $0 APPLICATIONS DENIED 0 $0 0 $0 0 $0 APPLICATIONS WITHDRAWN 1 $85,550 2 $181,835 2 $130,000 FILES CLOSED FOR INCOMPLETENESS 0 $0 1 $82,000 0 $0
Aggregated Statistics For Year 2001(Based on 1 full and 1 partial tracts) A) Conventional B) Refinancings C) Non-occupant Loans on Number Average Value Number Average Value Number Average Value
LOANS ORIGINATED 32 $89,977 24 $97,930 0 $0 APPLICATIONS APPROVED, NOT ACCEPTED 3 $78,503 7 $121,446 1 $47,000 APPLICATIONS DENIED 1 $92,000 0 $0 0 $0 APPLICATIONS WITHDRAWN 0 $0 2 $103,000 0 $0 FILES CLOSED FOR INCOMPLETENESS 5 $47,000 0 $0 5 $47,000
Aggregated Statistics For Year 2000(Based on 1 full and 1 partial tracts) A) Conventional B) Refinancings C) Non-occupant Loans on Number Average Value Number Average Value Number Average Value
LOANS ORIGINATED 26 $89,543 10 $98,458 0 $0 APPLICATIONS APPROVED, NOT ACCEPTED 3 $71,430 1 $160,320 1 $47,000 APPLICATIONS DENIED 0 $0 0 $0 0 $0 APPLICATIONS WITHDRAWN 3 $77,280 0 $0 1 $47,000 FILES CLOSED FOR INCOMPLETENESS 0 $0 0 $0 0 $0
Aggregated Statistics For Year 1999(Based on 1 full and 1 partial tracts) A) Conventional B) Refinancings Number Average Value Number Average Value
LOANS ORIGINATED 37 $91,669 11 $93,309 APPLICATIONS APPROVED, NOT ACCEPTED 0 $0 2 $106,060 APPLICATIONS DENIED 0 $0 0 $0 APPLICATIONS WITHDRAWN 0 $0 0 $0 FILES CLOSED FOR INCOMPLETENESS 0 $0 0 $0
Detailed PMIC statistics for the following Tracts:
0116.00
, 0117.00 Fire-safe hotels and motels in Kimberly, Wisconsin:
Amerihost Inn, 761 Truman St, Kimberly, Wisconsin 54136 Phone: (920) 788-4400, Fax: (920) 788-4466
Hilton Garden Inn, 720 Eisenhower Dr, Kimberly, Wisconsin 54136 Phone: (920) 730-1900, Fax: (920) 734-7565
All 2 fire-safe hotels and motels in Kimberly, Wisconsin
Most common first names in Kimberly, WI among deceased individuals Name Count Lived (average)
John 54 78.3 years Mary 31 79.1 years Joseph 29 79.4 years Elizabeth 27 79.8 years Robert 24 69.3 years Marie 24 80.7 years Martin 22 78.4 years George 21 80.4 years Henry 20 81.5 years William 20 75.1 years
Most common last names in Kimberly, WI among deceased individuals Last name Count Lived (average)
Jansen 17 73.1 years Weyenberg 16 74.2 years Debruin 13 77.7 years Krueger 11 73.5 years Vannuland 9 71.5 years Vandenheuvel 9 77.1 years Vandehey 9 79.9 years Wildenberg 8 80.6 years Frassetto 8 73.9 years Vandervelden 8 73.0 years
Kimberly compared to Wisconsin state average:
Unemployed percentage significantly below state average. Black race population percentage significantly below state average. Hispanic race population percentage below state average. Median age below state average. Length of stay since moving in above state average.
#42 on the list of "Top 101 cities with the most people taking a bicycle to work (population 5,000+)"
#98 on the list of "Top 101 cities with largest percentage of females in industries: finance and insurance (population 5,000+)"
#62 (54136) on the list of "Top 101 zip codes with the largest percentage of Dutch first ancestries (pop 5,000+)"
#16 on the list of "Top 101 counties with the lowest percentage of residents relocating from foreign countries between 2010 and 2011"
Top Patent Applicants
Bryan Dustin Marschke (5)
Leila Joy Roberson (5)
George Harold Baus (4)
Cheri Lee Schultz (3)
Timothy P. Hartjes (2)
Scott J. Kelly (2)
Jason M. Rudolph (1)
Lloyd Carl Hietpas (1)
James George Van Himbergen (1)
Tim G. Dollevoet (1)
Total of 34 patent applications in 2008-2024.
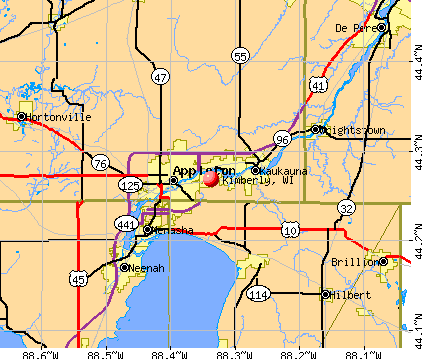


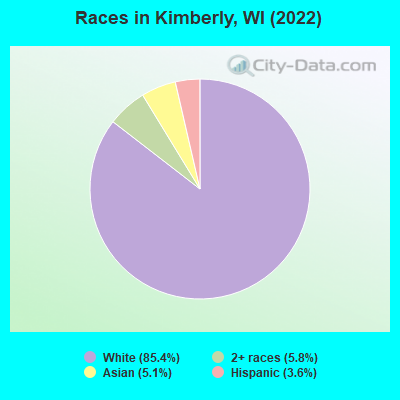
 Recent articles from our blog. Our writers, many of them Ph.D. graduates or candidates, create easy-to-read articles on a wide variety of topics.

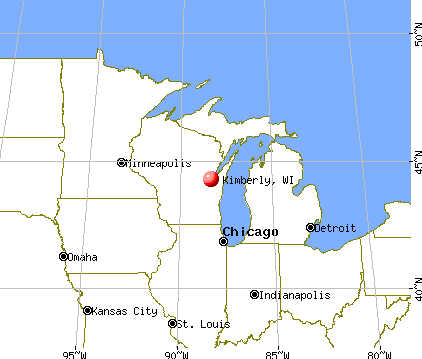
 (3.2 miles