Corcoran, Minnesota

Submit your own pictures of this city and show them to the world
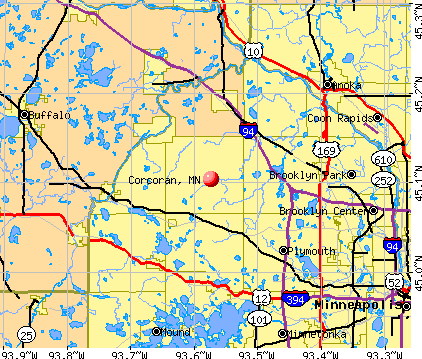
- OSM Map
- General Map
- Google Map
- MSN Map
Population change since 2000: +31.2%
 |
| Males: 3,909 | |
| Females: 3,475 |
| Median resident age: | 44.0 years |
| Minnesota median age: | 39.0 years |
Zip codes: 55311, 55340, 55357, 55374.
Corcoran Zip Code Map| Corcoran: | $150,022 |
| MN: | $82,338 |
Estimated per capita income in 2022: $67,735 (it was $29,467 in 2000)
Corcoran city income, earnings, and wages data
Estimated median house or condo value in 2022: $508,348 (it was $186,700 in 2000)
| Corcoran: | $508,348 |
| MN: | $314,600 |
Mean prices in 2022: all housing units: $511,808; detached houses: $566,012; mobile homes: $24,691
Median gross rent in 2022: $2,222.
Detailed information about poverty and poor residents in Corcoran, MN


Compare current foreclosures near Corcoran, MN:
| Photo | Address | Area | Beds / Baths | Price | Details |
|---|---|---|---|---|---|

|
#1
Quebec Ave N
Minneapolis, MN 55428
|
1,226 sq. feet
|
1 baths 2 beds |
$299,900
|
show details |

|
#2
43rd Ave NE
Minneapolis, MN 55421
|
1,202 sq. feet
|
2 baths 3 beds |
$384,900
|
show details |

|
#3
Fairview Ln
Mound, MN 55364
|
2,112 sq. feet
|
2 baths 3 beds |
$374,900
|
show details |

|
#4
Bedford Ave
Minneapolis, MN 55436
|
1,726 sq. feet
|
1 baths 3 beds |
$289,900
|
show details |

|
#5
147th Ter NW
Anoka, MN 55303
|
996 sq. feet
|
2 baths 2 beds |
show details | |

|
#6
Bethia Ln
Minneapolis, MN 55428
|
1,613 sq. feet
|
2 baths 4 beds |
show details | |

|
#7
Whitewater Trl
Minneapolis, MN 55444
|
992 sq. feet
|
1 baths 3 beds |
show details | |

|
#8
Marsh Ave
Maple Plain, MN 55359
|
1,050 sq. feet
|
1 baths 3 beds |
show details | |

|
#9
Kahler Ct NE
Albertville, MN 55301
|
2,203 sq. feet
|
2 baths 4 beds |
show details | |

|
#10
Logan Ave N
Minneapolis, MN 55412
|
1,212 sq. feet
|
1 baths 3 beds |
show details |
| Photo | Address | Area | Beds / Baths | Price | Details |
|---|---|---|---|---|---|

|
#11
64th Ave NE
Minneapolis, MN 55432
|
1,028 sq. feet
|
1 baths 3 beds |
show details | |

|
#12
Green Circle Dr Apt 317
Hopkins, MN 55343
|
1,055 sq. feet
|
2 baths 2 beds |
show details | |

|
#13
Norway St NW
Minneapolis, MN 55433
|
1,601 sq. feet
|
3 baths 2 beds |
show details | |

|
#14
Penn Ave N
Minneapolis, MN 55444
|
1,070 sq. feet
|
2 baths 3 beds |
show details | |

|
#15
Main St W
Maple Plain, MN 55359
|
934 sq. feet
|
1 baths 2 beds |
show details | |

|
#16
60th Ave N
Minneapolis, MN 55428
|
782 sq. feet
|
1 baths 2 beds |
show details | |

|
#17
Parkview Circle
Anoka, MN 55303
|
2,864 sq. feet
|
5 baths 5 beds |
show details | |

|
#18
Chasewood Pkwy Apt 104
Hopkins, MN 55343
|
1,096 sq. feet
|
2 baths 2 beds |
show details | |

|
#19
94th Ave NE
Minneapolis, MN 55434
|
1,044 sq. feet
|
2 baths 2 beds |
show details | |

|
#20
45th Ave N
Minneapolis, MN 55442
|
1,326 sq. feet
|
2 baths 3 beds |
show details |
| Photo | Address | Area | Beds / Baths | Price | Details |
|---|---|---|---|---|---|

|
#21
112th Ln NW
Minneapolis, MN 55448
|
960 sq. feet
|
2 baths 3 beds |
show details | |

|
#22
Washington St NE
Minneapolis, MN 55421
|
958 sq. feet
|
1 baths 3 beds |
show details | |

|
#23
65th Ave N
Minneapolis, MN 55430
|
1,056 sq. feet
|
1 baths 3 beds |
show details | |

|
#24
Washburn Ave N
Minneapolis, MN 55430
|
960 sq. feet
|
1 baths 2 beds |
show details | |

|
#25
83rd Ave NE
Minneapolis, MN 55432
|
796 sq. feet
|
2 baths 2 beds |
show details | |

|
#26
57th Pl N
Minneapolis, MN 55442
|
1,616 sq. feet
|
2 baths 2 beds |
show details | |

|
#27
158th Ln NW
Anoka, MN 55303
|
1,225 sq. feet
|
2 baths 3 beds |
show details | |

|
#28
Wilson St
Anoka, MN 55303
|
1,170 sq. feet
|
2 baths 5 beds |
show details | |

|
#29
Ladyslipper Ave N
Minneapolis, MN 55443
|
1,366 sq. feet
|
1 baths 3 beds |
show details | |

|
#30
111th Ave NE
Minneapolis, MN 55434
|
936 sq. feet
|
2 baths 2 beds |
show details |
| Photo | Address | Area | Beds / Baths | Price | Details |
|---|---|---|---|---|---|

|
#31
Park Dr
Monticello, MN 55362
|
1,098 sq. feet
|
1 baths 2 beds |
show details | |

|
#32
119th Ln NW
Minneapolis, MN 55448
|
794 sq. feet
|
1 baths 2 beds |
show details | |

|
#33
Wren St NW
Minneapolis, MN 55433
|
1,284 sq. feet
|
1 baths 4 beds |
show details | |

|
#34
Loch Lomond Blvd
Minneapolis, MN 55443
|
2,045 sq. feet
|
4 baths 4 beds |
show details | |

|
#35
Girard Ave N
Minneapolis, MN 55411
|
768 sq. feet
|
1 baths 2 beds |
show details | |

|
#36
Aldrich Ave N
Minneapolis, MN 55412
|
1,338 sq. feet
|
1 baths 3 beds |
show details | |

|
#37
Ives Ln N
Osseo, MN 55369
|
1,084 sq. feet
|
1 baths 3 beds |
show details | |

|
#38
119th Ln NW
Minneapolis, MN 55448
|
794 sq. feet
|
1 baths 2 beds |
show details | |

|
#39
Colfax Ave N
Minneapolis, MN 55412
|
1,334 sq. feet
|
2 baths 3 beds |
show details | |

|
#40
158th Ln NW
Anoka, MN 55303
|
1,008 sq. feet
|
2 baths 3 beds |
show details |
| Photo | Address | Area | Beds / Baths | Price | Details |
|---|---|---|---|---|---|

|
#41
119th Ln NW
Minneapolis, MN 55448
|
794 sq. feet
|
2 baths 3 beds |
show details | |

|
#42
81st Ave N
Minneapolis, MN 55443
|
1,533 sq. feet
|
3 baths 3 beds |
show details | |

|
#43
Fremont Ave N Apt 311
Minneapolis, MN 55412
|
1,066 sq. feet
|
1 baths 1 beds |
show details | |

|
#44
Widgeon Ln
Rogers, MN 55374
|
1,723 sq. feet
|
2 baths 3 beds |
show details | |

|
#45
Fremont Ave N
Minneapolis, MN 55412
|
942 sq. feet
|
1 baths 3 beds |
show details | |

|
#46
Fremont Ave N
Minneapolis, MN 55412
|
1,092 sq. feet
|
1 baths 3 beds |
show details | |

|
#47
Russell Ave N
Minneapolis, MN 55412
|
593 sq. feet
|
1 baths 4 beds |
show details | |

|
#48
Cloverdale Ave
Minneapolis, MN 55428
|
1,048 sq. feet
|
1 baths 4 beds |
show details | |

|
#49
Loch Lomond Ln
Minneapolis, MN 55443
|
1,855 sq. feet
|
1 baths 2 beds |
show details | |

|
Check over 1 million property listings on Foreclosure.com!
|
browse all offers | |||


- 5,35882.5%White alone
- 72111.1%Asian alone
- 1622.5%Two or more races
- 761.2%Black alone
- 701.1%Hispanic
- 230.4%American Indian alone

Races in Corcoran detailed stats: ancestries, foreign born residents, place of birth
Type |
2009 |
2010 |
2011 |
2012 |
2014 |
2015 |
2016 |
2017 |
2018 |
2019 |
2020 |
2021 |
2022 |
|---|---|---|---|---|---|---|---|---|---|---|---|---|---|
| Murders (per 100,000) | 0 (0.0) | 0 (0.0) | 0 (0.0) | 0 (0.0) | 0 (0.0) | 0 (0.0) | 0 (0.0) | 0 (0.0) | 0 (0.0) | 0 (0.0) | 0 (0.0) | 0 (0.0) | 0 (0.0) |
| Rapes (per 100,000) | 0 (0.0) | 0 (0.0) | 0 (0.0) | 0 (0.0) | 0 (0.0) | 0 (0.0) | 0 (0.0) | 0 (0.0) | 2 (33.4) | 0 (0.0) | 0 (0.0) | 0 (0.0) | 0 (0.0) |
| Robberies (per 100,000) | 0 (0.0) | 0 (0.0) | 0 (0.0) | 0 (0.0) | 0 (0.0) | 0 (0.0) | 0 (0.0) | 0 (0.0) | 0 (0.0) | 0 (0.0) | 0 (0.0) | 0 (0.0) | 0 (0.0) |
| Assaults (per 100,000) | 6 (106.6) | 4 (74.4) | 3 (55.3) | 6 (109.3) | 2 (36.1) | 0 (0.0) | 1 (17.9) | 4 (69.7) | 2 (33.4) | 0 (0.0) | 0 (0.0) | 1 (14.8) | 2 (27.4) |
| Burglaries (per 100,000) | 20 (355.3) | 6 (111.5) | 4 (73.8) | 5 (91.1) | 8 (144.3) | 5 (89.9) | 2 (35.8) | 5 (87.2) | 11 (183.7) | 8 (129.1) | 7 (110.2) | 2 (29.7) | 5 (68.5) |
| Thefts (per 100,000) | 43 (763.9) | 32 (594.9) | 39 (719.4) | 38 (692.0) | 50 (901.7) | 29 (521.4) | 25 (447.5) | 32 (558.0) | 36 (601.2) | 29 (468.1) | 13 (204.7) | 35 (519.1) | 19 (260.5) |
| Auto thefts (per 100,000) | 3 (53.3) | 0 (0.0) | 3 (55.3) | 4 (72.8) | 5 (90.2) | 2 (36.0) | 1 (17.9) | 1 (17.4) | 5 (83.5) | 4 (64.6) | 5 (78.7) | 1 (14.8) | 1 (13.7) |
| Arson (per 100,000) | 0 (0.0) | 0 (0.0) | 0 (0.0) | 0 (0.0) | 0 (0.0) | 0 (0.0) | 0 (0.0) | 0 (0.0) | 0 (0.0) | 0 (0.0) | 0 (0.0) | 0 (0.0) | 0 (0.0) |
| City-Data.com crime index | 81.0 | 46.5 | 49.4 | 61.7 | 60.6 | 30.0 | 25.4 | 43.8 | 77.0 | 32.9 | 22.2 | 27.0 | 21.8 |
The City-Data.com crime index weighs serious crimes and violent crimes more heavily. Higher means more crime, U.S. average is 246.1. It adjusts for the number of visitors and daily workers commuting into cities.

Crime rate in Corcoran detailed stats: murders, rapes, robberies, assaults, burglaries, thefts, arson
Full-time law enforcement employees in 2021, including police officers: 12 (11 officers - 11 male; 0 female).
| Officers per 1,000 residents here: | 1.63 |
| Minnesota average: | 1.76 |
 Recent articles from our blog. Our writers, many of them Ph.D. graduates or candidates, create easy-to-read articles on a wide variety of topics.

 | Why is the AQI in Corcoran so terrible? (5 replies) |
| Minneapolis getting closer to the 400K Mark (149 replies) |
| Is Corcoran in the Powderhorn community a neighborhood that is potential family friendly? (8 replies) |
| Corcoran-Buffalo Schools (2 replies) |
| Twin Cities - 16th largest metro area in the Country, can you feel it? (90 replies) |
| Dayton and Corcoran (6 replies) |
Latest news from Corcoran, MN collected exclusively by city-data.com from local newspapers, TV, and radio stations
Ancestries: German (17.4%), Finnish (8.8%), American (7.2%), European (6.6%), British (5.2%), Swedish (4.3%).
Current Local Time: CST time zone
Incorporated on 05/11/1858
Elevation: 960 feet
Land area: 35.8 square miles.
Population density: 206 people per square mile (very low).
876 residents are foreign born (9.6% Asia, 1.7% Europe).
| This city: | 13.5% |
| Minnesota: | 8.5% |
Median real estate property taxes paid for housing units with mortgages in 2022: $5,729 (1.1%)
Median real estate property taxes paid for housing units with no mortgage in 2022: $5,196 (1.2%)
Nearest city with pop. 50,000+: Maple Grove, MN  (6.0 miles , pop. 50,365).
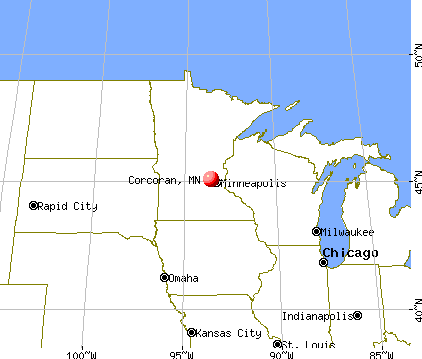
Nearest city with pop. 200,000+: Minneapolis, MN (17.8 miles , pop. 382,618).
Nearest city with pop. 1,000,000+: Chicago, IL (372.0 miles , pop. 2,896,016).
Nearest cities:
), ), ), )Latitude: 45.10 N, Longitude: 93.57 W
Daytime population change due to commuting: -1,341 (-20.6%)
Workers who live and work in this city: 907 (28.0%)


Corcoran, Minnesota accommodation & food services, waste management - Economy and Business Data
Single-family new house construction building permits:
- 2022: 181 buildings, average cost: $410,800
- 2021: 292 buildings, average cost: $374,100
- 2020: 238 buildings, average cost: $337,600
- 2019: 152 buildings, average cost: $346,700
- 2018: 67 buildings, average cost: $378,000
- 2017: 74 buildings, average cost: $391,100
- 2016: 59 buildings, average cost: $397,700
- 2015: 37 buildings, average cost: $387,700
- 2014: 8 buildings, average cost: $404,300
- 2013: 3 buildings, average cost: $455,000
- 2012: 4 buildings, average cost: $337,300
- 2011: 5 buildings, average cost: $314,200
- 2010: 5 buildings, average cost: $450,300
- 2008: 7 buildings, average cost: $413,200
- 2007: 6 buildings, average cost: $562,700
- 2006: 11 buildings, average cost: $531,700
- 2005: 18 buildings, average cost: $482,500
- 2004: 17 buildings, average cost: $398,500
- 2003: 16 buildings, average cost: $446,000
- 2002: 23 buildings, average cost: $400,400
- 2001: 32 buildings, average cost: $289,600
- 2000: 24 buildings, average cost: $383,900
- 1999: 26 buildings, average cost: $253,800
- 1998: 33 buildings, average cost: $215,000
- 1997: 9 buildings, average cost: $240,200


| Here: | 2.2% |
| Minnesota: | 2.6% |


Population change in the 1990s: +527 (+10.3%).

- Construction (9.9%)
- Professional, scientific, technical services (8.5%)
- Health care (6.0%)
- Finance & insurance (5.2%)
- Accommodation & food services (4.1%)
- Metal & metal products (4.0%)
- Administrative & support & waste management services (3.5%)

- Construction (17.4%)
- Professional, scientific, technical services (7.4%)
- Metal & metal products (5.7%)
- Administrative & support & waste management services (3.9%)
- Motor vehicle & parts dealers (3.9%)
- Real estate & rental & leasing (3.2%)
- Repair & maintenance (3.1%)

- Health care (12.2%)
- Professional, scientific, technical services (9.9%)
- Finance & insurance (8.3%)
- Accommodation & food services (5.7%)
- Food & beverage stores (4.7%)
- Educational services (4.2%)
- Computer & electronic products (3.2%)

- Other sales and related occupations, including supervisors (4.8%)
- Other office and administrative support workers, including supervisors (4.6%)
- Electrical equipment mechanics and other installation, maintenance, and repair workers, including supervisors (4.1%)
- Other management occupations, except farmers and farm managers (3.8%)
- Sales representatives, services, wholesale and manufacturing (3.5%)
- Other production occupations, including supervisors (3.4%)
- Computer specialists (3.4%)

- Electrical equipment mechanics and other installation, maintenance, and repair workers, including supervisors (6.7%)
- Other sales and related occupations, including supervisors (5.2%)
- Sales representatives, services, wholesale and manufacturing (4.6%)
- Other management occupations, except farmers and farm managers (4.2%)
- Computer specialists (4.2%)
- Driver/sales workers and truck drivers (4.1%)
- Top executives (3.7%)

- Other office and administrative support workers, including supervisors (8.1%)
- Cashiers (4.8%)
- Bookkeeping, accounting, and auditing clerks (4.7%)
- Secretaries and administrative assistants (4.4%)
- Other sales and related occupations, including supervisors (4.4%)
- Registered nurses (3.9%)
- Accountants and auditors (3.8%)
Average climate in Corcoran, Minnesota
Based on data reported by over 4,000 weather stations


|
|

(lower is better)

Air Quality Index (AQI) level in 2022 was 66.8. This is about average.
| City: | 66.8 |
| U.S.: | 72.6 |

Carbon Monoxide (CO) [ppm] level in 2022 was 0.144. This is significantly better than average. Closest monitor was 17.4 miles away from the city center.
| City: | 0.144 |
| U.S.: | 0.251 |

Nitrogen Dioxide (NO2) [ppb] level in 2022 was 8.90. This is significantly worse than average. Closest monitor was 7.4 miles away from the city center.
| City: | 8.90 |
| U.S.: | 5.11 |

Sulfur Dioxide (SO2) [ppb] level in 2022 was 0.678. This is significantly better than average. Closest monitor was 7.4 miles away from the city center.
| City: | 0.678 |
| U.S.: | 1.515 |

Ozone [ppb] level in 2022 was 30.7. This is about average. Closest monitor was 10.0 miles away from the city center.
| City: | 30.7 |
| U.S.: | 33.3 |

Particulate Matter (PM10) [µg/m3] level in 2022 was 17.8. This is about average. Closest monitor was 8.6 miles away from the city center.
| City: | 17.8 |
| U.S.: | 19.2 |

Particulate Matter (PM2.5) [µg/m3] level in 2022 was 6.42. This is better than average. Closest monitor was 8.6 miles away from the city center.
| City: | 6.42 |
| U.S.: | 8.11 |

Lead (Pb) [µg/m3] level in 2010 was 0.00272. This is significantly better than average. Closest monitor was 7.4 miles away from the city center.
| City: | 0.00272 |
| U.S.: | 0.00931 |
Tornado activity:
Corcoran-area historical tornado activity is slightly above Minnesota state average. It is 24% greater than the overall U.S. average.
On 5/6/1965, a category F4 (max. wind speeds 207-260 mph) tornado 10.9 miles away from the Corcoran city center caused between $5,000,000 and $50,000,000 in damages.
On 5/6/1965, a category F4 tornado 12.0 miles away from the city center killed 3 people and injured 175 people and caused between $5,000,000 and $50,000,000 in damages.
Earthquake activity:
Corcoran-area historical earthquake activity is significantly above Minnesota state average. It is 53% smaller than the overall U.S. average.On 7/9/1975 at 14:54:15, a magnitude 4.6 (4.6 MB, Class: Light, Intensity: IV - V) earthquake occurred 126.1 miles away from the city center
On 6/5/1993 at 01:24:53, a magnitude 4.1 (4.1 LG, Depth: 6.2 mi) earthquake occurred 137.8 miles away from the city center
On 3/4/1983 at 06:32:18, a magnitude 4.6 (4.4 MB, 4.6 LG, 4.4 ML) earthquake occurred 293.5 miles away from Corcoran center
On 10/20/1995 at 15:57:18, a magnitude 3.7 (3.7 LG, Depth: 3.1 mi, Class: Light, Intensity: II - III) earthquake occurred 166.5 miles away from Corcoran center
On 2/9/1994 at 08:45:35, a magnitude 3.1 (3.1 LG, Depth: 3.1 mi) earthquake occurred 70.1 miles away from the city center
On 11/3/2002 at 20:41:56, a magnitude 4.3 (4.3 MB, Depth: 3.1 mi) earthquake occurred 310.3 miles away from Corcoran center
Magnitude types: regional Lg-wave magnitude (LG), body-wave magnitude (MB), local magnitude (ML)
Natural disasters:
The number of natural disasters in Hennepin County (17) is near the US average (15).Major Disasters (Presidential) Declared: 12
Emergencies Declared: 4
Causes of natural disasters: Floods: 11, Storms: 8, Tornadoes: 4, Winds: 3, Drought: 1, Hurricane: 1, Landslide: 1, Mudslide: 1, Other: 2 (Note: some incidents may be assigned to more than one category).
Hospitals and medical centers near Corcoran:
- HAMMER LAWNDALE (Hospital, about 4 miles away; MAPLE GROVE, MN)
- DCI 75TH (Hospital, about 6 miles away; MAPLE GROVE, MN)
- MAPLE GROVE DIALYSIS OF DAVITA (Dialysis Facility, about 6 miles away; MAPLE GROVE, MN)
- HOMEWARD BOUND - MAPLE GROVE (Hospital, about 7 miles away; MAPLE GROVE, MN)
- FMC - MAPLE GROVE DIALYSIS (Dialysis Facility, about 7 miles away; MAPLE GROVE, MN)
- OUTREACH PLYMOUTH HOME WEST (Hospital, about 8 miles away; PLYMOUTH, MN)
- HAMMER MCGLINCH (Hospital, about 8 miles away; PLYMOUTH, MN)
Airports located in Corcoran:
- Kral's Personal Use Landing Field Airport (42MN) (Runways: 1)
Operable nuclear power plant near Corcoran:
- 18 miles: Monticello in Monticello, MN.
Colleges/universities with over 2000 students nearest to Corcoran:
- Hennepin Technical College (about 9 miles; Brooklyn Park, MN; Full-time enrollment: 4,515)
- North Hennepin Community College (about 10 miles; Brooklyn Park, MN; FT enrollment: 4,943)
- Anoka-Ramsey Community College (about 12 miles; Coon Rapids, MN; FT enrollment: 5,918)
- Minneapolis Community and Technical College (about 17 miles; Minneapolis, MN; FT enrollment: 6,726)
- Walden University (about 18 miles; Minneapolis, MN; FT enrollment: 62,473)
- Capella University (about 18 miles; Minneapolis, MN; FT enrollment: 21,718)
- University of Minnesota-Twin Cities (about 19 miles; Minneapolis, MN; FT enrollment: 43,506)
Private elementary/middle school in Corcoran:
- ST JOHN'S LUTHERAN SCHOOL (Students: 192, Location: 9141 COUNTY ROAD 101, Grades: PK-8)
Points of interest:
Notable locations in Corcoran: Hennepin County Fairgrounds (A), Shamrock Golf Course (B), Pheasant Run Golf Course (C), Tessmer Dairy Farm (D), Corcoran City Hall (E). Display/hide their locations on the map
Churches in Corcoran include: Maple Grove Church (A), Hope Community Church (B), Immanuel Church (C). Display/hide their locations on the map
Cemeteries: Saint John's Evangelical Lutheran Cemetery (1), Saint Thomas Cemetery (2), Old Saint Thomas Cemetery (3), Saint Janes Cemetery (4), Old Saint Walburga Cemetery (5). Display/hide their locations on the map
Lakes: Morin Lake (A), Scott Lake (B), Jubert Lake (C). Display/hide their locations on the map
Park in Corcoran: Corcoran Community Park (1). Display/hide its location on the map
| This city: | 2.9 people |
| Minnesota: | 2.5 people |
| This city: | 82.6% |
| Whole state: | 64.6% |
| This city: | 5.2% |
| Whole state: | 6.9% |
Likely homosexual households (counted as self-reported same-sex unmarried-partner households)
- Lesbian couples: 0.3% of all households
- Gay men: 0.4% of all households
Banks with branches in Corcoran (2011 data):
- Farmers State Bank of Hamel: Corcoran Detached Facility at County Road 116 And County Road 10, branch established on 1982/03/31. Info updated 2010/06/03: Bank assets: $90.4 mil, Deposits: $79.7 mil, headquarters in Hamel, MN, positive income, Commercial Lending Specialization, 2 total offices
For population 15 years and over in Corcoran:

- Never married: 18.1%
- Now married: 70.3%
- Separated: 0.2%
- Widowed: 3.3%
- Divorced: 8.1%
For population 25 years and over in Corcoran:
- High school or higher: 95.3%
- Bachelor's degree or higher: 48.4%
- Graduate or professional degree: 17.2%
- Unemployed: 1.9%
- Mean travel time to work (commute): 18.9 minutes


| Here: | 9.4 |
| Minnesota average: | 10.9 |


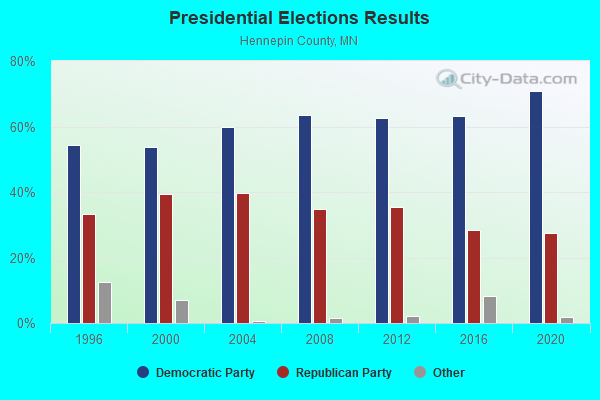
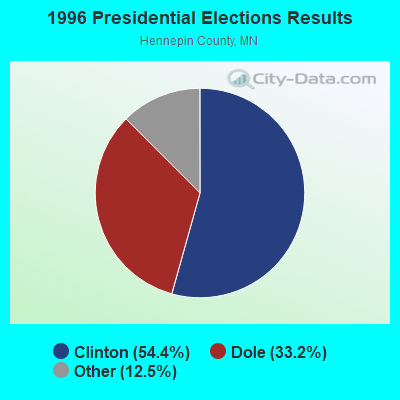
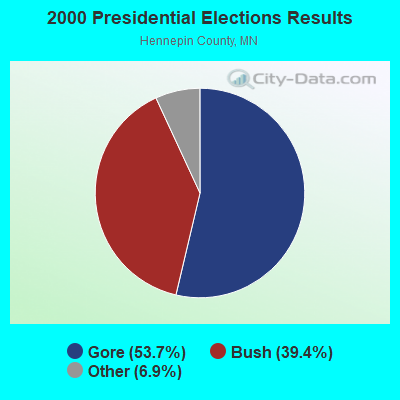
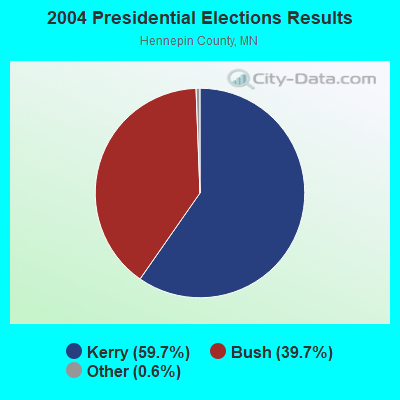
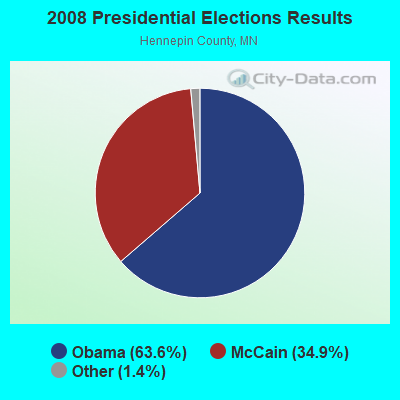
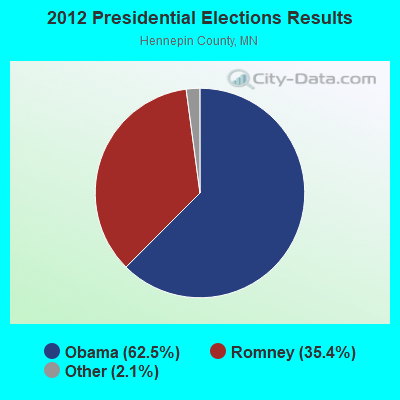
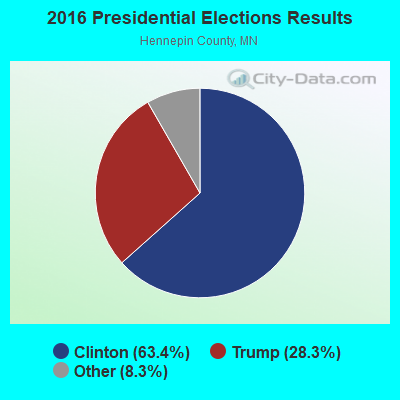
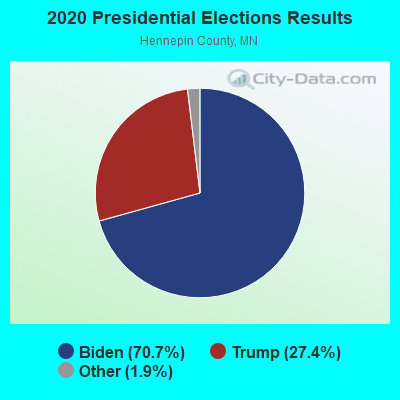
Graphs represent county-level data. Detailed 2008 Election Results
Religion statistics for Corcoran, MN (based on Hennepin County data)
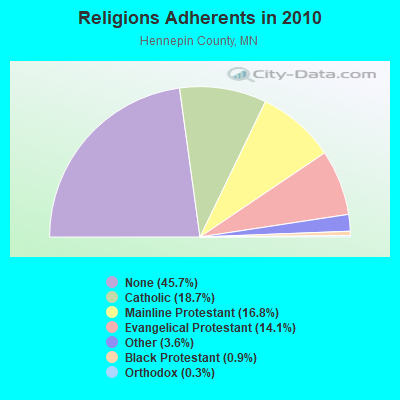
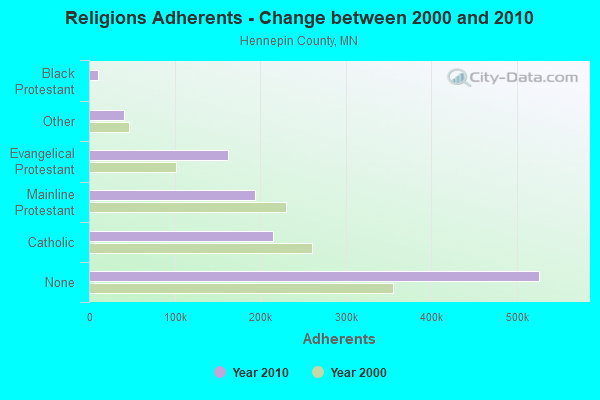
| Religion | Adherents | Congregations |
|---|---|---|
| Catholic | 215,205 | 74 |
| Mainline Protestant | 193,498 | 234 |
| Evangelical Protestant | 162,094 | 393 |
| Other | 41,287 | 110 |
| Black Protestant | 10,812 | 21 |
| Orthodox | 3,337 | 6 |
| None | 526,192 | - |
Food Environment Statistics:
| Hennepin County: | 1.79 / 10,000 pop. |
| Minnesota: | 1.83 / 10,000 pop. |
| This county: | 0.12 / 10,000 pop. |
| Minnesota: | 0.13 / 10,000 pop. |
| Hennepin County: | 0.69 / 10,000 pop. |
| Minnesota: | 0.49 / 10,000 pop. |
| Hennepin County: | 2.50 / 10,000 pop. |
| Minnesota: | 3.90 / 10,000 pop. |
| Here: | 7.13 / 10,000 pop. |
| State: | 6.98 / 10,000 pop. |
| Hennepin County: | 5.8% |
| Minnesota: | 6.5% |
| Hennepin County: | 22.8% |
| Minnesota: | 25.9% |
| Hennepin County: | 15.2% |
| Minnesota: | 13.0% |
Health and Nutrition:
| Here: | 45.7% |
| State: | 50.6% |
| Here: | 39.9% |
| Minnesota: | 48.4% |
| Corcoran: | 29.0 |
| Minnesota: | 28.5 |
| This city: | 22.3% |
| Minnesota: | 21.0% |
| Corcoran: | 10.7% |
| Minnesota: | 9.8% |
| Corcoran: | 6.7 |
| State: | 6.8 |
| Corcoran: | 34.2% |
| Minnesota: | 33.5% |
| Here: | 52.7% |
| State: | 57.7% |
| This city: | 77.0% |
| Minnesota: | 79.3% |
More about Health and Nutrition of Corcoran, MN Residents
| Local government employment and payroll (March 2022) | |||||
| Function | Full-time employees | Monthly full-time payroll | Average yearly full-time wage | Part-time employees | Monthly part-time payroll |
|---|---|---|---|---|---|
| Police Protection - Officers | 11 | $86,751 | $94,637 | 1 | $265 |
| Other Government Administration | 9 | $71,590 | $95,453 | 1 | $301 |
| Streets and Highways | 8 | $67,024 | $100,536 | 2 | $777 |
| Financial Administration | 2 | $13,206 | $79,236 | 0 | $0 |
| Police - Other | 2 | $11,300 | $67,800 | 2 | $610 |
| Other and Unallocable | 1 | $7,382 | $88,584 | 0 | $0 |
| Parks and Recreation | 0 | $0 | 1 | $993 | |
| Totals for Government | 33 | $257,254 | $93,547 | 7 | $2,946 |
Corcoran government finances - Expenditure in 2017 (per resident):
- Construction - General Public Buildings: $25,000 ($3.39)
- Current Operations - General - Other: $2,910,000 ($394.10)
Regular Highways: $1,078,000 ($145.99)
Police Protection: $881,000 ($119.31)
Central Staff Services: $531,000 ($71.91)
Parks and Recreation: $94,000 ($12.73)
Judicial and Legal Services: $32,000 ($4.33)
- Intergovernmental to Local - Other - Local Fire Protection: $280,000 ($37.92)
Other - Sewerage: $131,000 ($17.74)
Other - Water Utilities: $118,000 ($15.98)
- Other Capital Outlay - General - Other: $2,881,000 ($390.17)
Police Protection: $105,000 ($14.22)
- Total Salaries and Wages: $1,309,000 ($177.28)
- Water Utilities - Interest on Debt: $342,000 ($46.32)
Corcoran government finances - Revenue in 2017 (per resident):
- Charges - Miscellaneous Commercial Activities: $50,000 ($6.77)
Parks and Recreation: $35,000 ($4.74)
Solid Waste Management: $4,000 ($0.54)
- Local Intergovernmental - Other: $16,000 ($2.17)
- Miscellaneous - Special Assessments: $67,000 ($9.07)
Donations From Private Sources: $66,000 ($8.94)
Fines and Forfeits: $49,000 ($6.64)
General Revenue - Other: $35,000 ($4.74)
Rents: $10,000 ($1.35)
- Revenue - Water Utilities: $1,618,000 ($219.12)
- State Intergovernmental - Highways: $128,000 ($17.33)
General Local Government Support: $100,000 ($13.54)
- Tax - Property: $3,106,000 ($420.64)
Alcoholic Beverage License: $18,000 ($2.44)
Corcoran government finances - Debt in 2017 (per resident):
- Long Term Debt - Outstanding Unspecified Public Purpose: $11,229,000 ($1520.72)
Beginning Outstanding - Unspecified Public Purpose: $8,546,000 ($1157.37)
Issue, Unspecified Public Purpose: $3,033,000 ($410.75)
Retired Unspecified Public Purpose: $350,000 ($47.40)
Corcoran government finances - Cash and Securities in 2017 (per resident):
- Other Funds - Cash and Securities: $8,197,000 ($1110.10)
6.75% of this county's 2021 resident taxpayers lived in other counties in 2020 ($70,758 average adjusted gross income)
| Here: | 6.75% |
| Minnesota average: | 7.43% |
0.00% of residents moved from foreign countries ($39 average AGI)
Hennepin County: 0.00% Minnesota average: 0.00%
Top counties from which taxpayers relocated into this county between 2020 and 2021:
| from Ramsey County, MN | |
| from Anoka County, MN | |
| from Dakota County, MN |
8.44% of this county's 2020 resident taxpayers moved to other counties in 2021 ($85,733 average adjusted gross income)
| Here: | 8.44% |
| Minnesota average: | 7.79% |
0.01% of residents moved to foreign countries ($68 average AGI)
Hennepin County: 0.01% Minnesota average: 0.00%
Top counties to which taxpayers relocated from this county between 2020 and 2021:
| to Ramsey County, MN | |
| to Anoka County, MN | |
| to Dakota County, MN |
Strongest AM radio stations in Corcoran:
- WCCO (830 AM; 50 kW; MINNEAPOLIS, MN; Owner: INFINITY MEDIA CORPORATION)
- KSTP (1500 AM; 50 kW; ST. PAUL, MN; Owner: KSTP-AM, LLC (DELAWARE))
- KFAN (1130 AM; 50 kW; MINNEAPOLIS, MN; Owner: AMFM RADIO LICENSES, L.L.C.)
- KLBP (1470 AM; 5 kW; BROOKLYN PARK, MN; Owner: 1400, INC.)
- WCTS (1030 AM; 50 kW; MAPLEWOOD, MN; Owner: CNTL. BAPT. THEO/AL SEMI MINNEAPOLIS)
- KTIS (900 AM; 25 kW; MINNEAPOLIS, MN; Owner: NORTHWESTERN COLLEGE)
- KDIZ (1440 AM; 5 kW; GOLDEN VALLEY, MN; Owner: KQRS, INC.)
- WWTC (1280 AM; 5 kW; MINNEAPOLIS, MN; Owner: SCA LICENSE CORPORATION)
- KUOM (770 AM; daytime; 5 kW; MINNEAPOLIS, MN)
- KSMM (1530 AM; 9 kW; SHAKOPEE, MN; Owner: STARBOARD BROADCASTING, INC.)
- KWOM (1600 AM; 5 kW; WATERTOWN, MN; Owner: WATERTOWN RADIO, INC.)
- WMNN (1330 AM; 10 kW; MINNEAPOLIS, MN; Owner: MINNESOTA PUBLIC RADIO.)
- KYCR (1570 AM; 4 kW; GOLDEN VALLEY, MN; Owner: COMMON GROUND BROADCASTING COMPANY,)
Strongest FM radio stations in Corcoran:
- KQQL (107.9 FM; ANOKA, MN; Owner: AMFM RADIO LICENSES, L.L.C.)
- KTCZ-FM (97.1 FM; MINNEAPOLIS, MN; Owner: AMFM RADIO LICENSES, L.L.C.)
- KNOW-FM (91.1 FM; MINNEAPOLIS-ST. PAUL, MN; Owner: MINNESOTA PUBLIC RADIO)
- WLTE (102.9 FM; MINNEAPOLIS, MN; Owner: INFINITY MEDIA CORPORATION)
- KJZI (100.3 FM; MINNEAPOLIS, MN; Owner: AMFM RADIO LICENSES, L.L.C.)
- KSTP-FM (94.5 FM; ST. PAUL, MN; Owner: KSTP-FM, LLC, A DELAWARE LLC)
- KEEY-FM (102.1 FM; ST. PAUL, MN; Owner: AMFM RADIO LICENSES, L.L.C.)
- KTIS-FM (98.5 FM; MINNEAPOLIS, MN; Owner: NORTHWESTERN COLLEGE)
- KDWB-FM (101.3 FM; RICHFIELD, MN; Owner: AMFM RADIO LICENSES, L.L.C.)
- KQRS-FM (92.5 FM; GOLDEN VALLEY, MN; Owner: KQRS, Inc.)
- KSJN (99.5 FM; MINNEAPOLIS, MN; Owner: MINNESOTA PUBLIC RADIO)
- KXXR (93.7 FM; MINNEAPOLIS, MN; Owner: KQRS, INC.)
- K214DF (90.7 FM; GOLDEN VALLEY, MN; Owner: EDUCATIONAL MEDIA FOUNDATION)
- KTTB (96.3 FM; GLENCOE, MN; Owner: BLUE CHIP BROADCASTING LICENSES II, LTD.)
- KFAI (90.3 FM; MINNEAPOLIS, MN; Owner: FRESH AIR, INC.)
- KLCI (106.1 FM; ELK RIVER, MN; Owner: MILESTONE RADIO LLC)
- KBEM-FM (88.5 FM; MINNEAPOLIS, MN; Owner: BD. OF EDUCATION, S.S.D. NO. 1)
- WFMP (107.1 FM; COON RAPIDS, MN; Owner: WFMP-FM, LLC)
- WGVZ (105.7 FM; EDEN PRAIRIE, MN; Owner: KQRS, INC.)
- WXPT (104.1 FM; ST. LOUIS PARK, MN; Owner: THE AUDIO HOUSE, INC.)
TV broadcast stations around Corcoran:
- KARE (Channel 11; MINNEAPOLIS, MN; Owner: MULTIMEDIA HOLDINGS CORPORATION)
- KSTP-TV (Channel 5; ST. PAUL, MN; Owner: HUBBARD BROADCASTING, INC.)
- KMSP-TV (Channel 9; MINNEAPOLIS, MN; Owner: FOX TELEVISION STATIONS, INC.)
- KTCA-TV (Channel 2; ST. PAUL, MN; Owner: TWIN CITIES PUBLIC TELEVISION, INC.)
- KPXM (Channel 41; ST. CLOUD, MN; Owner: PAXSON MINNEAPOLIS LICENSE, INC.)
- K07UI (Channel 7; MINNEAPOLIS, ETC., MN; Owner: WORD OF GOD FELLOWSHIP, INC.)
- WCCO-TV (Channel 4; MINNEAPOLIS, MN; Owner: CBS BROADCASTING INC.)
- KSTC-TV (Channel 45; MINNEAPOLIS, MN; Owner: HUBBARD BROADCASTING, INC.)
- KTCI-TV (Channel 17; ST. PAUL, MN; Owner: TWIN CITIES PUBLIC TELEVISION, INC.)
- KMWB (Channel 23; MINNEAPOLIS, MN; Owner: KLGT LICENSEE, LLC)
- WFTC (Channel 29; MINNEAPOLIS, MN; Owner: FOX TELEVISION STATIONS, INC.)
- K58BS (Channel 58; MINNEAPOLIS, MN; Owner: TRINITY BROADCASTING NETWORK)
- K67HG (Channel 67; MINNEAPOLIS, MN; Owner: VENTANA TELEVISION, INC.)
- K19ER (Channel 19; ST. PAUL, MN; Owner: CATHOLIC VIEWS BROADCASTS, INC.)
- K14KH (Channel 14; MINNEAPOLIS, MN; Owner: THREE ANGELS BROADCASTING NETWORK)
- W62BD (Channel 62; MINNEAPOLIS, MN; Owner: WORD OF GOD FELLOWSHIP, INC.)
- WBWX-CA (Channel 13; MINNEAPOLIS, MN; Owner: THE BOX WORLDWIDE LLC)

- National Bridge Inventory (NBI) Statistics
- 1Number of bridges
- 10ft / 3.4mTotal length
FCC Registered Antenna Towers:
7- Corrie Zaldivar, 20140 County Rd. 30 (Lat: 45.132250 Lon: -93.549222), Type: 45.4, Overall height: 45.4 m, Registrant: Wireless Applications Corporation, Fcc@wacorp.Net, , Belle-vue, Phone: (425) 643-5000
- Corrie Zaldivar, 20140 County Rd. 30 (Lat: 45.132250 Lon: -93.549222), Type: 45.4, Overall height: 45.4 m, Registrant: Wireless Applications Corporation, Fcc@wacorp.Net, , Belle-vue, Phone: (425) 643-5000
- Kristin Steiner, 20140 County Rd. 30 (Lat: 45.132250 Lon: -93.549222), Type: 45.4, Overall height: 45.4 m, Registrant: Mobilitie Investments, LLC, Pm@mobilitie.Com, , Newpo-rt Beach, Phone: (949) 515-1500
- Edward G Roach, 20140 County Rd. 30 (Lat: 45.132250 Lon: -93.549222), Type: 45.4, Overall height: 45.4 m, Registrant: Sba Monarch Towers I, LLC, Eroach@sbasite.Com, , Boca -Raton, Phone: (561) 995-7670
- Edward G Roach, 20140 County Rd. 30 (Mn40156-T) (Lat: 45.132250 Lon: -93.549222), Type: 46.9, Structure height: 27053 m, Overall height: 45.7 m, Registrant: Sba Monarch Towers I, LLC, Eroach@sbasite.Com, , Boca -Raton, Phone: (561) 995-7670
- Edward G Roach, 20140 County Rd. 30 (Mn40156-T) (Lat: 45.132250 Lon: -93.549222), Type: 46.9, Structure height: 27053 m, Overall height: 45.7 m, Registrant: Sba Monarch Towers I, LLC, Eroach@sbasite.Com, , Boca -Raton, Phone: (561) 995-7670
- 23400 Cr 10n (Lat: 45.124167 Lon: -93.633333), Type: 73.1, Overall height: 67 m, Registrant: Hennepin, County, Mike.Hogan@co.Hennepin.Mn.Us, , Minne-apolis, Phone: (612) 525-6231
FCC Registered Broadcast Land Mobile Towers:
3- 23400 Cr 10n (Lat: 45.124167 Lon: -93.633333), Type: Tower, Structure height: 67 m, Overall height: 73.1 m, Call Sign: WPYB577,
Assigned Frequencies: 854.362 MHz, Grant Date: 07/15/2003, Expiration Date: 07/15/2013, Cancellation Date: 09/14/2013, Certifier: David C Savolainen, Registrant: State Of Minnesota, 395 John Ireland Boulevard, Ms730, Saint Paul, MN 55155, Phone: (651) 234-7969, Fax: (651) 244-7960, Email:
- Lat: 45.086778 Lon: -93.535667, Call Sign: WPYQ848,
Assigned Frequencies: 452.087 MHz, 457.087 MHz, Grant Date: 08/23/2023, Expiration Date: 10/01/2033, Certifier: Rick Deziel, Registrant: Shamrock Golf Operations, LLC, 19625 Larkin Road, Corcoran, MN 55340, Phone: (763) 478-9977, Email:
- Lat: 45.122833 Lon: -93.522583, Call Sign: WRPP810,
Assigned Frequencies: 452.987 MHz, 462.287 MHz, 467.287 MHz, 467.850 MHz, 467.900 MHz, Grant Date: 03/03/2022, Expiration Date: 03/03/2032, Certifier: Rob Borcherding, Registrant: Ancom Communications, Inc, 1800 Cliff Rd E Ste 17, Burnsville, MN 55337, Phone: (952) 808-0033, Fax: (952) 808-0034, Email:
FCC Registered Microwave Towers:
5- Burschville, 23400 Cr 10n (Lat: 45.124167 Lon: -93.633333), Type: Tower, Structure height: 67 m, Overall height: 73.1 m, Call Sign: WPQL509,
Assigned Frequencies: 6004.50 MHz, 11285.0 MHz, 6034.15 MHz, 6123.10 MHz, Grant Date: 03/04/2020, Expiration Date: 05/16/2030, Certifier: Signature On File, Registrant: Minnesota Dept Of Transportation, 1500 West County Road B2 Ms730, Roseville, MN 55113, Phone: (651) 234-7973, Fax: (651) 234-7960, Email:
- MSPCCN, 7205 County Road 101 (Lat: 45.083694 Lon: -93.523694), Type: Pole, Structure height: 25.9 m, Call Sign: WQJZ987,
Assigned Frequencies: 17950.0 MHz, 17960.0 MHz, 18080.0 MHz, 17960.0 MHz, 18080.0 MHz, 17960.0 MHz, 18080.0 MHz, 17960.0 MHz, 18080.0 MHz, 17960.0 MHz... (+3 more), Grant Date: 03/03/2009, Expiration Date: 03/03/2019, Cancellation Date: 05/04/2019, Certifier: Kurt Maass, Registrant: Telecom Transport Management, Inc., 146 N. Canal Street, Suite 210, Seattle, WA 98103, Phone: (206) 816-6907, Fax: (206) 545-9585, Email:
- Hennepin-Corcoran, 23400 Cr 10n (Lat: 45.124167 Lon: -93.633333), Type: Tower, Structure height: 67 m, Overall height: 73.1 m, Call Sign: WQKA719,
Assigned Frequencies: 10935.0 MHz, 10935.0 MHz, 10935.0 MHz, 10735.0 MHz, 10735.0 MHz, Grant Date: 04/23/2019, Expiration Date: 03/10/2029, Certifier: Greg G Arvig, Registrant: Nextera Wireless, 5909 Baker Road, Suite 590, Minnetonka, MN 55345, Phone: (952) 564-6900, Email:
- MSPAJP, 23400 Cr 10n (Lat: 45.124167 Lon: -93.633333), Type: Tower, Structure height: 67 m, Overall height: 73.1 m, Call Sign: WQNE217,
Assigned Frequencies: 11075.0 MHz, 11055.0 MHz, 11055.0 MHz, 11055.0 MHz, 11055.0 MHz, 11055.0 MHz, Grant Date: 01/05/2011, Expiration Date: 01/05/2021, Cancellation Date: 03/13/2021, Certifier: Alexis Diaz, Registrant: Telecom Transport Management, Inc., 146 N. Canal Street, Suite 210, Seattle, WA 98103, Phone: (206) 816-6907, Fax: (206) 545-9585, Email:
- BURSCHVILLE, 23400 Cr 10n (Lat: 45.124167 Lon: -93.633333), Type: Ltower, Structure height: 67 m, Overall height: 73.1 m, Call Sign: WQRP411,
Assigned Frequencies: 10885.0 MHz, Grant Date: 04/27/2023, Expiration Date: 07/01/2033, Certifier: King Fung, Registrant: County Of Hennepin, 1245 Shenandoah Lane N, Plymouth, MN 55447, Phone: (612) 596-1296, Fax: (612) 313-3654, Email:
FCC Registered Amateur Radio Licenses:
15 (See the full list of FCC Registered Amateur Radio Licenses in Corcoran)FAA Registered Aircraft:
11 (See the full list of FAA Registered Aircraft in Corcoran)| Home Mortgage Disclosure Act Aggregated Statistics For Year 2009 (Based on 1 full tract) | ||||||||||||
| A) FHA, FSA/RHS & VA Home Purchase Loans | B) Conventional Home Purchase Loans | C) Refinancings | D) Home Improvement Loans | F) Non-occupant Loans on < 5 Family Dwellings (A B C & D) | G) Loans On Manufactured Home Dwelling (A B C & D) | |||||||
|---|---|---|---|---|---|---|---|---|---|---|---|---|
| Number | Average Value | Number | Average Value | Number | Average Value | Number | Average Value | Number | Average Value | Number | Average Value | |
| LOANS ORIGINATED | 12 | $256,455 | 24 | $265,784 | 171 | $254,586 | 4 | $98,200 | 8 | $143,679 | 0 | $0 |
| APPLICATIONS APPROVED, NOT ACCEPTED | 0 | $0 | 1 | $562,720 | 14 | $230,385 | 2 | $62,470 | 0 | $0 | 0 | $0 |
| APPLICATIONS DENIED | 2 | $331,335 | 6 | $384,808 | 45 | $283,547 | 0 | $0 | 4 | $203,398 | 1 | $35,980 |
| APPLICATIONS WITHDRAWN | 1 | $170,910 | 1 | $399,800 | 31 | $280,086 | 5 | $196,702 | 0 | $0 | 0 | $0 |
| FILES CLOSED FOR INCOMPLETENESS | 0 | $0 | 2 | $618,690 | 9 | $270,420 | 1 | $43,980 | 0 | $0 | 0 | $0 |
Detailed HMDA statistics for the following Tracts: 0271.02
| Private Mortgage Insurance Companies Aggregated Statistics For Year 2009 (Based on 1 full tract) | ||||
| A) Conventional Home Purchase Loans | B) Refinancings | |||
|---|---|---|---|---|
| Number | Average Value | Number | Average Value | |
| LOANS ORIGINATED | 5 | $259,870 | 3 | $243,543 |
| APPLICATIONS APPROVED, NOT ACCEPTED | 0 | $0 | 1 | $218,890 |
| APPLICATIONS DENIED | 1 | $154,920 | 2 | $241,380 |
| APPLICATIONS WITHDRAWN | 0 | $0 | 0 | $0 |
| FILES CLOSED FOR INCOMPLETENESS | 0 | $0 | 0 | $0 |
Detailed PMIC statistics for the following Tracts: 0271.02


2002 - 2018 National Fire Incident Reporting System (NFIRS) incidents
- Fire incident types reported to NFIRS in Corcoran, MN
- 22958.3%Structure Fires
- 13133.3%Outside Fires
- 276.9%Mobile Property/Vehicle Fires
- 61.5%Other
 Based on the data from the years 2002 - 2018 the average number of fires per year is 23. The highest number of fire incidents - 31 took place in 2015, and the least - 11 in 2002. The data has a rising trend.
 When looking into fire subcategories, the most reports belonged to: Structure Fires (58.3%), and Outside Fires (33.3%).
- 59.3%Utility gas
- 18.4%Bottled, tank, or LP gas
- 11.3%Electricity
- 6.2%Other fuel
- 2.6%Wood
- 2.2%Fuel oil, kerosene, etc.

- 79.7%Utility gas
- 20.3%Electricity
Corcoran compared to Minnesota state average:
- Median household income above state average.
- Median house value above state average.
- Unemployed percentage significantly below state average.
- Black race population percentage significantly below state average.
- Hispanic race population percentage significantly below state average.
- Foreign-born population percentage above state average.
- Renting percentage significantly below state average.
- Number of rooms per house above state average.
- House age below state average.
- Percentage of population with a bachelor's degree or higher above state average.
Corcoran on our top lists:
- #51 on the list of "Top 101 cities where residents moved more then 10 years ago (1,000+ households)"
- #65 on the list of "Top 101 cities with the most people living the same house as 1 year ago (population 5,000+))"
- #87 on the list of "Top 101 cities with the most cars per house, population 5,000+"
- #89 on the list of "Top 101 cities with largest percentage of females in industries: agriculture, forestry, fishing and hunting (population 5,000+)"
- #98 on the list of "Top 101 cities with largest percentage of females in occupations: management occupations (population 5,000+)"
- #65 (55340) on the list of "Top 101 zip codes with the largest percentage of Swedish first ancestries (pop 5,000+)"
- #73 (55374) on the list of "Top 101 zip codes with the largest percentage of Norwegian first ancestries (pop 5,000+)"
- #4 on the list of "Top 101 counties with the most Mainline Protestant adherents"
- #7 on the list of "Top 101 counties with the highest percentage of residents that exercised in the past month"
- #10 on the list of "Top 101 counties with the most Mainline Protestant congregations"
- #15 on the list of "Top 101 counties with the highest percentage of residents that visited a dentist within the past year"
- #28 on the list of "Top 101 counties with the best general health status score of residents (1-5), 3 years of data"

|
|
Total of 192 patent applications in 2008-2024.