Chillicothe, Illinois Submit your own pictures of this city and show them to the world
OSM Map
General Map
Google Map
MSN Map
OSM Map
General Map
Google Map
MSN Map
OSM Map
General Map
Google Map
MSN Map
OSM Map
General Map
Google Map
MSN Map
Please wait while loading the map...
Population in 2022: 6,005 (98% urban, 2% rural). Population change since 2000: +0.2%Males: 2,765 Females: 3,240
March 2022 cost of living index in Chillicothe: 82.8 (low, U.S. average is 100) Percentage of residents living in poverty in 2022: 19.2%for White Non-Hispanic residents , 1.8% for Black residents , 7.2% for Hispanic or Latino residents , 86.5% for two or more races residents )
Profiles of local businesses
Business Search - 14 Million verified businesses
Data:
Median household income ($)
Median household income (% change since 2000)
Household income diversity
Ratio of average income to average house value (%)
Ratio of average income to average rent
Median household income ($) - White
Median household income ($) - Black or African American
Median household income ($) - Asian
Median household income ($) - Hispanic or Latino
Median household income ($) - American Indian and Alaska Native
Median household income ($) - Multirace
Median household income ($) - Other Race
Median household income for houses/condos with a mortgage ($)
Median household income for apartments without a mortgage ($)
Races - White alone (%)
Races - White alone (% change since 2000)
Races - Black alone (%)
Races - Black alone (% change since 2000)
Races - American Indian alone (%)
Races - American Indian alone (% change since 2000)
Races - Asian alone (%)
Races - Asian alone (% change since 2000)
Races - Hispanic (%)
Races - Hispanic (% change since 2000)
Races - Native Hawaiian and Other Pacific Islander alone (%)
Races - Native Hawaiian and Other Pacific Islander alone (% change since 2000)
Races - Two or more races (%)
Races - Two or more races (% change since 2000)
Races - Other race alone (%)
Races - Other race alone (% change since 2000)
Racial diversity
Unemployment (%)
Unemployment (% change since 2000)
Unemployment (%) - White
Unemployment (%) - Black or African American
Unemployment (%) - Asian
Unemployment (%) - Hispanic or Latino
Unemployment (%) - American Indian and Alaska Native
Unemployment (%) - Multirace
Unemployment (%) - Other Race
Population density (people per square mile)
Population - Males (%)
Population - Females (%)
Population - Males (%) - White
Population - Males (%) - Black or African American
Population - Males (%) - Asian
Population - Males (%) - Hispanic or Latino
Population - Males (%) - American Indian and Alaska Native
Population - Males (%) - Multirace
Population - Males (%) - Other Race
Population - Females (%) - White
Population - Females (%) - Black or African American
Population - Females (%) - Asian
Population - Females (%) - Hispanic or Latino
Population - Females (%) - American Indian and Alaska Native
Population - Females (%) - Multirace
Population - Females (%) - Other Race
Coronavirus confirmed cases (Jul 06, 2024)
Deaths caused by coronavirus (Jul 06, 2024)
Coronavirus confirmed cases (per 100k population) (Jul 06, 2024)
Deaths caused by coronavirus (per 100k population) (Jul 06, 2024)
Daily increase in number of cases (Jul 06, 2024)
Weekly increase in number of cases (Jul 06, 2024)
Cases doubled (in days) (Jul 06, 2024)
Hospitalized patients (Apr 18, 2022)
Negative test results (Apr 18, 2022)
Total test results (Apr 18, 2022)
COVID Vaccine doses distributed (per 100k population) (Sep 19, 2023)
COVID Vaccine doses administered (per 100k population) (Sep 19, 2023)
COVID Vaccine doses distributed (Sep 19, 2023)
COVID Vaccine doses administered (Sep 19, 2023)
Likely homosexual households (%)
Likely homosexual households (% change since 2000)
Likely homosexual households - Lesbian couples (%)
Likely homosexual households - Lesbian couples (% change since 2000)
Likely homosexual households - Gay men (%)
Likely homosexual households - Gay men (% change since 2000)
Cost of living index
Median gross rent ($)
Median contract rent ($)
Median monthly housing costs ($)
Median house or condo value ($)
Median house or condo value ($ change since 2000)
Mean house or condo value by units in structure - 1, detached ($)
Mean house or condo value by units in structure - 1, attached ($)
Mean house or condo value by units in structure - 2 ($)
Mean house or condo value by units in structure by units in structure - 3 or 4 ($)
Mean house or condo value by units in structure - 5 or more ($)
Mean house or condo value by units in structure - Boat, RV, van, etc. ($)
Mean house or condo value by units in structure - Mobile home ($)
Median house or condo value ($) - White
Median house or condo value ($) - Black or African American
Median house or condo value ($) - Asian
Median house or condo value ($) - Hispanic or Latino
Median house or condo value ($) - American Indian and Alaska Native
Median house or condo value ($) - Multirace
Median house or condo value ($) - Other Race
Median resident age
Resident age diversity
Median resident age - Males
Median resident age - Females
Median resident age - White
Median resident age - Black or African American
Median resident age - Asian
Median resident age - Hispanic or Latino
Median resident age - American Indian and Alaska Native
Median resident age - Multirace
Median resident age - Other Race
Median resident age - Males - White
Median resident age - Males - Black or African American
Median resident age - Males - Asian
Median resident age - Males - Hispanic or Latino
Median resident age - Males - American Indian and Alaska Native
Median resident age - Males - Multirace
Median resident age - Males - Other Race
Median resident age - Females - White
Median resident age - Females - Black or African American
Median resident age - Females - Asian
Median resident age - Females - Hispanic or Latino
Median resident age - Females - American Indian and Alaska Native
Median resident age - Females - Multirace
Median resident age - Females - Other Race
Commute - mean travel time to work (minutes)
Travel time to work - Less than 5 minutes (%)
Travel time to work - Less than 5 minutes (% change since 2000)
Travel time to work - 5 to 9 minutes (%)
Travel time to work - 5 to 9 minutes (% change since 2000)
Travel time to work - 10 to 19 minutes (%)
Travel time to work - 10 to 19 minutes (% change since 2000)
Travel time to work - 20 to 29 minutes (%)
Travel time to work - 20 to 29 minutes (% change since 2000)
Travel time to work - 30 to 39 minutes (%)
Travel time to work - 30 to 39 minutes (% change since 2000)
Travel time to work - 40 to 59 minutes (%)
Travel time to work - 40 to 59 minutes (% change since 2000)
Travel time to work - 60 to 89 minutes (%)
Travel time to work - 60 to 89 minutes (% change since 2000)
Travel time to work - 90 or more minutes (%)
Travel time to work - 90 or more minutes (% change since 2000)
Marital status - Never married (%)
Marital status - Now married (%)
Marital status - Separated (%)
Marital status - Widowed (%)
Marital status - Divorced (%)
Median family income ($)
Median family income (% change since 2000)
Median non-family income ($)
Median non-family income (% change since 2000)
Median per capita income ($)
Median per capita income (% change since 2000)
Median family income ($) - White
Median family income ($) - Black or African American
Median family income ($) - Asian
Median family income ($) - Hispanic or Latino
Median family income ($) - American Indian and Alaska Native
Median family income ($) - Multirace
Median family income ($) - Other Race
Median year house/condo built
Median year apartment built
Year house built - Built 2005 or later (%)
Year house built - Built 2000 to 2004 (%)
Year house built - Built 1990 to 1999 (%)
Year house built - Built 1980 to 1989 (%)
Year house built - Built 1970 to 1979 (%)
Year house built - Built 1960 to 1969 (%)
Year house built - Built 1950 to 1959 (%)
Year house built - Built 1940 to 1949 (%)
Year house built - Built 1939 or earlier (%)
Average household size
Household density (households per square mile)
Average household size - White
Average household size - Black or African American
Average household size - Asian
Average household size - Hispanic or Latino
Average household size - American Indian and Alaska Native
Average household size - Multirace
Average household size - Other Race
Occupied housing units (%)
Vacant housing units (%)
Owner occupied housing units (%)
Renter occupied housing units (%)
Vacancy status - For rent (%)
Vacancy status - For sale only (%)
Vacancy status - Rented or sold, not occupied (%)
Vacancy status - For seasonal, recreational, or occasional use (%)
Vacancy status - For migrant workers (%)
Vacancy status - Other vacant (%)
Residents with income below the poverty level (%)
Residents with income below 50% of the poverty level (%)
Children below poverty level (%)
Poor families by family type - Married-couple family (%)
Poor families by family type - Male, no wife present (%)
Poor families by family type - Female, no husband present (%)
Poverty status for native-born residents (%)
Poverty status for foreign-born residents (%)
Poverty among high school graduates not in families (%)
Poverty among people who did not graduate high school not in families (%)
Residents with income below the poverty level (%) - White
Residents with income below the poverty level (%) - Black or African American
Residents with income below the poverty level (%) - Asian
Residents with income below the poverty level (%) - Hispanic or Latino
Residents with income below the poverty level (%) - American Indian and Alaska Native
Residents with income below the poverty level (%) - Multirace
Residents with income below the poverty level (%) - Other Race
Air pollution - Air Quality Index (AQI)
Air pollution - CO
Air pollution - NO2
Air pollution - SO2
Air pollution - Ozone
Air pollution - PM10
Air pollution - PM25
Air pollution - Pb
Crime - Murders per 100,000 population
Crime - Rapes per 100,000 population
Crime - Robberies per 100,000 population
Crime - Assaults per 100,000 population
Crime - Burglaries per 100,000 population
Crime - Thefts per 100,000 population
Crime - Auto thefts per 100,000 population
Crime - Arson per 100,000 population
Crime - City-data.com crime index
Crime - Violent crime index
Crime - Property crime index
Crime - Murders per 100,000 population (5 year average)
Crime - Rapes per 100,000 population (5 year average)
Crime - Robberies per 100,000 population (5 year average)
Crime - Assaults per 100,000 population (5 year average)
Crime - Burglaries per 100,000 population (5 year average)
Crime - Thefts per 100,000 population (5 year average)
Crime - Auto thefts per 100,000 population (5 year average)
Crime - Arson per 100,000 population (5 year average)
Crime - City-data.com crime index (5 year average)
Crime - Violent crime index (5 year average)
Crime - Property crime index (5 year average)
1996 Presidential Elections Results (%) - Democratic Party (Clinton)
1996 Presidential Elections Results (%) - Republican Party (Dole)
1996 Presidential Elections Results (%) - Other
2000 Presidential Elections Results (%) - Democratic Party (Gore)
2000 Presidential Elections Results (%) - Republican Party (Bush)
2000 Presidential Elections Results (%) - Other
2004 Presidential Elections Results (%) - Democratic Party (Kerry)
2004 Presidential Elections Results (%) - Republican Party (Bush)
2004 Presidential Elections Results (%) - Other
2008 Presidential Elections Results (%) - Democratic Party (Obama)
2008 Presidential Elections Results (%) - Republican Party (McCain)
2008 Presidential Elections Results (%) - Other
2012 Presidential Elections Results (%) - Democratic Party (Obama)
2012 Presidential Elections Results (%) - Republican Party (Romney)
2012 Presidential Elections Results (%) - Other
2016 Presidential Elections Results (%) - Democratic Party (Clinton)
2016 Presidential Elections Results (%) - Republican Party (Trump)
2016 Presidential Elections Results (%) - Other
2020 Presidential Elections Results (%) - Democratic Party (Biden)
2020 Presidential Elections Results (%) - Republican Party (Trump)
2020 Presidential Elections Results (%) - Other
Ancestries Reported - Arab (%)
Ancestries Reported - Czech (%)
Ancestries Reported - Danish (%)
Ancestries Reported - Dutch (%)
Ancestries Reported - English (%)
Ancestries Reported - French (%)
Ancestries Reported - French Canadian (%)
Ancestries Reported - German (%)
Ancestries Reported - Greek (%)
Ancestries Reported - Hungarian (%)
Ancestries Reported - Irish (%)
Ancestries Reported - Italian (%)
Ancestries Reported - Lithuanian (%)
Ancestries Reported - Norwegian (%)
Ancestries Reported - Polish (%)
Ancestries Reported - Portuguese (%)
Ancestries Reported - Russian (%)
Ancestries Reported - Scotch-Irish (%)
Ancestries Reported - Scottish (%)
Ancestries Reported - Slovak (%)
Ancestries Reported - Subsaharan African (%)
Ancestries Reported - Swedish (%)
Ancestries Reported - Swiss (%)
Ancestries Reported - Ukrainian (%)
Ancestries Reported - United States (%)
Ancestries Reported - Welsh (%)
Ancestries Reported - West Indian (%)
Ancestries Reported - Other (%)
Educational Attainment - No schooling completed (%)
Educational Attainment - Less than high school (%)
Educational Attainment - High school or equivalent (%)
Educational Attainment - Less than 1 year of college (%)
Educational Attainment - 1 or more years of college (%)
Educational Attainment - Associate degree (%)
Educational Attainment - Bachelor's degree (%)
Educational Attainment - Master's degree (%)
Educational Attainment - Professional school degree (%)
Educational Attainment - Doctorate degree (%)
School Enrollment - Nursery, preschool (%)
School Enrollment - Kindergarten (%)
School Enrollment - Grade 1 to 4 (%)
School Enrollment - Grade 5 to 8 (%)
School Enrollment - Grade 9 to 12 (%)
School Enrollment - College undergrad (%)
School Enrollment - Graduate or professional (%)
School Enrollment - Not enrolled in school (%)
School enrollment - Public schools (%)
School enrollment - Private schools (%)
School enrollment - Not enrolled (%)
Median number of rooms in houses and condos
Median number of rooms in apartments
Housing units lacking complete plumbing facilities (%)
Housing units lacking complete kitchen facilities (%)
Density of houses
Urban houses (%)
Rural houses (%)
Households with people 60 years and over (%)
Households with people 65 years and over (%)
Households with people 75 years and over (%)
Households with one or more nonrelatives (%)
Households with no nonrelatives (%)
Population in households (%)
Family households (%)
Nonfamily households (%)
Population in families (%)
Family households with own children (%)
Median number of bedrooms in owner occupied houses
Mean number of bedrooms in owner occupied houses
Median number of bedrooms in renter occupied houses
Mean number of bedrooms in renter occupied houses
Median number of vehichles in owner occupied houses
Mean number of vehichles in owner occupied houses
Median number of vehichles in renter occupied houses
Mean number of vehichles in renter occupied houses
Mortgage status - with mortgage (%)
Mortgage status - with second mortgage (%)
Mortgage status - with home equity loan (%)
Mortgage status - with both second mortgage and home equity loan (%)
Mortgage status - without a mortgage (%)
Average family size
Average family size - White
Average family size - Black or African American
Average family size - Asian
Average family size - Hispanic or Latino
Average family size - American Indian and Alaska Native
Average family size - Multirace
Average family size - Other Race
Geographical mobility - Same house 1 year ago (%)
Geographical mobility - Moved within same county (%)
Geographical mobility - Moved from different county within same state (%)
Geographical mobility - Moved from different state (%)
Geographical mobility - Moved from abroad (%)
Place of birth - Born in state of residence (%)
Place of birth - Born in other state (%)
Place of birth - Native, outside of US (%)
Place of birth - Foreign born (%)
Housing units in structures - 1, detached (%)
Housing units in structures - 1, attached (%)
Housing units in structures - 2 (%)
Housing units in structures - 3 or 4 (%)
Housing units in structures - 5 to 9 (%)
Housing units in structures - 10 to 19 (%)
Housing units in structures - 20 to 49 (%)
Housing units in structures - 50 or more (%)
Housing units in structures - Mobile home (%)
Housing units in structures - Boat, RV, van, etc. (%)
House/condo owner moved in on average (years ago)
Renter moved in on average (years ago)
Year householder moved into unit - Moved in 1999 to March 2000 (%)
Year householder moved into unit - Moved in 1995 to 1998 (%)
Year householder moved into unit - Moved in 1990 to 1994 (%)
Year householder moved into unit - Moved in 1980 to 1989 (%)
Year householder moved into unit - Moved in 1970 to 1979 (%)
Year householder moved into unit - Moved in 1969 or earlier (%)
Means of transportation to work - Drove car alone (%)
Means of transportation to work - Carpooled (%)
Means of transportation to work - Public transportation (%)
Means of transportation to work - Bus or trolley bus (%)
Means of transportation to work - Streetcar or trolley car (%)
Means of transportation to work - Subway or elevated (%)
Means of transportation to work - Railroad (%)
Means of transportation to work - Ferryboat (%)
Means of transportation to work - Taxicab (%)
Means of transportation to work - Motorcycle (%)
Means of transportation to work - Bicycle (%)
Means of transportation to work - Walked (%)
Means of transportation to work - Other means (%)
Working at home (%)
Industry diversity
Most Common Industries - Agriculture, forestry, fishing and hunting, and mining (%)
Most Common Industries - Agriculture, forestry, fishing and hunting (%)
Most Common Industries - Mining, quarrying, and oil and gas extraction (%)
Most Common Industries - Construction (%)
Most Common Industries - Manufacturing (%)
Most Common Industries - Wholesale trade (%)
Most Common Industries - Retail trade (%)
Most Common Industries - Transportation and warehousing, and utilities (%)
Most Common Industries - Transportation and warehousing (%)
Most Common Industries - Utilities (%)
Most Common Industries - Information (%)
Most Common Industries - Finance and insurance, and real estate and rental and leasing (%)
Most Common Industries - Finance and insurance (%)
Most Common Industries - Real estate and rental and leasing (%)
Most Common Industries - Professional, scientific, and management, and administrative and waste management services (%)
Most Common Industries - Professional, scientific, and technical services (%)
Most Common Industries - Management of companies and enterprises (%)
Most Common Industries - Administrative and support and waste management services (%)
Most Common Industries - Educational services, and health care and social assistance (%)
Most Common Industries - Educational services (%)
Most Common Industries - Health care and social assistance (%)
Most Common Industries - Arts, entertainment, and recreation, and accommodation and food services (%)
Most Common Industries - Arts, entertainment, and recreation (%)
Most Common Industries - Accommodation and food services (%)
Most Common Industries - Other services, except public administration (%)
Most Common Industries - Public administration (%)
Occupation diversity
Most Common Occupations - Management, business, science, and arts occupations (%)
Most Common Occupations - Management, business, and financial occupations (%)
Most Common Occupations - Management occupations (%)
Most Common Occupations - Business and financial operations occupations (%)
Most Common Occupations - Computer, engineering, and science occupations (%)
Most Common Occupations - Computer and mathematical occupations (%)
Most Common Occupations - Architecture and engineering occupations (%)
Most Common Occupations - Life, physical, and social science occupations (%)
Most Common Occupations - Education, legal, community service, arts, and media occupations (%)
Most Common Occupations - Community and social service occupations (%)
Most Common Occupations - Legal occupations (%)
Most Common Occupations - Education, training, and library occupations (%)
Most Common Occupations - Arts, design, entertainment, sports, and media occupations (%)
Most Common Occupations - Healthcare practitioners and technical occupations (%)
Most Common Occupations - Health diagnosing and treating practitioners and other technical occupations (%)
Most Common Occupations - Health technologists and technicians (%)
Most Common Occupations - Service occupations (%)
Most Common Occupations - Healthcare support occupations (%)
Most Common Occupations - Protective service occupations (%)
Most Common Occupations - Fire fighting and prevention, and other protective service workers including supervisors (%)
Most Common Occupations - Law enforcement workers including supervisors (%)
Most Common Occupations - Food preparation and serving related occupations (%)
Most Common Occupations - Building and grounds cleaning and maintenance occupations (%)
Most Common Occupations - Personal care and service occupations (%)
Most Common Occupations - Sales and office occupations (%)
Most Common Occupations - Sales and related occupations (%)
Most Common Occupations - Office and administrative support occupations (%)
Most Common Occupations - Natural resources, construction, and maintenance occupations (%)
Most Common Occupations - Farming, fishing, and forestry occupations (%)
Most Common Occupations - Construction and extraction occupations (%)
Most Common Occupations - Installation, maintenance, and repair occupations (%)
Most Common Occupations - Production, transportation, and material moving occupations (%)
Most Common Occupations - Production occupations (%)
Most Common Occupations - Transportation occupations (%)
Most Common Occupations - Material moving occupations (%)
People in Group quarters - Institutionalized population (%)
People in Group quarters - Correctional institutions (%)
People in Group quarters - Federal prisons and detention centers (%)
People in Group quarters - Halfway houses (%)
People in Group quarters - Local jails and other confinement facilities (including police lockups) (%)
People in Group quarters - Military disciplinary barracks (%)
People in Group quarters - State prisons (%)
People in Group quarters - Other types of correctional institutions (%)
People in Group quarters - Nursing homes (%)
People in Group quarters - Hospitals/wards, hospices, and schools for the handicapped (%)
People in Group quarters - Hospitals/wards and hospices for chronically ill (%)
People in Group quarters - Hospices or homes for chronically ill (%)
People in Group quarters - Military hospitals or wards for chronically ill (%)
People in Group quarters - Other hospitals or wards for chronically ill (%)
People in Group quarters - Hospitals or wards for drug/alcohol abuse (%)
People in Group quarters - Mental (Psychiatric) hospitals or wards (%)
People in Group quarters - Schools, hospitals, or wards for the mentally retarded (%)
People in Group quarters - Schools, hospitals, or wards for the physically handicapped (%)
People in Group quarters - Institutions for the deaf (%)
People in Group quarters - Institutions for the blind (%)
People in Group quarters - Orthopedic wards and institutions for the physically handicapped (%)
People in Group quarters - Wards in general hospitals for patients who have no usual home elsewhere (%)
People in Group quarters - Wards in military hospitals for patients who have no usual home elsewhere (%)
People in Group quarters - Juvenile institutions (%)
People in Group quarters - Long-term care (%)
People in Group quarters - Homes for abused, dependent, and neglected children (%)
People in Group quarters - Residential treatment centers for emotionally disturbed children (%)
People in Group quarters - Training schools for juvenile delinquents (%)
People in Group quarters - Short-term care, detention or diagnostic centers for delinquent children (%)
People in Group quarters - Type of juvenile institution unknown (%)
People in Group quarters - Noninstitutionalized population (%)
People in Group quarters - College dormitories (includes college quarters off campus) (%)
People in Group quarters - Military quarters (%)
People in Group quarters - On base (%)
People in Group quarters - Barracks, unaccompanied personnel housing (UPH), (Enlisted/Officer), ;and similar group living quarters for military personnel (%)
People in Group quarters - Transient quarters for temporary residents (%)
People in Group quarters - Military ships (%)
People in Group quarters - Group homes (%)
People in Group quarters - Homes or halfway houses for drug/alcohol abuse (%)
People in Group quarters - Homes for the mentally ill (%)
People in Group quarters - Homes for the mentally retarded (%)
People in Group quarters - Homes for the physically handicapped (%)
People in Group quarters - Other group homes (%)
People in Group quarters - Religious group quarters (%)
People in Group quarters - Dormitories (%)
People in Group quarters - Agriculture workers' dormitories on farms (%)
People in Group quarters - Job Corps and vocational training facilities (%)
People in Group quarters - Other workers' dormitories (%)
People in Group quarters - Crews of maritime vessels (%)
People in Group quarters - Other nonhousehold living situations (%)
People in Group quarters - Other noninstitutional group quarters (%)
Residents speaking English at home (%)
Residents speaking English at home - Born in the United States (%)
Residents speaking English at home - Native, born elsewhere (%)
Residents speaking English at home - Foreign born (%)
Residents speaking Spanish at home (%)
Residents speaking Spanish at home - Born in the United States (%)
Residents speaking Spanish at home - Native, born elsewhere (%)
Residents speaking Spanish at home - Foreign born (%)
Residents speaking other language at home (%)
Residents speaking other language at home - Born in the United States (%)
Residents speaking other language at home - Native, born elsewhere (%)
Residents speaking other language at home - Foreign born (%)
Class of Workers - Employee of private company (%)
Class of Workers - Self-employed in own incorporated business (%)
Class of Workers - Private not-for-profit wage and salary workers (%)
Class of Workers - Local government workers (%)
Class of Workers - State government workers (%)
Class of Workers - Federal government workers (%)
Class of Workers - Self-employed workers in own not incorporated business and Unpaid family workers (%)
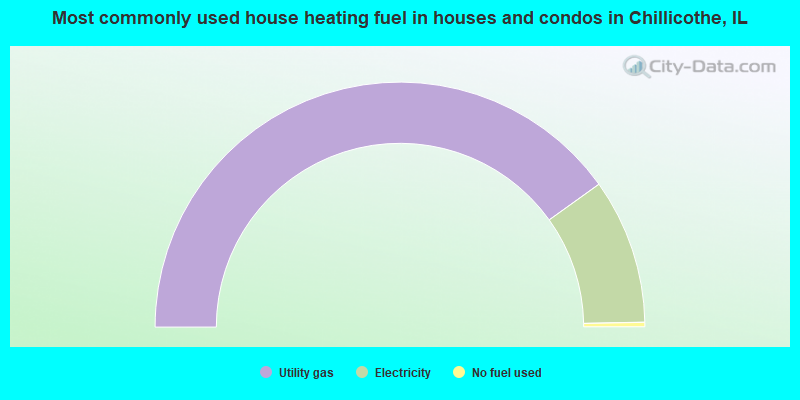
House heating fuel used in houses and condos - Utility gas (%)
House heating fuel used in houses and condos - Bottled, tank, or LP gas (%)
House heating fuel used in houses and condos - Electricity (%)
House heating fuel used in houses and condos - Fuel oil, kerosene, etc. (%)
House heating fuel used in houses and condos - Coal or coke (%)
House heating fuel used in houses and condos - Wood (%)
House heating fuel used in houses and condos - Solar energy (%)
House heating fuel used in houses and condos - Other fuel (%)
House heating fuel used in houses and condos - No fuel used (%)
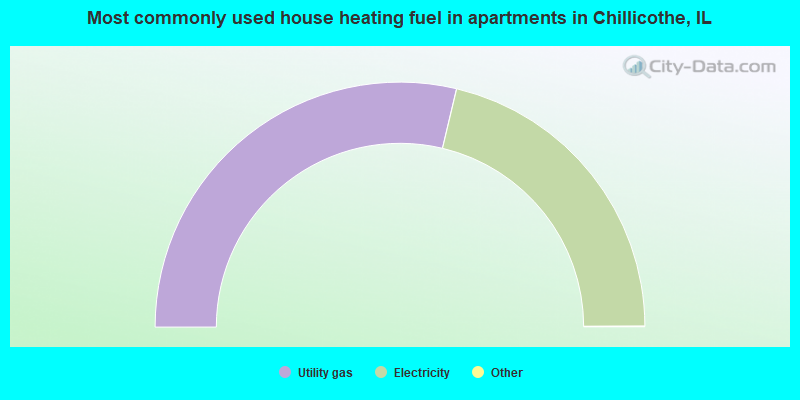
House heating fuel used in apartments - Utility gas (%)
House heating fuel used in apartments - Bottled, tank, or LP gas (%)
House heating fuel used in apartments - Electricity (%)
House heating fuel used in apartments - Fuel oil, kerosene, etc. (%)
House heating fuel used in apartments - Coal or coke (%)
House heating fuel used in apartments - Wood (%)
House heating fuel used in apartments - Solar energy (%)
House heating fuel used in apartments - Other fuel (%)
House heating fuel used in apartments - No fuel used (%)
Armed forces status - In Armed Forces (%)
Armed forces status - Civilian (%)
Armed forces status - Civilian - Veteran (%)
Armed forces status - Civilian - Nonveteran (%)
Fatal accidents locations in years 2005-2021
Fatal accidents locations in 2005
Fatal accidents locations in 2006
Fatal accidents locations in 2007
Fatal accidents locations in 2008
Fatal accidents locations in 2009
Fatal accidents locations in 2010
Fatal accidents locations in 2011
Fatal accidents locations in 2012
Fatal accidents locations in 2013
Fatal accidents locations in 2014
Fatal accidents locations in 2015
Fatal accidents locations in 2016
Fatal accidents locations in 2017
Fatal accidents locations in 2018
Fatal accidents locations in 2019
Fatal accidents locations in 2020
Fatal accidents locations in 2021
Alcohol use - People drinking some alcohol every month (%)
Alcohol use - People not drinking at all (%)
Alcohol use - Average days/month drinking alcohol
Alcohol use - Average drinks/week
Alcohol use - Average days/year people drink much
Audiometry - Average condition of hearing (%)
Audiometry - People that can hear a whisper from across a quiet room (%)
Audiometry - People that can hear normal voice from across a quiet room (%)
Audiometry - Ears ringing, roaring, buzzing (%)
Audiometry - Had a job exposure to loud noise (%)
Audiometry - Had off-work exposure to loud noise (%)
Blood Pressure & Cholesterol - Has high blood pressure (%)
Blood Pressure & Cholesterol - Checking blood pressure at home (%)
Blood Pressure & Cholesterol - Frequently checking blood cholesterol (%)
Blood Pressure & Cholesterol - Has high cholesterol level (%)
Consumer Behavior - Money monthly spent on food at supermarket/grocery store
Consumer Behavior - Money monthly spent on food at other stores
Consumer Behavior - Money monthly spent on eating out
Consumer Behavior - Money monthly spent on carryout/delivered foods
Consumer Behavior - Income spent on food at supermarket/grocery store (%)
Consumer Behavior - Income spent on food at other stores (%)
Consumer Behavior - Income spent on eating out (%)
Consumer Behavior - Income spent on carryout/delivered foods (%)
Current Health Status - General health condition (%)
Current Health Status - Blood donors (%)
Current Health Status - Has blood ever tested for HIV virus (%)
Current Health Status - Left-handed people (%)
Dermatology - People using sunscreen (%)
Diabetes - Diabetics (%)
Diabetes - Had a blood test for high blood sugar (%)
Diabetes - People taking insulin (%)
Diet Behavior & Nutrition - Diet health (%)
Diet Behavior & Nutrition - Milk product consumption (# of products/month)
Diet Behavior & Nutrition - Meals not home prepared (#/week)
Diet Behavior & Nutrition - Meals from fast food or pizza place (#/week)
Diet Behavior & Nutrition - Ready-to-eat foods (#/month)
Diet Behavior & Nutrition - Frozen meals/pizza (#/month)
Drug Use - People that ever used marijuana or hashish (%)
Drug Use - Ever used hard drugs (%)
Drug Use - Ever used any form of cocaine (%)
Drug Use - Ever used heroin (%)
Drug Use - Ever used methamphetamine (%)
Health Insurance - People covered by health insurance (%)
Kidney Conditions-Urology - Avg. # of times urinating at night
Medical Conditions - People with asthma (%)
Medical Conditions - People with anemia (%)
Medical Conditions - People with psoriasis (%)
Medical Conditions - People with overweight (%)
Medical Conditions - Elderly people having difficulties in thinking or remembering (%)
Medical Conditions - People who ever received blood transfusion (%)
Medical Conditions - People having trouble seeing even with glass/contacts (%)
Medical Conditions - People with arthritis (%)
Medical Conditions - People with gout (%)
Medical Conditions - People with congestive heart failure (%)
Medical Conditions - People with coronary heart disease (%)
Medical Conditions - People with angina pectoris (%)
Medical Conditions - People who ever had heart attack (%)
Medical Conditions - People who ever had stroke (%)
Medical Conditions - People with emphysema (%)
Medical Conditions - People with thyroid problem (%)
Medical Conditions - People with chronic bronchitis (%)
Medical Conditions - People with any liver condition (%)
Medical Conditions - People who ever had cancer or malignancy (%)
Mental Health - People who have little interest in doing things (%)
Mental Health - People feeling down, depressed, or hopeless (%)
Mental Health - People who have trouble sleeping or sleeping too much (%)
Mental Health - People feeling tired or having little energy (%)
Mental Health - People with poor appetite or overeating (%)
Mental Health - People feeling bad about themself (%)
Mental Health - People who have trouble concentrating on things (%)
Mental Health - People moving or speaking slowly or too fast (%)
Mental Health - People having thoughts they would be better off dead (%)
Oral Health - Average years since last visit a dentist
Oral Health - People embarrassed because of mouth (%)
Oral Health - People with gum disease (%)
Oral Health - General health of teeth and gums (%)
Oral Health - Average days a week using dental floss/device
Oral Health - Average days a week using mouthwash for dental problem
Oral Health - Average number of teeth
Pesticide Use - Households using pesticides to control insects (%)
Pesticide Use - Households using pesticides to kill weeds (%)
Physical Activity - People doing vigorous-intensity work activities (%)
Physical Activity - People doing moderate-intensity work activities (%)
Physical Activity - People walking or bicycling (%)
Physical Activity - People doing vigorous-intensity recreational activities (%)
Physical Activity - People doing moderate-intensity recreational activities (%)
Physical Activity - Average hours a day doing sedentary activities
Physical Activity - Average hours a day watching TV or videos
Physical Activity - Average hours a day using computer
Physical Functioning - People having limitations keeping them from working (%)
Physical Functioning - People limited in amount of work they can do (%)
Physical Functioning - People that need special equipment to walk (%)
Physical Functioning - People experiencing confusion/memory problems (%)
Physical Functioning - People requiring special healthcare equipment (%)
Prescription Medications - Average number of prescription medicines taking
Preventive Aspirin Use - Adults 40+ taking low-dose aspirin (%)
Reproductive Health - Vaginal deliveries (%)
Reproductive Health - Cesarean deliveries (%)
Reproductive Health - Deliveries resulted in a live birth (%)
Reproductive Health - Pregnancies resulted in a delivery (%)
Reproductive Health - Women breastfeeding newborns (%)
Reproductive Health - Women that had a hysterectomy (%)
Reproductive Health - Women that had both ovaries removed (%)
Reproductive Health - Women that have ever taken birth control pills (%)
Reproductive Health - Women taking birth control pills (%)
Reproductive Health - Women that have ever used Depo-Provera or injectables (%)
Reproductive Health - Women that have ever used female hormones (%)
Sexual Behavior - People 18+ that ever had sex (vaginal, anal, or oral) (%)
Sexual Behavior - Males 18+ that ever had vaginal sex with a woman (%)
Sexual Behavior - Males 18+ that ever performed oral sex on a woman (%)
Sexual Behavior - Males 18+ that ever had anal sex with a woman (%)
Sexual Behavior - Males 18+ that ever had any sex with a man (%)
Sexual Behavior - Females 18+ that ever had vaginal sex with a man (%)
Sexual Behavior - Females 18+ that ever performed oral sex on a man (%)
Sexual Behavior - Females 18+ that ever had anal sex with a man (%)
Sexual Behavior - Females 18+ that ever had any kind of sex with a woman (%)
Sexual Behavior - Average age people first had sex
Sexual Behavior - Average number of female sex partners in lifetime (males 18+)
Sexual Behavior - Average number of female vaginal sex partners in lifetime (males 18+)
Sexual Behavior - Average age people first performed oral sex on a woman (18+)
Sexual Behavior - Average number of woman performed oral sex on in lifetime (18+)
Sexual Behavior - Average number of male sex partners in lifetime (males 18+)
Sexual Behavior - Average number of male anal sex partners in lifetime (males 18+)
Sexual Behavior - Average age people first performed oral sex on a man (18+)
Sexual Behavior - Average number of male oral sex partners in lifetime (18+)
Sexual Behavior - People using protection when performing oral sex (%)
Sexual Behavior - Average number of times people have vaginal or anal sex a year
Sexual Behavior - People having sex without condom (%)
Sexual Behavior - Average number of male sex partners in lifetime (females 18+)
Sexual Behavior - Average number of male vaginal sex partners in lifetime (females 18+)
Sexual Behavior - Average number of female sex partners in lifetime (females 18+)
Sexual Behavior - Circumcised males 18+ (%)
Sleep Disorders - Average hours sleeping at night
Sleep Disorders - People that has trouble sleeping (%)
Smoking-Cigarette Use - People smoking cigarettes (%)
Taste & Smell - People 40+ having problems with smell (%)
Taste & Smell - People 40+ having problems with taste (%)
Taste & Smell - People 40+ that ever had wisdom teeth removed (%)
Taste & Smell - People 40+ that ever had tonsils teeth removed (%)
Taste & Smell - People 40+ that ever had a loss of consciousness because of a head injury (%)
Taste & Smell - People 40+ that ever had a broken nose or other serious injury to face or skull (%)
Taste & Smell - People 40+ that ever had two or more sinus infections (%)
Weight - Average height (inches)
Weight - Average weight (pounds)
Weight - Average BMI
Weight - People that are obese (%)
Weight - People that ever were obese (%)
Weight - People trying to lose weight (%)
Officers per 1,000 residents here:
2.00Illinois average:
3.04
Latest news from Chillicothe, IL collected exclusively by city-data.com from local newspapers, TV, and radio stations
Ancestries: German (20.2%), English (13.6%), American (11.5%), European (4.7%), Irish (4.4%), Norwegian (2.1%).
Current Local Time:
Incorporated on 06/23/1873
Land area: 4.94 square miles.
Population density: 1,216 people per square mile (low).
144 residents are foreign born (1.3% North America , 0.5% Europe , 0.5% Asia ).
This city:
2.4%Illinois:
14.1%
Median real estate property taxes paid for housing units with mortgages in 2022: $2,728 (2.0%)Median real estate property taxes paid for housing units with no mortgage in 2022: $3,301 (2.4%)
Nearest city with pop. 50,000+: Peoria, IL
Nearest city with pop. 200,000+: Chicago, IL
Nearest cities:
Latitude: 40.92 N, Longitude: 89.49 W
Daytime population change due to commuting: -892 (-14.8%)Workers who live and work in this city: 500 (20.2%)
Single-family new house construction building permits:
2022: 5 buildings , average cost: $254,0002021: 1 building , cost: $399,0002020: 1 building , cost: $237,7002019: 2 buildings , average cost: $165,0002017: 5 buildings , average cost: $255,4002016: 8 buildings , average cost: $262,2002015: 14 buildings , average cost: $264,6002014: 12 buildings , average cost: $258,8002013: 8 buildings , average cost: $269,1002012: 14 buildings , average cost: $270,7002011: 3 buildings , average cost: $282,3002010: 20 buildings , average cost: $228,5002009: 13 buildings , average cost: $268,9002008: 25 buildings , average cost: $201,4002007: 29 buildings , average cost: $193,0002006: 25 buildings , average cost: $176,5002005: 29 buildings , average cost: $153,4002004: 12 buildings , average cost: $165,6002003: 14 buildings , average cost: $146,4002002: 6 buildings , average cost: $155,4002001: 14 buildings , average cost: $117,3002000: 3 buildings , average cost: $156,4001999: 21 buildings , average cost: $138,4001998: 15 buildings , average cost: $145,7001997: 8 buildings , average cost: $125,400Unemployment in December 2023:
Most common occupations in Chillicothe, IL (%)
Both Males Females
Other office and administrative support workers, including supervisors (6.3%)
Other sales and related occupations, including supervisors (4.7%)
Electrical equipment mechanics and other installation, maintenance, and repair workers, including supervisors (4.1%)
Other production occupations, including supervisors (4.1%)
Engineers (3.5%)
Building and grounds cleaning and maintenance occupations (3.5%)
Material recording, scheduling, dispatching, and distributing workers (3.4%)
Electrical equipment mechanics and other installation, maintenance, and repair workers, including supervisors (7.9%)
Engineers (6.6%)
Other production occupations, including supervisors (6.5%)
Metal workers and plastic workers (5.7%)
Building and grounds cleaning and maintenance occupations (4.9%)
Material recording, scheduling, dispatching, and distributing workers (4.3%)
Driver/sales workers and truck drivers (3.9%)
Other office and administrative support workers, including supervisors (11.5%)
Secretaries and administrative assistants (6.7%)
Other sales and related occupations, including supervisors (6.4%)
Health technologists and technicians (5.8%)
Other food preparation and serving workers, including supervisors (4.6%)
Registered nurses (4.3%)
Cashiers (3.8%)
Tornado activity:
Chillicothe-area historical tornado activity is near Illinois state average. It is 80% greater than the overall U.S. average.
On 6/29/1976, a category F4 (max. wind speeds 207-260 mph) tornado 10.3 miles away from the Chillicothe city center caused between $50,000 and $500,000 in damages.
On 7/13/2004, a category F4 tornado 11.9 miles away from the city center injured 3 people .
Earthquake activity:
Chillicothe-area historical earthquake activity is significantly above Illinois state average. It is 119% greater than the overall U.S. average. On 4/18/2008 at 09:36:59, a magnitude 5.4 (5.1 MB, 4.8 MS, 5.4 MW, 5.2 MW, Class: Moderate, Intensity: VI - VII) earthquake occurred 190.9 miles away from Chillicothe center On 6/10/1987 at 23:48:54, a magnitude 5.1 (4.9 MB, 4.4 MS, 4.6 MS, 5.1 LG) earthquake occurred 168.4 miles away from the city center On 4/18/2008 at 09:36:59, a magnitude 5.2 (5.2 MW, Depth: 8.9 mi) earthquake occurred 190.9 miles away from the city center On 6/28/2004 at 06:10:52, a magnitude 4.2 (4.2 MW, Depth: 6.2 mi, Class: Light, Intensity: IV - V) earthquake occurred 48.5 miles away from Chillicothe center On 6/18/2002 at 17:37:15, a magnitude 5.0 (4.3 MB, 4.6 MW, 5.0 LG) earthquake occurred 222.5 miles away from Chillicothe center On 4/18/2008 at 15:14:16, a magnitude 4.8 (4.5 MB, 4.8 MW, 4.6 MW) earthquake occurred 190.4 miles away from the city center Magnitude types: regional Lg-wave magnitude (LG), body-wave magnitude (MB), surface-wave magnitude (MS), moment magnitude (MW) Natural disasters: The number of natural disasters in Peoria County (14) is near the US average (15).Major Disasters (Presidential) Declared: 8Emergencies Declared: 5Storms: 8, Floods: 7, Snows: 2, Snowstorms: 2, Winter Storms: 2, Blizzard: 1, Hurricane: 1, Tornado: 1, Wind: 1, Other: 1 (Note: some incidents may be assigned to more than one category). Hospitals and medical centers in Chillicothe: HERITAGE HEALTH-CHILLICOTHE (1028 HILLCREST DRIVE)
Other hospitals and medical centers near Chillicothe: ST JOSEPH NURSING HOME (Nursing Home, about 9 miles away; LACON, IL)
LUTHERAN HOME, THE (Nursing Home, about 12 miles away; PEORIA, IL)
ST. FRANCIS MEDICAL CENTER (Home Health Center, about 12 miles away; PEORIA, IL)
OSF HOSPICE (Hospital, about 12 miles away; PEORIA, IL)
SNYDER VILLAGE (Nursing Home, about 12 miles away; METAMORA, IL)
HOME BOUND HEALTHCARE, INC (Home Health Center, about 12 miles away; PEORIA, IL)
AFFILIATED HOME DIALYSIS, LLC (Dialysis Facility, about 12 miles away; EAST PEORIA, IL)
Colleges/universities with over 2000 students nearest to Chillicothe:
Illinois Central College (about 15 miles; East Peoria, IL ; Full-time enrollment: 7,158)
Bradley University (about 17 miles; Peoria, IL ; FT enrollment: 5,152)
Illinois Valley Community College (about 34 miles; Oglesby, IL ; FT enrollment: 2,747)
Heartland Community College (about 37 miles; Normal, IL ; FT enrollment: 3,958)
Illinois State University (about 39 miles; Normal, IL ; FT enrollment: 18,804)
Illinois Wesleyan University (about 40 miles; Bloomington, IL ; FT enrollment: 2,323)
Black Hawk College (about 63 miles; Moline, IL ; FT enrollment: 5,086)
Public high school in Chillicothe:
Private high school in Chillicothe: CALVARY BAPTIST ACADEMY Students: 70, Location: 1028 W CLOVERDALE RD, Grades: PK-12)
Public elementary/middle schools in Chillicothe: CHILLICOTHE ELEMENTARY CENTER Students: 476, Location: 914 W TRUITT AVE, Grades: 4-5)SOUTH ELEMENTARY SCHOOL Location: 616 W HICKORY ST, Grades: PK-3)
CHILLICOTHE JR HIGH Location: 914 W TRUITT AVE, Grades: 6-8)
Private elementary/middle school in Chillicothe: ST EDWARD SCHOOL Students: 129, Location: 1221 N 5TH ST, Grades: PK-8)
See full list of schools located in Chillicothe Library in Chillicothe: CHILLICOTHE PUBLIC LIBRARY DISTRICT Operating income: $710,863; Location: 430 NORTH BRADLEY AVENUE; 38,394 books ; 2,649 audio materials ; 1,076 video materials ; 1 local licensed databases ; 17 state licensed databases ; 1 other licensed databases ; 51 print serial subscriptions )
User-submitted facts and corrections:
The George Zeller Mental Health Center in Peoria is now the Illinois Central College North Campus. added by Jeff
Notable locations in Chillicothe: (A) , Chillicothe Community Fire Department Station 2 (B) , Chillicothe Police Station (C) , Peace Community Center (D) , Chillicothe Community Fire Department Station 1 (E) , Chillicothe Public Library (F) , Ambulance Rescue 33 (G) . Display/hide their locations on the map
Churches in Chillicothe include: (A) , Chillicothe Bible Church (B) , Chillicothe Christian Church (C) , First Baptist Church (D) , First United Methodist Church (E) , Our Saviors Lutheran Church (F) , Plymouth Congregational Church (G) , Saint Edwards Catholic Church (H) , Saint Francis Episcopal Church (I) . Display/hide their locations on the map
Cemetery: (1) . Display/hide its location on the map
Park in Chillicothe: (1) . Display/hide its location on the map
Tourist attraction:
Hotel:
Birthplace of: Zach McAllister - Baseball player.
Peoria County has a predicted average indoor radon screening level greater than 4 pCi/L (pico curies per liter) - Highest Potential Drinking water stations with addresses in Chillicothe and their reported violations in the past:
CHILLICOTHE (Population served: 5,996, Groundwater):
Past health violations:
MCL, Monthly (TCR) - In OCT-2005, Contaminant: Coliform. Follow-up actions: St Public Notif requested (NOV-29-2005), St Violation/Reminder Notice (NOV-29-2005), St Public Notif received (DEC-01-2005), St Compliance achieved (MAY-01-2006)
Population served: 50, Groundwater):
Past health violations:
MCL, Single Sample - Between JAN-2011 and MAR-2011, Contaminant: Nitrate. Follow-up actions: St Compliance achieved (APR-28-2011)
MCL, Single Sample - Between APR-2010 and JUN-2010, Contaminant: Nitrate. Follow-up actions: St Compliance achieved (DEC-30-2010)
MCL, Single Sample - Between APR-2009 and JUN-2009, Contaminant: Nitrate. Follow-up actions: St Violation/Reminder Notice (JUN-08-2010), St Compliance achieved (DEC-30-2010)
Past monitoring violations:
3 regular monitoring violations
Population served: 45, Groundwater):
Past monitoring violations:
Monitoring and Reporting (DBP) - Between APR-2007 and JUN-2007, Contaminant: Chlorine. Follow-up actions: St Violation/Reminder Notice (MAY-16-2007), St Compliance achieved (MAY-21-2007)
Average household size: This city:
2.4 peopleIllinois:
2.6 people
Percentage of family households: This city:
64.6%Whole state:
65.8%
Percentage of households with unmarried partners: This city:
6.9%Whole state:
6.3%
Likely homosexual households (counted as self-reported same-sex unmarried-partner households)
Lesbian couples: 0.4% of all households Gay men: 0.0% of all households
95 people in nursing facilities/skilled-nursing facilities in 2010People in group quarters in Chillicothe in 2000:
83 people in nursing homes
15 people in homes for the mentally retarded
10 people in other noninstitutional group quarters
Banks with branches in Chillicothe (2011 data):
First National Bank of Chillicothe: First National Bank Of Chillicothe at 900 North Fourth Street, branch established on 1934/01/01. Info updated 2006/11/03: Bank assets: $68.7 mil, Deposits: $61.5 mil, local headquarters , positive income , Mortgage Lending Specialization, 1 total offices , Holding Company: First Chillicothe Corp.
Associated Bank, National Association: Chillicothe Branch at 1007 North 4th Street, branch established on 1933/03/01. Info updated 2008/09/12: Bank assets: $21,715.0 mil, Deposits: $15,244.4 mil, headquarters in Green Bay, WI, positive income , Commercial Lending Specialization, 282 total offices , Holding Company: Associated Banc-Corp
South Side Trust & Savings Bank of Peoria: 917 North Fourth Street Branch at 917 North Fourth Street, branch established on 1888/01/01. Info updated 2006/11/03: Bank assets: $668.3 mil, Deposits: $535.4 mil, headquarters in Peoria, IL, positive income , 14 total offices , Holding Company: Mid Illinois Bancorp, Inc.
Commerce Bank: Chillicothe Branch at 1057 N 2nd St, branch established on 1971/02/15. Info updated 2011/07/07: Bank assets: $20,493.6 mil, Deposits: $16,805.3 mil, headquarters in Kansas City, MO, positive income , 206 total offices , Holding Company: Commerce Bancshares, Inc.
For population 15 years and over in Chillicothe:
Never married: 20.8%Now married: 47.0%Separated: 1.1%Widowed: 11.5%Divorced: 19.6% For population 25 years and over in Chillicothe:
High school or higher: 97.2%Bachelor's degree or higher: 26.8%Graduate or professional degree: 7.2%Unemployed: 5.1%Mean travel time to work (commute): 17.7 minutes
Education Gini index (Inequality in education) Here:
8.4Illinois average:
12.5
Religion statistics for Chillicothe, IL (based on Peoria County data)
Religion Adherents Congregations Evangelical Protestant 30,685 123 Catholic 26,165 20 Other 22,276 16 Mainline Protestant 18,343 56 Black Protestant 3,482 15 Orthodox 396 2 None 85,147 -
Source: Clifford Grammich, Kirk Hadaway, Richard Houseal, Dale E.Jones, Alexei Krindatch, Richie Stanley and Richard H.Taylor. 2012. 2010 U.S.Religion Census: Religious Congregations & Membership Study. Association of Statisticians of American Religious Bodies. Jones, Dale E., et al. 2002. Congregations and Membership in the United States 2000. Nashville, TN: Glenmary Research Center. Graphs represent county-level data
Food Environment Statistics: Number of grocery stores : 36Peoria County :
1.97 / 10,000 pop.Illinois :
2.24 / 10,000 pop.
Number of supercenters and club stores : 2Peoria County :
0.11 / 10,000 pop.Illinois :
0.08 / 10,000 pop.
Number of convenience stores (no gas) : 8This county :
0.44 / 10,000 pop.State :
0.75 / 10,000 pop.
Number of convenience stores (with gas) : 61Peoria County :
3.33 / 10,000 pop.State :
2.61 / 10,000 pop.
Number of full-service restaurants : 159Peoria County :
8.69 / 10,000 pop.Illinois :
6.86 / 10,000 pop.
Adult diabetes rate : Peoria County :
9.4%Illinois :
8.3%
Adult obesity rate : Peoria County :
28.2%Illinois :
25.2%
Low-income preschool obesity rate : Peoria County :
13.9%Illinois :
14.5%
Health and Nutrition: Healthy diet rate : This city:
48.5%State:
49.5%
Average overall health of teeth and gums : This city:
43.5%Illinois:
47.2%
Average BMI : Chillicothe:
29.3Illinois:
28.6
People feeling badly about themselves : This city:
23.0%Illinois:
20.5%
People not drinking alcohol at all : This city:
13.6%State:
10.8%
Average hours sleeping at night : Overweight people : Chillicothe:
35.9%Illinois:
33.4%
General health condition : Chillicothe:
54.1%Illinois:
56.4%
Average condition of hearing : This city:
76.0%Illinois:
79.9%
More about Health and Nutrition of Chillicothe, IL Residents
Local government employment and payroll (March 2022)
Function
Full-time employees
Monthly full-time payroll
Average yearly full-time wage
Part-time employees
Monthly part-time payroll
Police Protection - Officers
9 $51,788 $69,051 0 $0 Other and Unallocable
4 $16,198 $48,594 2 $1,869 Streets and Highways
3 $14,198 $56,792 0 $0 Water Supply
3 $14,384 $57,536 0 $0 Financial Administration
2 $11,463 $68,778 0 $0
Totals for Government
21 $108,031 $61,732 2 $1,869
Chillicothe government finances - Expenditure in 2017 (per resident):
Construction - Regular Highways: $371,000 ($61.78)
Current Operations - Police Protection: $1,298,000 ($216.15)
General - Other: $811,000 ($135.05)Water Utilities: $706,000 ($117.57)Regular Highways: $643,000 ($107.08)Financial Administration: $390,000 ($64.95)General Public Buildings: $161,000 ($26.81)Local Fire Protection: $74,000 ($12.32)Miscellaneous Commercial Activities - Other: $46,000 ($7.66)General - Interest on Debt: $49,000 ($8.16)
Other Capital Outlay - Central Staff Services: $605,000 ($100.75)
Water Utilities: $87,000 ($14.49)Parks and Recreation: $36,000 ($6.00)Police Protection: $31,000 ($5.16)Total Salaries and Wages: $1,695,000 ($282.26)
Chillicothe government finances - Revenue in 2017 (per resident):
Miscellaneous - General Revenue - Other: $514,000 ($85.60)
Fines and Forfeits: $106,000 ($17.65)Interest Earnings: $38,000 ($6.33)Revenue - Water Utilities: $885,000 ($147.38)
State Intergovernmental - General Local Government Support: $1,910,000 ($318.07)
Highways: $155,000 ($25.81)Tax - Property: $1,013,000 ($168.69)
Other License: $133,000 ($22.15)
Chillicothe government finances - Debt in 2017 (per resident):
Long Term Debt - Beginning Outstanding - Unspecified Public Purpose: $1,197,000 ($199.33)
Outstanding Unspecified Public Purpose: $1,097,000 ($182.68)Retired Unspecified Public Purpose: $100,000 ($16.65)
Chillicothe government finances - Cash and Securities in 2017 (per resident):
Other Funds - Cash and Securities: $7,038,000 ($1172.02)
Businesses in Chillicothe, IL
Name Count Name Count
Alco Stores 1 McDonald's 1 CVS 1 Pizza Hut 1 Chevrolet 1 Subway 1 Circle K 2 Super 8 1 Dairy Queen 1 Taco Bell 1 Goodwill 5 True Value 1 H&R Block 1 U-Haul 1 Hardee's 1 U.S. Cellular 1 Kroger 1 UPS 1
Strongest AM radio stations in Chillicothe:
WWFS (1290 AM; 5 kW; PEORIA, IL; Owner: MONTEREY LICENSES, LLC)
WVEL (1140 AM; daytime; 5 kW; PEKIN, IL)
WSCR (670 AM; 50 kW; CHICAGO, IL; Owner: INFINITY BROADCASTING OPERATIONS, INC.)
WMBD (1470 AM; 5 kW; PEORIA, IL; Owner: MONTEREY LICENSES, LLC)
WLS (890 AM; 50 kW; CHICAGO, IL; Owner: WLS, INC.)
WGN (720 AM; 50 kW; CHICAGO, IL; Owner: WGN CONTINENTAL BROADCASTING CO.)
WBBM (780 AM; 50 kW; CHICAGO, IL; Owner: INFINITY BROADCASTING OPERATIONS, INC.)
WYLL (1160 AM; 50 kW; CHICAGO, IL; Owner: SCA LICENSE CORPORATION)
WMVP (1000 AM; 50 kW; CHICAGO, IL; Owner: ABC, INC.)
WPEO (1020 AM; daytime; 1 kW; PEORIA, IL)
WTMJ (620 AM; 50 kW; MILWAUKEE, WI; Owner: JOURNAL BROADCAST CORPORATION)
KXEN (1010 AM; 50 kW; FESTUS-ST. LOUIS, MO; Owner: BDJ RADIO ENTERPRISES, LLC)
WISN (1130 AM; 50 kW; MILWAUKEE, WI; Owner: CAPSTAR TX LIMITED PARTNERSHIP)
Strongest FM radio stations in Chillicothe:
WPMJ (94.3 FM; CHILLICOTHE, IL; Owner: KELLY COMMUNICATIONS, INC.)
WIXO (99.9 FM; BARTONVILLE, IL; Owner: REGENT BROADCASTING OF PEORIA, INC.)
WSWT (106.9 FM; PEORIA, IL; Owner: MONTEREY LICENSES, LLC)
WCBU (89.9 FM; PEORIA, IL; Owner: BRADLEY UNIVERSITY)
WXMP (105.7 FM; PEORIA, IL; Owner: AAA ENTERTAINMENT LICENSING LLC)
WBNH (88.5 FM; PEKIN, IL; Owner: CENTRAL ILLINOIS RADIO FELLOWSHIP, INC.)
WRVY-FM (100.5 FM; HENRY, IL; Owner: WZOE, INC)
WPBG (93.3 FM; PEORIA, IL; Owner: MONTEREY LICENSES, LLC)
WGLO (95.5 FM; PEKIN, IL; Owner: REGENT BROADCASTING OF PEORIA, INC.)
WZPW (92.3 FM; PEORIA, IL; Owner: B&G BROADCASTING, INC.)
WFYR (97.3 FM; ELMWOOD, IL; Owner: REGENT BROADCASTING OF PEORIA, INC.)
WRVP (98.5 FM; EUREKA, IL; Owner: REGENT BROADCASTING OF PEORIA, INC.)
W278AE (103.5 FM; PEORIA, IL; Owner: ILLINOIS STATE UNIVERSITY)
WCIC (91.5 FM; PEKIN, IL; Owner: ILLINOIS BIBLE INSTITUTE, INC.)
WPPY (101.1 FM; GLASFORD, IL; Owner: REGENT BROADCASTING OF PEORIA, INC.)
WXCL (104.9 FM; PEKIN, IL; Owner: AAA ENTERTAINMENT LICENSING LLC)
WDQX (102.3 FM; MORTON, IL; Owner: AAA ENTERTAINMENT LICENSING LLC)
WBZG (100.9 FM; PERU, IL; Owner: MENDOTA BROADCASTING, INC)
WWCT (96.5 FM; FARMINGTON, IL; Owner: AAA ENTERTAINMENT LICENSING LLC)
TV broadcast stations around Chillicothe:
WAOE (Channel 59; PEORIA, IL; Owner: FOUR SEASONS PEORIA, LLC)
WYZZ-TV (Channel 43; BLOOMINGTON, IL; Owner: WYZZ LICENSEE, INC.)
WHOI (Channel 19; PEORIA, IL; Owner: CHELSEY BROADCASTING COMPANY OF PEORIA, LLC)
WWTO-TV (Channel 35; LASALLE, IL; Owner: TRINITY BROADCASTING NETWORK)
WEEK-TV (Channel 25; PEORIA, IL; Owner: WEEK-TV LICENSE, INC.)
WTVP (Channel 47; PEORIA, IL; Owner: ILLINOIS VALLEY PUB TELECOMM CORP)
WMBD-TV (Channel 31; PEORIA, IL; Owner: NEXSTAR BROADCASTING OF PEORIA, L.L.C.)
W67CW (Channel 67; PEORIA, IL; Owner: M.C. PRODUCTIONS)
National Bridge Inventory (NBI) Statistics 25 Number of bridges213ft / 64.5m Total length53,225 Total average daily traffic5,229 Total average daily truck traffic
New bridges - historical statistics
3 1900-1909 1 1930-1939 2 1950-1959 1 1960-1969 2 1970-1979 1 1980-1989 12 1990-1999 1 2000-2009 2 2010-2019
See full National Bridge Inventory statistics for Chillicothe, IL
FCC Registered Cell Phone Towers: 2 (
See the full list of FCC Registered Cell Phone Towers in Chillicothe )
FCC Registered Antenna Towers: 53 (
See the full list of FCC Registered Antenna Towers )
FCC Registered Broadcast Land Mobile Towers: 7
1831 N Santa Fe Ave (Lat: 40.929472 Lon: -89.495361), Call Sign: WNKY636, Licensee ID: L00258361, Assigned Frequencies: 935.887 MHz, 935.937 MHz, 935.987 MHz, 936.887 MHz, 936.937 MHz, 936.987 MHz, Grant Date: 02/11/1998, Expiration Date: 02/11/2003, Cancellation Date: 04/12/2001, Registrant: Association Of American Railroads, 55500 Dot Rd, Pueblo, CO 81001, Phone: (202) 639-2217 BNSF DEPOT, Bnsf Depot 1831 North Santa Fe Avenue (Lat: 40.929472 Lon: -89.495361), Type: Gtower, Structure height: 30 m, Overall height: 37 m, Call Sign: WPEG473, Assigned Frequencies: 160.560 MHz, 160.650 MHz, Grant Date: 01/05/2024, Expiration Date: 02/24/2034, Certifier: Robert C Leedham, Registrant: Bnsf Railway Co., 4515 Kansas Ave, Kansas City, KS 66106, Phone: (913) 551-4015, Email:
Lat: 40.836028 Lon: -89.564278, Call Sign: WPNW493, Assigned Frequencies: 452.512 MHz, 452.637 MHz, 452.762 MHz, 457.512 MHz, 457.762 MHz, Grant Date: 05/01/2014, Expiration Date: 07/16/2024, Certifier: Patrick Hatfield, Registrant: Supreme Radio Communications, Inc., 4017 N Prospect Road, Peoria Heights, IL 61616, Phone: (309) 682-0831, Email:
Pump House #5, N Side Of Chestnut St, Just E Of Rr Tracks (Lat: 40.918639 Lon: -89.485833), Type: Tower, Structure height: 3 m, Call Sign: WQFF500, Assigned Frequencies: 217.450 MHz, Grant Date: 06/30/2016, Expiration Date: 07/01/2026, Certifier: Thomas F Smaidris, Registrant: Data Flow Systems, Inc., 605 N John Rodes Blvd, Melbourne, FL 32934, Phone: (321) 259-5009, Fax: (321) 259-4006, Email:
Cloverdale Tower #3, 150m S Of Intersection Of N Leonard Dr & E Cloverdale Rd (Lat: 40.906250 Lon: -89.509250), Type: Tower, Structure height: 6.1 m, Call Sign: WQFH468, Assigned Frequencies: 217.450 MHz, Grant Date: 06/30/2016, Expiration Date: 07/15/2026, Certifier: Thomas F Smaidris, Registrant: Data Flow Systems, Inc., 605 N John Rodes Blvd, Melbourne, FL 32934, Phone: (321) 259-5009, Fax: (321) 259-4006, Email:
Lat: 40.849500 Lon: -89.548694, Call Sign: WQML402, Assigned Frequencies: 451.437 MHz, 451.487 MHz, 451.537 MHz, 452.487 MHz, 452.787 MHz, Grant Date: 09/13/2010, Expiration Date: 09/13/2020, Cancellation Date: 11/14/2020, Certifier: Jeff Roe, Registrant: Spectrum License Consultants Inc, 6713 Club Meadows Drive, Amarillo, TX 79124, Phone: (806) 352-4810, Fax: (806) 352-4830, Email:
Lat: 40.927528 Lon: -89.494250, Call Sign: WRMP669, Assigned Frequencies: 151.835 MHz, 151.895 MHz, Grant Date: 05/13/2021, Expiration Date: 05/13/2031, Certifier: Rebecca Hoffman, Registrant: Federal Licensing Inc, 1588 Fairfield Road, Gettysburg, PA 17325, Phone: (717) 334-9262, Fax: (717) 334-6440, Email:
FCC Registered Microwave Towers: 12 (
See the full list of FCC Registered Microwave Towers in this town )
FCC Registered Amateur Radio Licenses: 64 (
See the full list of FCC Registered Amateur Radio Licenses in Chillicothe )
FAA Registered Aircraft: 8 (
See the full list of FAA Registered Aircraft in Chillicothe )
Home Mortgage Disclosure Act Aggregated Statistics For Year 2009(Based on 2 partial tracts) A) FHA, FSA/RHS & VA B) Conventional C) Refinancings D) Home Improvement Loans E) Loans on Dwellings For 5+ Families F) Non-occupant Loans on G) Loans On Manufactured Number Average Value Number Average Value Number Average Value Number Average Value Number Average Value Number Average Value Number Average Value
LOANS ORIGINATED 23 $102,590 28 $134,856 129 $109,482 8 $82,424 2 $439,785 9 $97,044 0 $0 APPLICATIONS APPROVED, NOT ACCEPTED 2 $68,925 1 $63,620 3 $70,687 0 $0 0 $0 0 $0 0 $0 APPLICATIONS DENIED 3 $101,197 2 $76,175 21 $123,507 5 $20,984 0 $0 1 $48,000 1 $27,350 APPLICATIONS WITHDRAWN 3 $101,383 1 $47,440 18 $120,576 1 $5,580 0 $0 3 $46,880 0 $0 FILES CLOSED FOR INCOMPLETENESS 0 $0 0 $0 2 $142,865 0 $0 0 $0 0 $0 0 $0
Aggregated Statistics For Year 2008(Based on 2 partial tracts) A) FHA, FSA/RHS & VA B) Conventional C) Refinancings D) Home Improvement Loans E) Loans on Dwellings For 5+ Families F) Non-occupant Loans on G) Loans On Manufactured Number Average Value Number Average Value Number Average Value Number Average Value Number Average Value Number Average Value Number Average Value
LOANS ORIGINATED 30 $99,683 43 $122,568 73 $94,851 8 $49,424 2 $382,020 12 $95,522 0 $0 APPLICATIONS APPROVED, NOT ACCEPTED 0 $0 1 $89,280 7 $104,676 4 $54,415 0 $0 1 $73,110 0 $0 APPLICATIONS DENIED 2 $106,735 2 $93,060 24 $94,791 9 $73,450 1 $343,230 1 $112,450 1 $16,740 APPLICATIONS WITHDRAWN 3 $81,667 3 $157,100 10 $101,461 0 $0 0 $0 1 $121,660 0 $0 FILES CLOSED FOR INCOMPLETENESS 0 $0 0 $0 3 $117,940 0 $0 0 $0 0 $0 0 $0
Aggregated Statistics For Year 2007(Based on 2 partial tracts) A) FHA, FSA/RHS & VA B) Conventional C) Refinancings D) Home Improvement Loans E) Loans on Dwellings For 5+ Families F) Non-occupant Loans on G) Loans On Manufactured Number Average Value Number Average Value Number Average Value Number Average Value Number Average Value Number Average Value Number Average Value
LOANS ORIGINATED 15 $100,789 81 $104,144 64 $89,807 13 $44,022 1 $25,110 17 $86,238 0 $0 APPLICATIONS APPROVED, NOT ACCEPTED 0 $0 6 $88,457 14 $86,482 4 $65,715 0 $0 1 $75,340 0 $0 APPLICATIONS DENIED 2 $65,435 5 $98,726 39 $107,466 13 $27,496 0 $0 0 $0 1 $1,670 APPLICATIONS WITHDRAWN 0 $0 5 $95,824 15 $95,895 1 $39,340 0 $0 1 $131,710 0 $0 FILES CLOSED FOR INCOMPLETENESS 0 $0 1 $151,800 4 $65,085 0 $0 0 $0 0 $0 0 $0
Aggregated Statistics For Year 2006(Based on 2 partial tracts) A) FHA, FSA/RHS & VA B) Conventional C) Refinancings D) Home Improvement Loans E) Loans on Dwellings For 5+ Families F) Non-occupant Loans on Number Average Value Number Average Value Number Average Value Number Average Value Number Average Value Number Average Value
LOANS ORIGINATED 15 $92,437 72 $100,454 66 $79,270 28 $24,078 1 $160,730 11 $83,860 APPLICATIONS APPROVED, NOT ACCEPTED 1 $46,880 5 $78,688 8 $57,481 4 $13,325 0 $0 1 $99,060 APPLICATIONS DENIED 0 $0 9 $105,570 38 $89,350 20 $47,424 0 $0 1 $78,130 APPLICATIONS WITHDRAWN 0 $0 6 $93,990 22 $83,508 3 $62,413 0 $0 1 $107,150 FILES CLOSED FOR INCOMPLETENESS 0 $0 3 $83,527 5 $103,578 0 $0 0 $0 0 $0
Aggregated Statistics For Year 2005(Based on 2 partial tracts) A) FHA, FSA/RHS & VA B) Conventional C) Refinancings D) Home Improvement Loans E) Loans on Dwellings For 5+ Families F) Non-occupant Loans on Number Average Value Number Average Value Number Average Value Number Average Value Number Average Value Number Average Value
LOANS ORIGINATED 7 $95,910 70 $90,159 68 $82,662 13 $28,762 1 $178,590 14 $74,763 APPLICATIONS APPROVED, NOT ACCEPTED 0 $0 3 $48,367 10 $81,786 4 $35,298 0 $0 1 $10,600 APPLICATIONS DENIED 1 $121,670 8 $58,844 41 $82,588 12 $25,718 0 $0 2 $61,945 APPLICATIONS WITHDRAWN 2 $109,245 7 $76,539 21 $106,354 4 $86,920 0 $0 1 $48,550 FILES CLOSED FOR INCOMPLETENESS 0 $0 2 $141,755 5 $68,252 0 $0 0 $0 0 $0
Aggregated Statistics For Year 2004(Based on 2 partial tracts) A) FHA, FSA/RHS & VA B) Conventional C) Refinancings D) Home Improvement Loans F) Non-occupant Loans on G) Loans On Manufactured Number Average Value Number Average Value Number Average Value Number Average Value Number Average Value Number Average Value
LOANS ORIGINATED 8 $97,631 54 $94,451 75 $82,406 16 $19,725 19 $77,693 1 $8,370 APPLICATIONS APPROVED, NOT ACCEPTED 0 $0 3 $68,457 13 $86,759 2 $10,885 1 $72,550 0 $0 APPLICATIONS DENIED 0 $0 6 $76,458 47 $91,016 8 $30,869 4 $78,482 1 $9,490 APPLICATIONS WITHDRAWN 1 $38,510 3 $47,623 40 $88,547 2 $38,510 1 $221,570 0 $0 FILES CLOSED FOR INCOMPLETENESS 0 $0 1 $20,090 4 $90,895 0 $0 0 $0 0 $0
Aggregated Statistics For Year 2003(Based on 2 partial tracts) A) FHA, FSA/RHS & VA B) Conventional C) Refinancings D) Home Improvement Loans F) Non-occupant Loans on Number Average Value Number Average Value Number Average Value Number Average Value Number Average Value
LOANS ORIGINATED 16 $75,881 52 $87,818 204 $78,019 13 $10,582 8 $65,885 APPLICATIONS APPROVED, NOT ACCEPTED 1 $48,000 1 $53,850 16 $74,539 3 $33,483 0 $0 APPLICATIONS DENIED 1 $49,110 3 $39,810 56 $70,921 7 $9,169 1 $25,390 APPLICATIONS WITHDRAWN 1 $22,880 4 $77,575 34 $84,729 1 $8,370 1 $107,710 FILES CLOSED FOR INCOMPLETENESS 0 $0 1 $73,940 4 $71,505 0 $0 0 $0
Aggregated Statistics For Year 2002(Based on 2 partial tracts) A) FHA, FSA/RHS & VA B) Conventional C) Refinancings D) Home Improvement Loans E) Loans on Dwellings For 5+ Families F) Non-occupant Loans on Number Average Value Number Average Value Number Average Value Number Average Value Number Average Value Number Average Value
LOANS ORIGINATED 6 $59,297 47 $79,990 136 $75,954 12 $14,882 1 $257,840 7 $54,770 APPLICATIONS APPROVED, NOT ACCEPTED 2 $53,020 0 $0 6 $72,502 2 $10,045 0 $0 0 $0 APPLICATIONS DENIED 1 $98,230 9 $54,289 40 $66,090 8 $15,765 0 $0 1 $79,810 APPLICATIONS WITHDRAWN 0 $0 3 $43,903 22 $72,589 2 $3,070 0 $0 1 $25,110 FILES CLOSED FOR INCOMPLETENESS 0 $0 1 $30,140 4 $76,248 0 $0 0 $0 0 $0
Aggregated Statistics For Year 2001(Based on 2 partial tracts) A) FHA, FSA/RHS & VA B) Conventional C) Refinancings D) Home Improvement Loans E) Loans on Dwellings For 5+ Families F) Non-occupant Loans on Number Average Value Number Average Value Number Average Value Number Average Value Number Average Value Number Average Value
LOANS ORIGINATED 13 $67,183 55 $82,379 130 $72,742 20 $14,259 2 $180,265 7 $42,134 APPLICATIONS APPROVED, NOT ACCEPTED 1 $16,740 2 $57,620 13 $59,457 1 $26,230 0 $0 0 $0 APPLICATIONS DENIED 1 $40,180 3 $54,130 38 $59,964 15 $9,543 0 $0 2 $21,210 APPLICATIONS WITHDRAWN 1 $27,350 7 $65,137 29 $69,212 2 $15,345 0 $0 1 $30,130 FILES CLOSED FOR INCOMPLETENESS 0 $0 0 $0 5 $57,482 0 $0 0 $0 0 $0
Aggregated Statistics For Year 2000(Based on 2 partial tracts) A) FHA, FSA/RHS & VA B) Conventional C) Refinancings D) Home Improvement Loans F) Non-occupant Loans on Number Average Value Number Average Value Number Average Value Number Average Value Number Average Value
LOANS ORIGINATED 8 $67,320 57 $72,443 48 $53,611 24 $10,080 8 $46,216 APPLICATIONS APPROVED, NOT ACCEPTED 0 $0 4 $44,782 6 $54,785 4 $16,325 1 $39,350 APPLICATIONS DENIED 1 $49,670 10 $42,636 23 $62,979 9 $9,084 1 $44,650 APPLICATIONS WITHDRAWN 1 $44,090 6 $81,715 19 $55,368 2 $16,740 1 $45,760 FILES CLOSED FOR INCOMPLETENESS 0 $0 1 $49,670 1 $90,400 0 $0 0 $0
Aggregated Statistics For Year 1999(Based on 2 partial tracts) A) FHA, FSA/RHS & VA B) Conventional C) Refinancings D) Home Improvement Loans E) Loans on Dwellings For 5+ Families F) Non-occupant Loans on Number Average Value Number Average Value Number Average Value Number Average Value Number Average Value Number Average Value
LOANS ORIGINATED 12 $61,298 71 $76,439 96 $57,569 28 $10,918 1 $14,880 11 $55,472 APPLICATIONS APPROVED, NOT ACCEPTED 0 $0 3 $65,213 19 $57,002 3 $15,873 0 $0 1 $29,170 APPLICATIONS DENIED 1 $38,690 14 $38,468 28 $46,496 13 $5,821 0 $0 1 $29,340 APPLICATIONS WITHDRAWN 0 $0 4 $61,242 26 $55,237 3 $37,127 0 $0 1 $30,960 FILES CLOSED FOR INCOMPLETENESS 0 $0 1 $113,100 7 $52,566 0 $0 0 $0 0 $0
Detailed HMDA statistics for the following Tracts:
0036.01
, 0036.02
Private Mortgage Insurance Companies Aggregated Statistics For Year 2009(Based on 2 partial tracts) A) Conventional B) Refinancings Number Average Value Number Average Value
LOANS ORIGINATED 6 $174,078 6 $125,887 APPLICATIONS APPROVED, NOT ACCEPTED 1 $115,530 2 $169,235 APPLICATIONS DENIED 1 $55,810 0 $0 APPLICATIONS WITHDRAWN 0 $0 0 $0 FILES CLOSED FOR INCOMPLETENESS 0 $0 0 $0
Aggregated Statistics For Year 2008(Based on 2 partial tracts) A) Conventional B) Refinancings C) Non-occupant Loans on Number Average Value Number Average Value Number Average Value
LOANS ORIGINATED 14 $109,163 6 $112,773 2 $50,510 APPLICATIONS APPROVED, NOT ACCEPTED 1 $101,290 0 $0 0 $0 APPLICATIONS DENIED 1 $79,250 0 $0 1 $79,250 APPLICATIONS WITHDRAWN 1 $68,090 0 $0 0 $0 FILES CLOSED FOR INCOMPLETENESS 0 $0 1 $79,810 0 $0
Aggregated Statistics For Year 2007(Based on 2 partial tracts) A) Conventional B) Refinancings C) Non-occupant Loans on Number Average Value Number Average Value Number Average Value
LOANS ORIGINATED 29 $99,184 5 $123,726 1 $114,410 APPLICATIONS APPROVED, NOT ACCEPTED 3 $112,543 0 $0 1 $125,550 APPLICATIONS DENIED 1 $51,900 0 $0 0 $0 APPLICATIONS WITHDRAWN 1 $112,180 1 $66,970 1 $28,460 FILES CLOSED FOR INCOMPLETENESS 0 $0 0 $0 0 $0
Aggregated Statistics For Year 2006(Based on 2 partial tracts) A) Conventional B) Refinancings C) Non-occupant Loans on Number Average Value Number Average Value Number Average Value
LOANS ORIGINATED 13 $108,931 4 $97,735 1 $27,910 APPLICATIONS APPROVED, NOT ACCEPTED 1 $107,150 0 $0 0 $0 APPLICATIONS DENIED 0 $0 0 $0 0 $0 APPLICATIONS WITHDRAWN 1 $114,120 0 $0 0 $0 FILES CLOSED FOR INCOMPLETENESS 0 $0 0 $0 0 $0
Aggregated Statistics For Year 2005(Based on 2 partial tracts) A) Conventional B) Refinancings C) Non-occupant Loans on Number Average Value Number Average Value Number Average Value
LOANS ORIGINATED 22 $109,220 6 $94,733 1 $45,210 APPLICATIONS APPROVED, NOT ACCEPTED 1 $51,900 2 $65,015 0 $0 APPLICATIONS DENIED 0 $0 0 $0 0 $0 APPLICATIONS WITHDRAWN 0 $0 0 $0 0 $0 FILES CLOSED FOR INCOMPLETENESS 0 $0 0 $0 0 $0
Aggregated Statistics For Year 2004(Based on 2 partial tracts) A) Conventional B) Refinancings Number Average Value Number Average Value
LOANS ORIGINATED 18 $105,679 7 $102,207 APPLICATIONS APPROVED, NOT ACCEPTED 2 $96,690 1 $103,250 APPLICATIONS DENIED 0 $0 0 $0 APPLICATIONS WITHDRAWN 1 $160,730 1 $82,300 FILES CLOSED FOR INCOMPLETENESS 0 $0 0 $0
Aggregated Statistics For Year 2003(Based on 2 partial tracts) A) Conventional B) Refinancings C) Non-occupant Loans on Number Average Value Number Average Value Number Average Value
LOANS ORIGINATED 15 $92,715 19 $88,089 1 $53,020 APPLICATIONS APPROVED, NOT ACCEPTED 1 $77,280 5 $79,694 0 $0 APPLICATIONS DENIED 0 $0 0 $0 0 $0 APPLICATIONS WITHDRAWN 0 $0 3 $98,223 0 $0 FILES CLOSED FOR INCOMPLETENESS 0 $0 0 $0 0 $0
Aggregated Statistics For Year 2002(Based on 2 partial tracts) A) Conventional B) Refinancings C) Non-occupant Loans on Number Average Value Number Average Value Number Average Value
LOANS ORIGINATED 15 $79,322 13 $94,164 1 $24,560 APPLICATIONS APPROVED, NOT ACCEPTED 2 $71,575 4 $103,590 0 $0 APPLICATIONS DENIED 0 $0 1 $30,700 0 $0 APPLICATIONS WITHDRAWN 1 $60,830 1 $107,160 0 $0 FILES CLOSED FOR INCOMPLETENESS 1 $36,830 0 $0 0 $0
Aggregated Statistics For Year 2001(Based on 2 partial tracts) A) Conventional B) Refinancings Number Average Value Number Average Value
LOANS ORIGINATED 17 $81,793 14 $82,736 APPLICATIONS APPROVED, NOT ACCEPTED 2 $102,965 3 $78,410 APPLICATIONS DENIED 0 $0 1 $53,580 APPLICATIONS WITHDRAWN 0 $0 0 $0 FILES CLOSED FOR INCOMPLETENESS 0 $0 0 $0
Aggregated Statistics For Year 2000(Based on 2 partial tracts) A) Conventional B) Refinancings C) Non-occupant Loans on Number Average Value Number Average Value Number Average Value
LOANS ORIGINATED 20 $88,778 3 $54,413 1 $71,430 APPLICATIONS APPROVED, NOT ACCEPTED 1 $40,740 0 $0 0 $0 APPLICATIONS DENIED 2 $75,065 0 $0 0 $0 APPLICATIONS WITHDRAWN 0 $0 0 $0 0 $0 FILES CLOSED FOR INCOMPLETENESS 1 $18,980 0 $0 0 $0
Aggregated Statistics For Year 1999(Based on 2 partial tracts) A) Conventional B) Refinancings Number Average Value Number Average Value
LOANS ORIGINATED 18 $88,193 1 $73,040 APPLICATIONS APPROVED, NOT ACCEPTED 1 $92,870 2 $90,550 APPLICATIONS DENIED 0 $0 0 $0 APPLICATIONS WITHDRAWN 0 $0 0 $0 FILES CLOSED FOR INCOMPLETENESS 0 $0 0 $0
Detailed PMIC statistics for the following Tracts:
0036.01
, 0036.02
Most common first names in Chillicothe, IL among deceased individuals Name Count Lived (average)
John 72 76.2 years William 72 73.0 years Mary 58 77.5 years Charles 52 76.2 years Robert 48 73.2 years George 41 77.1 years James 39 71.8 years Ruth 33 80.7 years Helen 33 81.7 years Dorothy 32 76.9 years
Most common last names in Chillicothe, IL among deceased individuals Last name Count Lived (average)
Johnson 30 74.5 years Smith 22 78.8 years Brown 18 78.1 years Williams 18 79.6 years Davis 17 75.9 years Miller 17 75.0 years Mclaughlin 15 78.1 years Anderson 14 76.4 years Martin 14 73.3 years King 14 74.4 years
Chillicothe compared to Illinois state average:
Median house value below state average. Unemployed percentage significantly below state average. Black race population percentage significantly below state average. Hispanic race population percentage significantly below state average. Foreign-born population percentage significantly below state average. Length of stay since moving in above state average.
Top Patent Applicants
Stephen R. Lewis (26)
Dennis H. Gibson (11)
Christopher R. Gehrke (8)
Paul Frederick Olsen (8)
John P. Timmons (8)
Christopher Gehrke (7)
Tazio S. Grivetti (7)
Michael S. Bond (7)
Adam J. Gudat (7)
Matthew E. Kontz (7)
Total of 453 patent applications in 2008-2024.

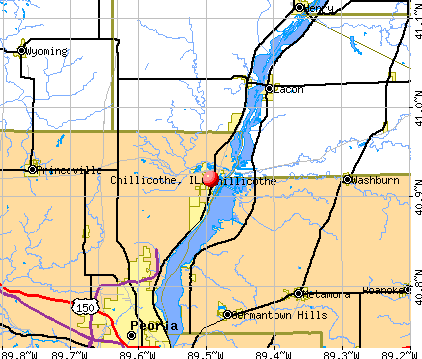


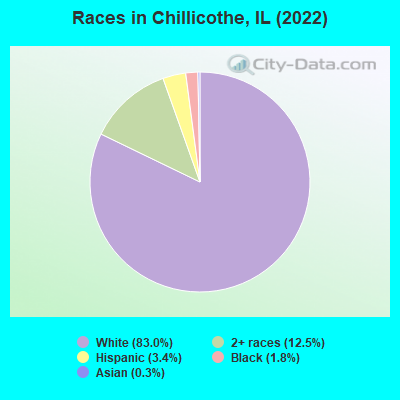
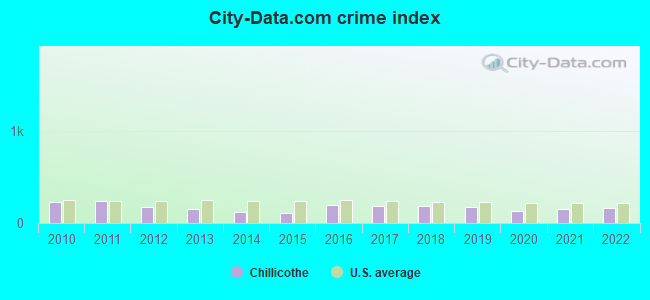
 Recent articles from our blog. Our writers, many of them Ph.D. graduates or candidates, create easy-to-read articles on a wide variety of topics.

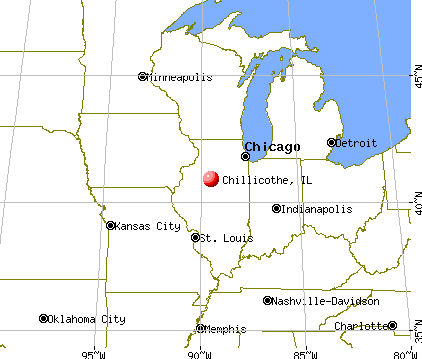
 (15.1 miles
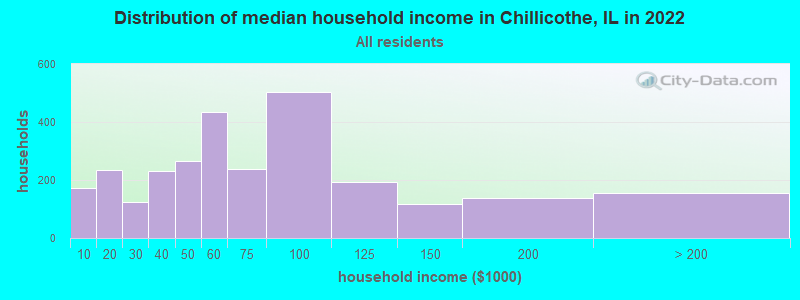
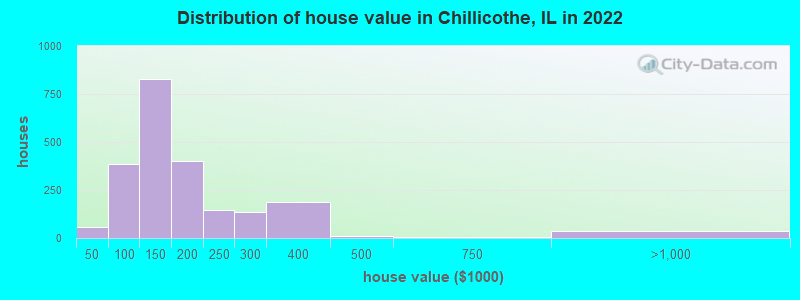
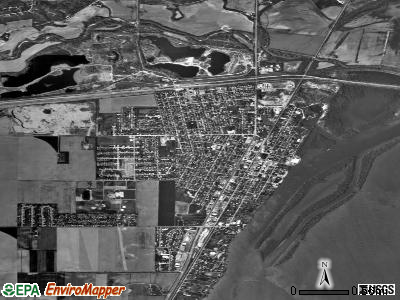
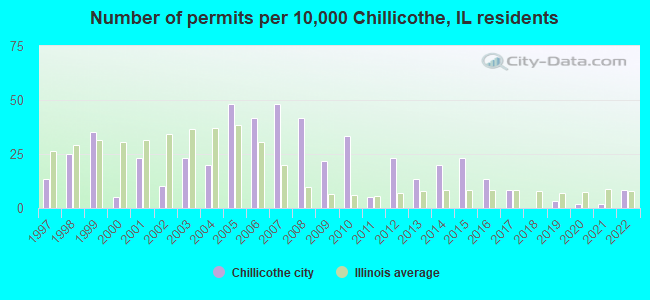
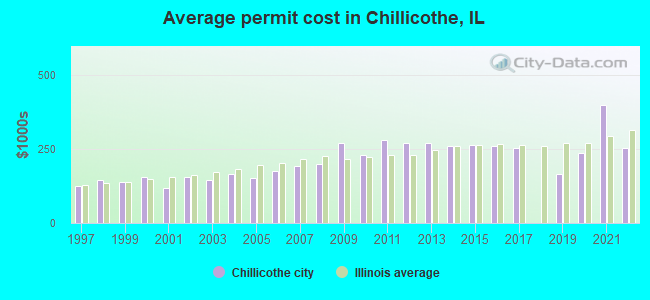
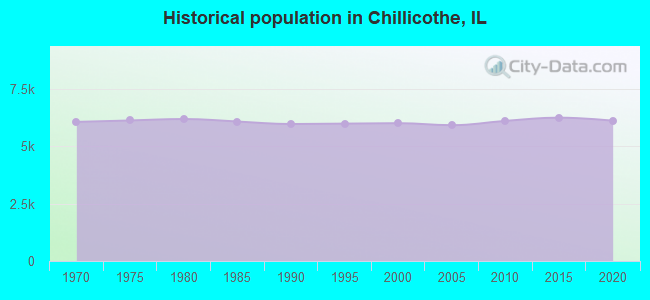
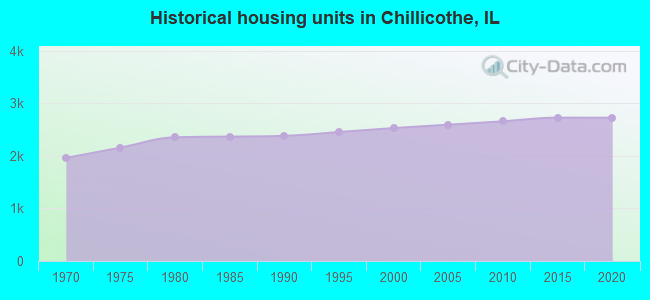
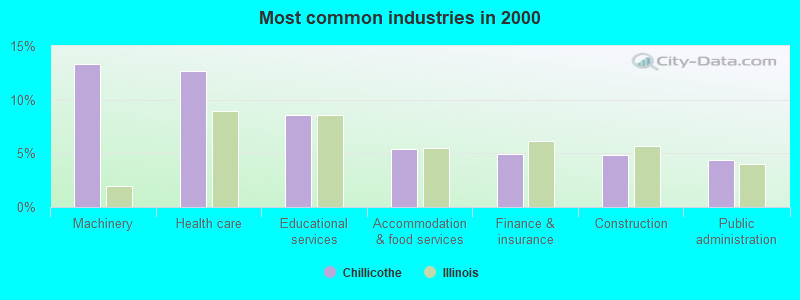
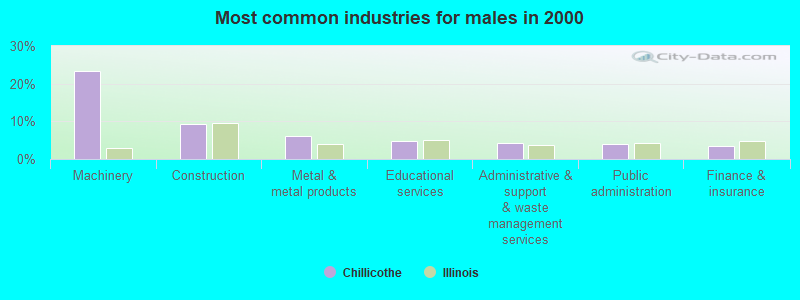
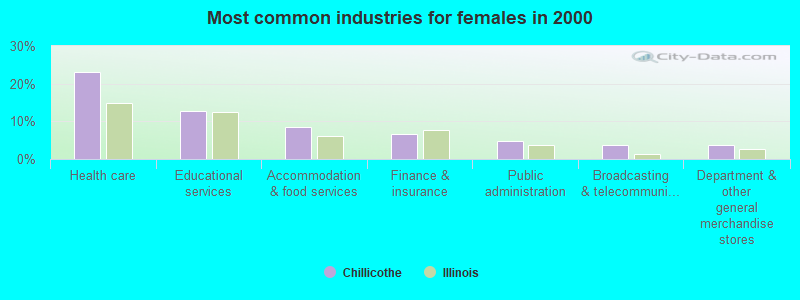
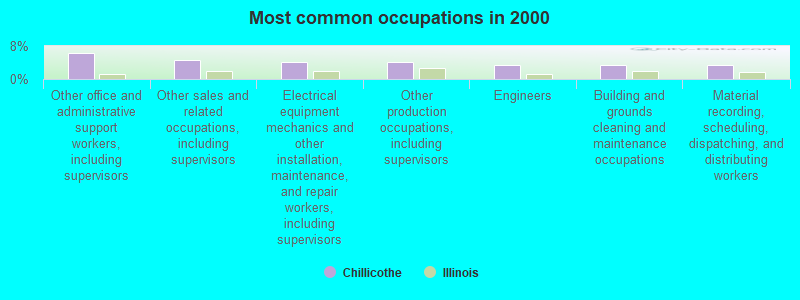
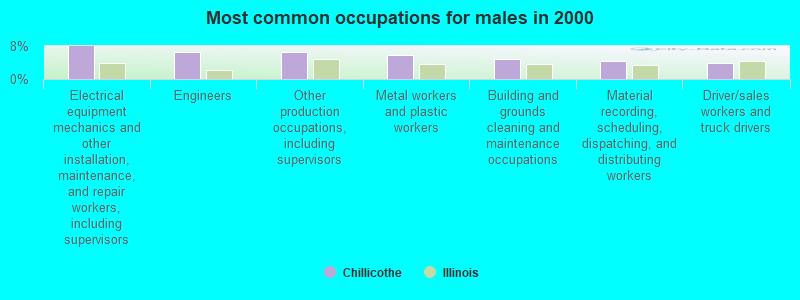
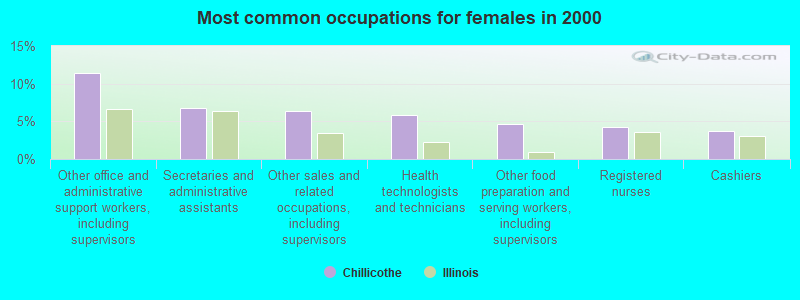


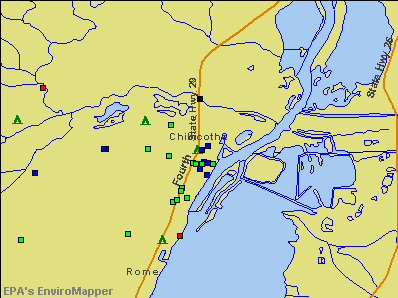

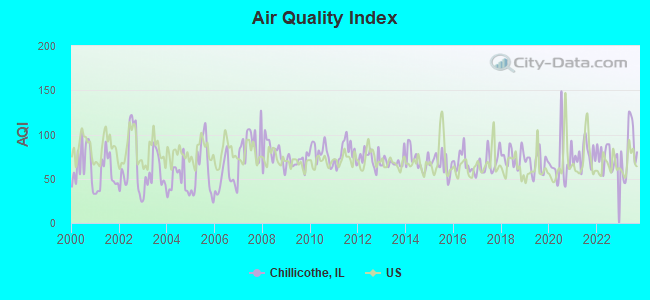
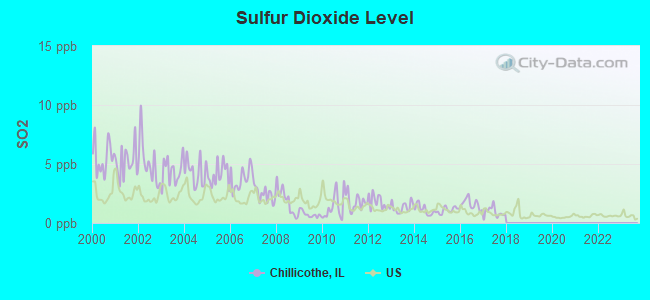
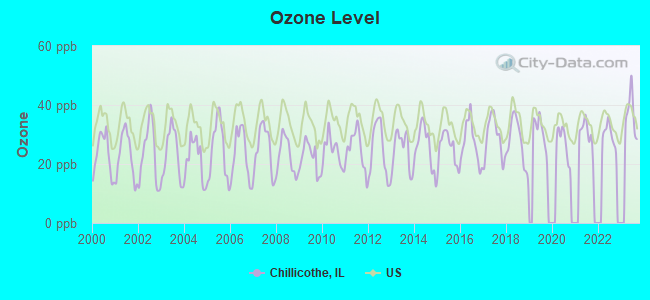
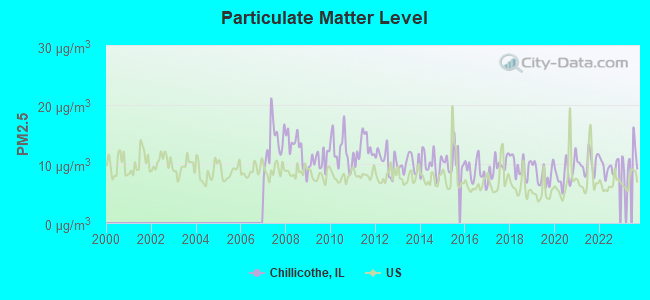
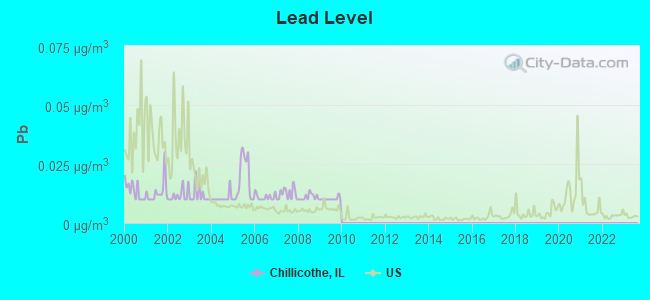

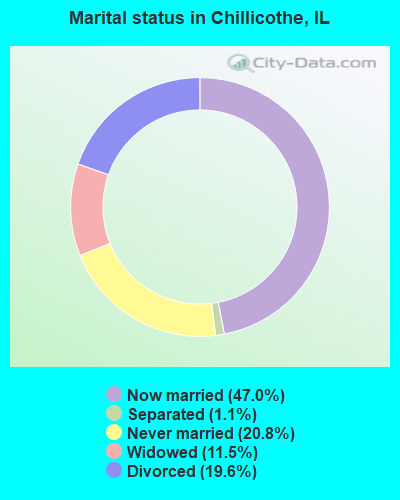
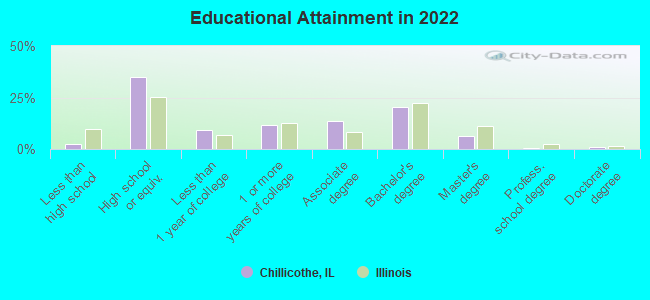
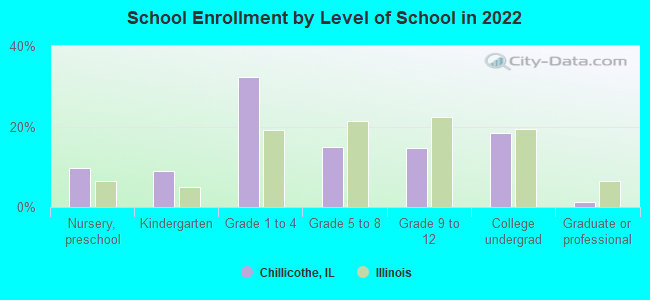
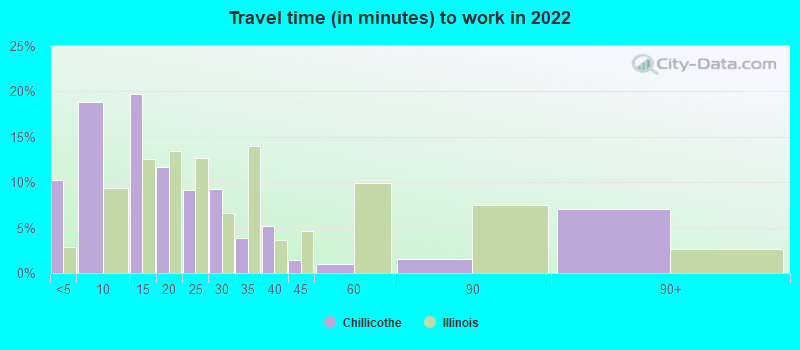
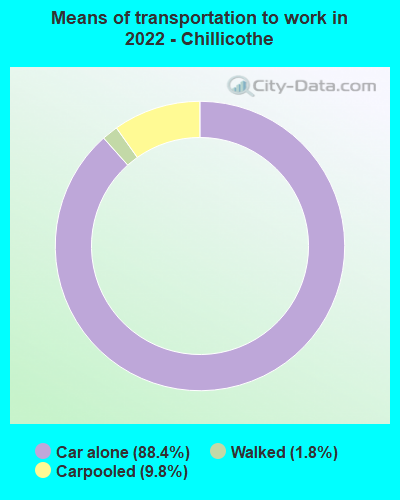
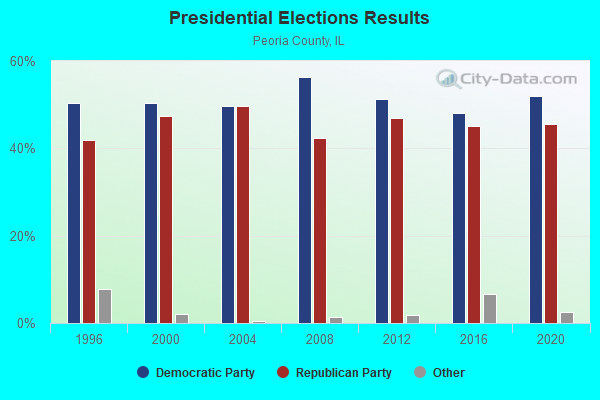

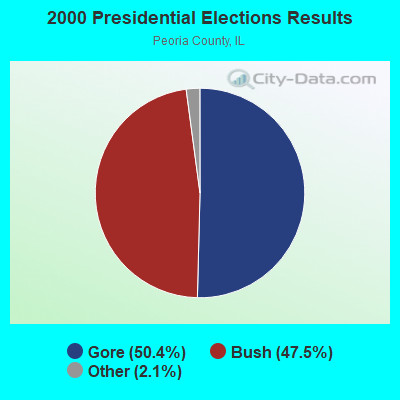
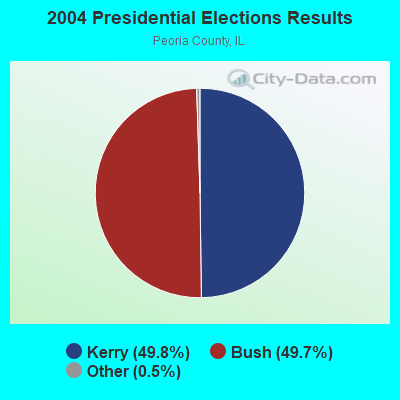

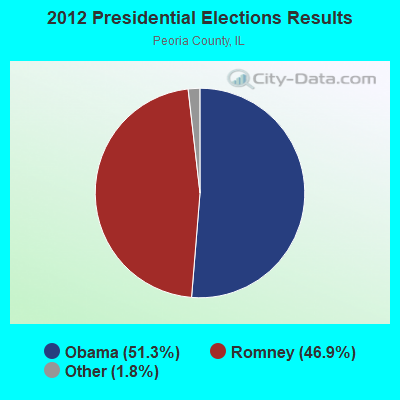
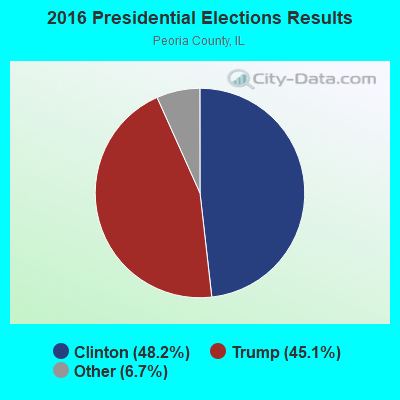
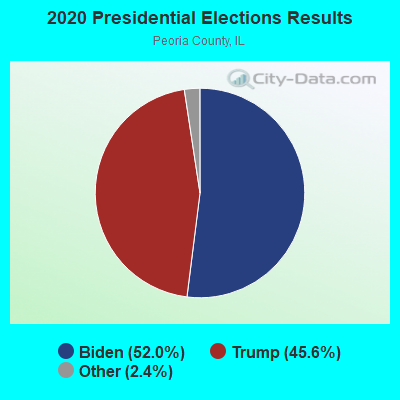
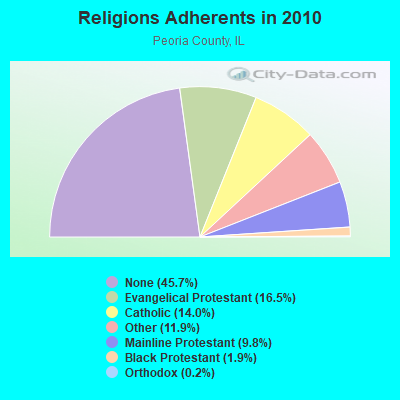
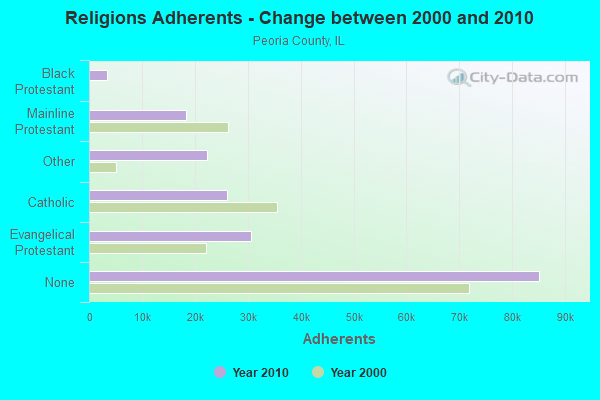
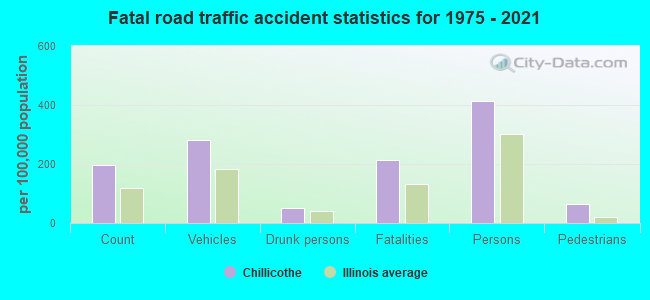
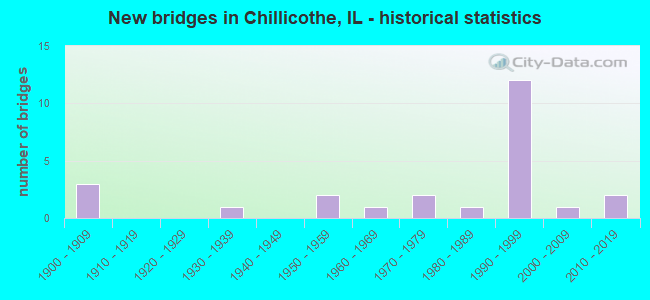
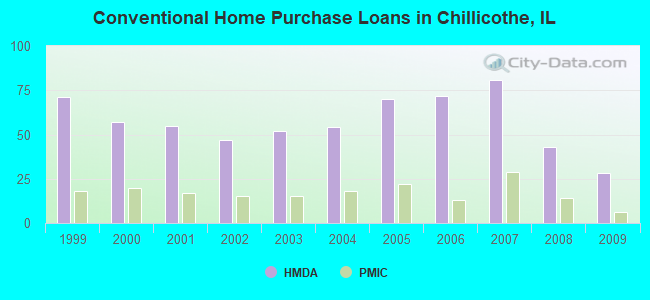
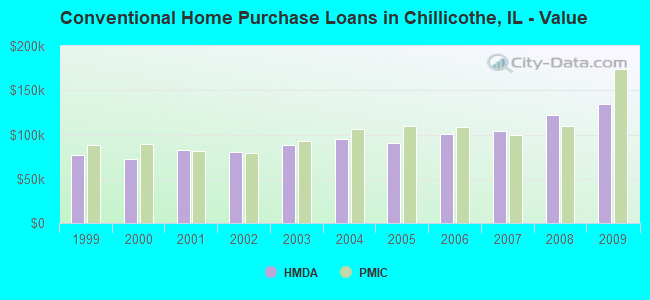
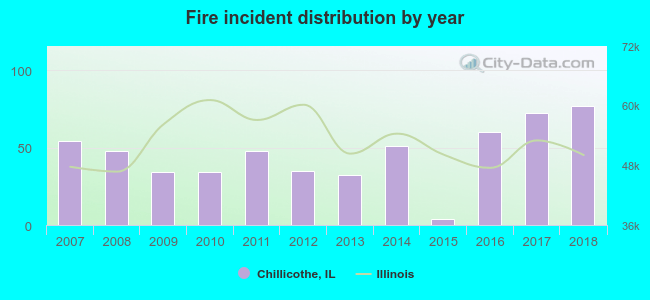 Based on the data from the years 2007 - 2018 the average number of fire incidents per year is 46. The highest number of fire incidents - 77 took place in 2018, and the least - 4 in 2015. The data has a growing trend.
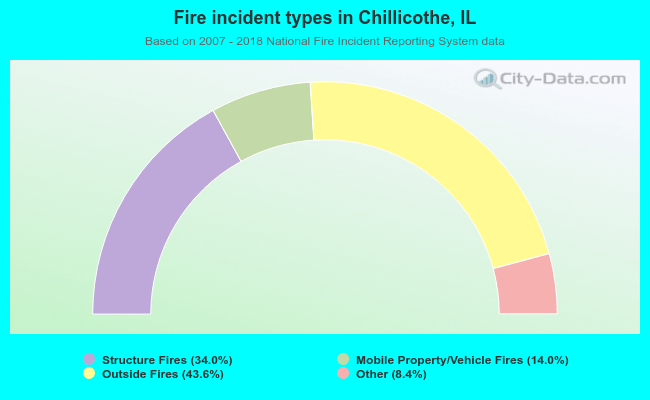 When looking into fire subcategories, the most reports belonged to: Outside Fires (43.6%), and Structure Fires (34.0%).