Millerville-Hollins, Alabama (AL) income map, earnings map, and wages data
The median household income in Millerville-Hollins, AL in 2022 was $51,370, which was 16.2% less than the median annual income of $59,674 across the entire state of Alabama. Compared to the median income of $29,352 in 2000 this represents an increase of 42.9%. The per capita income in 2022 was $26,927, which means an increase of 46.0% compared to 2000 when it was $14,528.
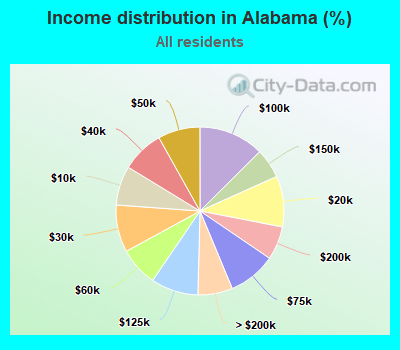
Income statistics for all residents
Median household income in Millerville-Hollins, AL in 2022:| Millerville-Hollins: | $51,371 |
| State: | $59,674 |
Change in median household income between 2000 and 2022:| Millerville-Hollins, Alabama: | +75.0% |
| State: | +74.8% |
Number of households with income < $10k:| Millerville-Hollins: | 7.6% (65,494) |
| State: | 7.6% (152,705) |
Number of households with income $10k - 20k:| Millerville-Hollins: | 9.8% (84,757) |
| State: | 9.8% (197,409) |
Number of households with income $20k - 30k:| Millerville-Hollins: | 9.1% (78,880) |
| State: | 9.1% (183,727) |
Number of households with income $30k - 40k:| Millerville-Hollins: | 8.1% (70,515) |
| State: | 8.1% (164,262) |
Number of households with income $40k - 50k:| Millerville-Hollins: | 8.1% (70,299) |
| State: | 8.1% (163,755) |
Number of households with income $50k - 60k:| Millerville-Hollins: | 7.5% (65,046) |
| State: | 7.5% (151,424) |
Number of households with income $60k - 75k:| Millerville-Hollins: | 9.2% (79,846) |
| State: | 9.2% (185,971) |
Number of households with income $75k - 100k:| Millerville-Hollins: | 12.6% (108,895) |
| Alabama: | 12.6% (253,313) |
Number of households with income $100k - 125k:| Millerville-Hollins: | 9.1% (79,161) |
| State: | 9.1% (184,314) |
Number of households with income $125k - 150k:| Millerville-Hollins: | 5.7% (49,519) |
| State: | 5.7% (115,397) |
Number of households with income $150k - 200k:| Millerville-Hollins: | 6.4% (55,702) |
| State: | 6.4% (129,875) |
Number of households with income > $200k:| Millerville-Hollins: | 6.6% (57,482) |
| State: | 6.7% (134,296) |
Aggregate household income in Millerville-Hollins in 2022: $1,404,491,780
Median family income in Millerville-Hollins in 2022:| Millerville-Hollins: | $68,918 |
| Alabama: | $77,668 |
Median non-family income in Millerville-Hollins in 2022:| Millerville-Hollins: | $33,444 |
| State: | $32,330 |
Change in median non-family income between 2000 and 2022:| Millerville-Hollins, Alabama: | +81.4% |
| State: | +81.0% |
Median per capita income in Millerville-Hollins in 2022:| Millerville-Hollins: | $26,927 |
| State: | $33,777 |
Change in median per capita income between 2000 and 2022:| Millerville-Hollins, Alabama: | +85.3% |
| State: | +85.7% |
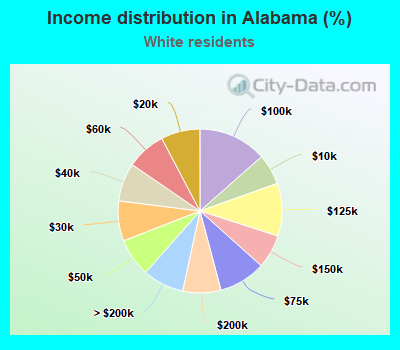
Income statistics for White residents
Median household income in Millerville-Hollins, AL in 2022:| Millerville-Hollins: | $63,265 |
| Alabama: | $68,168 |
Change in median household income between 2000 and 2022:| Millerville-Hollins, Alabama: | +76.8% |
| State: | +76.9% |
Number of households with income < $10k:| Millerville-Hollins: | 6.0% (37,599) |
| State: | 6.0% (81,374) |
Number of households with income $10k - 20k:| Millerville-Hollins: | 7.8% (48,559) |
| State: | 7.7% (103,935) |
Number of households with income $20k - 30k:| Millerville-Hollins: | 7.9% (49,662) |
| State: | 7.9% (106,652) |
Number of households with income $30k - 40k:| Millerville-Hollins: | 7.6% (47,487) |
| Alabama: | 7.6% (101,967) |
Number of households with income $40k - 50k:| Millerville-Hollins: | 7.6% (47,260) |
| Alabama: | 7.6% (101,782) |
Number of households with income $50k - 60k:| Millerville-Hollins: | 7.8% (48,464) |
| State: | 7.7% (104,223) |
Number of households with income $60k - 75k:| Millerville-Hollins: | 9.3% (57,892) |
| Alabama: | 9.2% (124,640) |
Number of households with income $75k - 100k:| Millerville-Hollins: | 13.6% (84,832) |
| Alabama: | 13.5% (182,175) |
Number of households with income $100k - 125k:| Millerville-Hollins: | 10.4% (64,924) |
| State: | 10.4% (140,351) |
Number of households with income $125k - 150k:| Millerville-Hollins: | 6.6% (41,432) |
| Alabama: | 6.7% (89,912) |
Number of households with income $150k - 200k:| Millerville-Hollins: | 7.5% (46,756) |
| Alabama: | 7.5% (101,623) |
Number of households with income > $200k:| Millerville-Hollins: | 8.0% (49,841) |
| State: | 8.1% (109,449) |
Aggregate household income in Millerville-Hollins in 2022: $822,604,640
Median family income in Millerville-Hollins in 2022:| Millerville-Hollins: | $78,832 |
| State: | $87,431 |
Number of families with income < $10k:| Millerville-Hollins: | 5.9% (23) |
| State: | 3.0% (27,027) |
Number of families with income $10k - 20k:| Millerville-Hollins: | 7.5% (30) |
| Alabama: | 3.7% (33,799) |
Number of families with income $20k - 30k:| Millerville-Hollins: | 8.5% (33) |
| Alabama: | 5.2% (46,603) |
Number of families with income $30k - 40k:| Millerville-Hollins: | 8.2% (32) |
| State: | 5.9% (53,168) |
Number of families with income $40k - 50k:| Millerville-Hollins: | 8.7% (34) |
| State: | 6.7% (60,599) |
Number of families with income $50k - 60k:| Millerville-Hollins: | 16.5% (65) |
| State: | 7.3% (65,413) |
Number of families with income $60k - 75k:| Millerville-Hollins: | 13.8% (54) |
| Alabama: | 10.0% (89,817) |
Number of families with income $75k - 100k:| Millerville-Hollins: | 15.8% (62) |
| State: | 15.3% (138,117) |
Number of families with income $125k - 150k:| Millerville-Hollins: | 3.9% (15) |
| Alabama: | 8.8% (79,234) |
Number of families with income > $200k:| Millerville-Hollins: | 11.2% (44) |
| State: | 11.0% (99,298) |
Median non-family income in Millerville-Hollins in 2022:| Millerville-Hollins: | $34,429 |
| State: | $35,655 |
Change in median non-family income between 2000 and 2022:| Millerville-Hollins, Alabama: | +82.2% |
| State: | +77.0% |
Median per capita income in Millerville-Hollins in 2022:| Millerville-Hollins: | $26,497 |
| State: | $38,538 |
Change in median per capita income between 2000 and 2022:| Millerville-Hollins, Alabama: | +85.3% |
| State: | +85.7% |
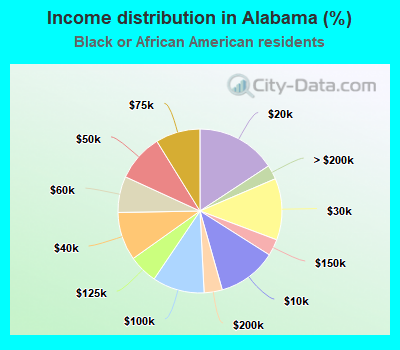
Income statistics for Black or African American residents
Median household income in Millerville-Hollins, AL in 2022:| Millerville-Hollins: | $23,572 |
| Alabama: | $40,774 |
Change in median household income between 2000 and 2022:| Millerville-Hollins, Alabama: | +89.4% |
| State: | +87.2% |
Number of households with income < $10k:| Millerville-Hollins: | 11.7% (17,625) |
| State: | 11.6% (61,525) |
Number of households with income $10k - 20k:| Millerville-Hollins: | 15.8% (23,768) |
| State: | 15.7% (83,337) |
Number of households with income $20k - 30k:| Millerville-Hollins: | 12.1% (18,309) |
| Alabama: | 12.1% (64,285) |
Number of households with income $30k - 40k:| Millerville-Hollins: | 9.5% (14,317) |
| Alabama: | 9.5% (50,471) |
Number of households with income $40k - 50k:| Millerville-Hollins: | 9.3% (14,085) |
| Alabama: | 9.3% (49,396) |
Number of households with income $50k - 60k:| Millerville-Hollins: | 7.1% (10,732) |
| State: | 7.1% (37,794) |
Number of households with income $60k - 75k:| Millerville-Hollins: | 8.8% (13,255) |
| Alabama: | 8.8% (46,635) |
Number of households with income $75k - 100k:| Millerville-Hollins: | 10.3% (15,466) |
| State: | 10.2% (54,232) |
Number of households with income $100k - 125k:| Millerville-Hollins: | 5.7% (8,639) |
| State: | 5.7% (30,295) |
Number of households with income $125k - 150k:| Millerville-Hollins: | 3.3% (4,943) |
| State: | 3.3% (17,334) |
Number of households with income $150k - 200k:| Millerville-Hollins: | 3.6% (5,386) |
| State: | 3.6% (18,943) |
Number of households with income > $200k:| Millerville-Hollins: | 2.8% (4,269) |
| Alabama: | 2.8% (14,974) |
Aggregate household income in Millerville-Hollins in 2022: $50,065,792
Median family income in Millerville-Hollins in 2022:| Millerville-Hollins: | $24,493 |
| Alabama: | $51,033 |
Number of families with income < $10k:| Millerville-Hollins: | 15.8% (18) |
| State: | 8.4% (26,238) |
Number of families with income $10k - 20k:| Millerville-Hollins: | 23.2% (27) |
| State: | 11.2% (34,919) |
Number of families with income $20k - 30k:| Millerville-Hollins: | 17.5% (20) |
| State: | 11.7% (36,395) |
Number of families with income $30k - 40k:| Millerville-Hollins: | 2.9% (3) |
| Alabama: | 9.0% (27,923) |
Number of families with income > $200k:| Millerville-Hollins: | 40.6% (47) |
| State: | 4.2% (13,215) |
Median non-family income in Millerville-Hollins in 2022:| Millerville-Hollins: | $27,013 |
| State: | $26,601 |
Change in median non-family income between 2000 and 2022:| Millerville-Hollins, Alabama: | +104.4% |
| State: | +117.2% |
Median per capita income in Millerville-Hollins in 2022:| Millerville-Hollins: | $33,698 |
| Alabama: | $24,808 |
Change in median per capita income between 2000 and 2022:| Millerville-Hollins, Alabama: | +114.8% |
| Alabama: | +112.7% |
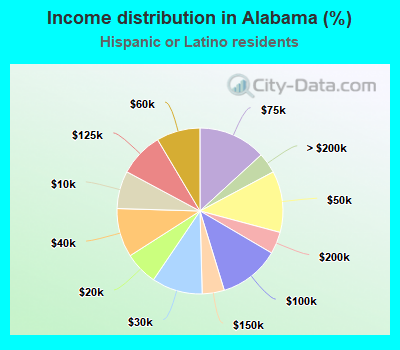
Income statistics for Hispanic or Latino residents
Median household income in Millerville-Hollins, AL in 2022:| Millerville-Hollins: | $75,398 |
| State: | $54,891 |
Change in median household income between 2000 and 2022:| Millerville-Hollins, Alabama: | +82.8% |
| State: | +80.8% |
Number of households with income < $10k:| Millerville-Hollins: | 7.3% (3,219) |
| State: | 7.4% (4,745) |
Number of households with income $10k - 20k:| Millerville-Hollins: | 6.5% (2,834) |
| State: | 6.5% (4,180) |
Number of households with income $20k - 30k:| Millerville-Hollins: | 9.9% (4,345) |
| Alabama: | 9.9% (6,374) |
Number of households with income $30k - 40k:| Millerville-Hollins: | 9.5% (4,175) |
| Alabama: | 9.5% (6,150) |
Number of households with income $40k - 50k:| Millerville-Hollins: | 12.0% (5,238) |
| State: | 12.0% (7,717) |
Number of households with income $50k - 60k:| Millerville-Hollins: | 8.6% (3,746) |
| Alabama: | 8.5% (5,497) |
Number of households with income $60k - 75k:| Millerville-Hollins: | 13.2% (5,776) |
| State: | 13.2% (8,513) |
Number of households with income $75k - 100k:| Millerville-Hollins: | 11.8% (5,185) |
| Alabama: | 11.8% (7,635) |
Number of households with income $100k - 125k:| Millerville-Hollins: | 8.6% (3,780) |
| State: | 8.6% (5,575) |
Number of households with income $125k - 150k:| Millerville-Hollins: | 4.3% (1,877) |
| Alabama: | 4.3% (2,777) |
Number of households with income $150k - 200k:| Millerville-Hollins: | 4.3% (1,867) |
| Alabama: | 4.3% (2,762) |
Number of households with income > $200k:| Millerville-Hollins: | 4.0% (1,755) |
| Alabama: | 4.0% (2,583) |
Aggregate household income in Millerville-Hollins in 2022: $1,807,412
Median family income in Millerville-Hollins in 2022:| Millerville-Hollins: | $72,862 |
| State: | $57,893 |
Number of families with income < $10k:| Millerville-Hollins: | 8.8% (3) |
| State: | 5.3% (2,657) |
Number of families with income $10k - 20k:| Millerville-Hollins: | 7.8% (2) |
| State: | 4.6% (2,322) |
Number of families with income $20k - 30k:| Millerville-Hollins: | 15.1% (4) |
| Alabama: | 11.1% (5,595) |
Number of families with income $30k - 40k:| Millerville-Hollins: | 11.7% (3) |
| State: | 9.9% (4,973) |
Number of families with income $40k - 50k:| Millerville-Hollins: | 13.3% (4) |
| State: | 12.6% (6,342) |
Number of families with income $50k - 60k:| Millerville-Hollins: | 15.9% (5) |
| Alabama: | 8.7% (4,395) |
Number of families with income $60k - 75k:| Millerville-Hollins: | 13.9% (4) |
| Alabama: | 13.0% (6,535) |
Number of families with income $75k - 100k:| Millerville-Hollins: | 8.4% (2) |
| State: | 11.2% (5,633) |
Number of families with income $125k - 150k:| Millerville-Hollins: | 1.5% (0) |
| Alabama: | 5.2% (2,607) |
Number of families with income > $200k:| Millerville-Hollins: | 3.5% (1) |
| State: | 4.6% (2,315) |
Median per capita income in Millerville-Hollins in 2022:| Millerville-Hollins: | $13,449 |
| State: | $19,178 |
Change in median per capita income between 2000 and 2022:| Millerville-Hollins, Alabama: | +52.6% |
| Alabama: | +54.7% |
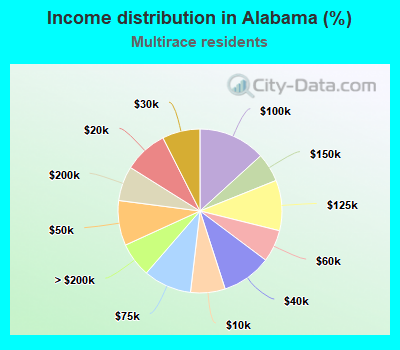
Income statistics for Multirace residents
Median household income in Millerville-Hollins, AL in 2022:| Millerville-Hollins: | $55,913 |
| State: | $62,694 |
Change in median household income between 2000 and 2022:| Millerville-Hollins, Alabama: | +101.3% |
| State: | +104.8% |
Number of households with income < $10k:| Millerville-Hollins: | 6.8% (2,351) |
| State: | 6.8% (5,192) |
Number of households with income $10k - 20k:| Millerville-Hollins: | 8.6% (2,984) |
| Alabama: | 8.6% (6,578) |
Number of households with income $20k - 30k:| Millerville-Hollins: | 7.4% (2,562) |
| Alabama: | 7.5% (5,669) |
Number of households with income $30k - 40k:| Millerville-Hollins: | 9.8% (3,379) |
| Alabama: | 9.8% (7,455) |
Number of households with income $40k - 50k:| Millerville-Hollins: | 8.9% (3,062) |
| Alabama: | 8.9% (6,754) |
Number of households with income $50k - 60k:| Millerville-Hollins: | 6.3% (2,181) |
| State: | 6.3% (4,828) |
Number of households with income $60k - 75k:| Millerville-Hollins: | 9.5% (3,282) |
| State: | 9.5% (7,224) |
Number of households with income $75k - 100k:| Millerville-Hollins: | 13.3% (4,574) |
| Alabama: | 13.2% (10,079) |
Number of households with income $100k - 125k:| Millerville-Hollins: | 9.9% (3,423) |
| Alabama: | 10.0% (7,571) |
Number of households with income $125k - 150k:| Millerville-Hollins: | 5.7% (1,966) |
| State: | 5.7% (4,327) |
Number of households with income $150k - 200k:| Millerville-Hollins: | 6.9% (2,368) |
| State: | 6.8% (5,200) |
Number of households with income > $200k:| Millerville-Hollins: | 6.9% (2,377) |
| State: | 6.8% (5,194) |
Aggregate household income in Millerville-Hollins in 2022: $4,051,419
Median family income in Millerville-Hollins in 2022:| Millerville-Hollins: | $62,300 |
| State: | $78,426 |
Number of families with income $20k - 30k:| Millerville-Hollins: | 100.0% (16) |
| State: | 5.6% (2,894) |
Median non-family income in Millerville-Hollins in 2022:| Millerville-Hollins: | $36,920 |
| Alabama: | $31,495 |
Change in median non-family income between 2000 and 2022:| Millerville-Hollins, Alabama: | +96.9% |
| Alabama: | +95.5% |
Median per capita income in Millerville-Hollins in 2022:| Millerville-Hollins: | $38,272 |
| Alabama: | $23,257 |
Change in median per capita income between 2000 and 2022:| Millerville-Hollins, Alabama: | +83.5% |
| State: | +87.3% |
Income statistics for other residents
Number of households with income < $10k:| Millerville-Hollins: | 5.9% (2) |
| State: | 8.6% (2,293) |
Number of households with income $10k - 20k:| Millerville-Hollins: | 5.9% (2) |
| State: | 7.1% (1,877) |
Number of households with income $20k - 30k:| Millerville-Hollins: | 17.6% (6) |
| State: | 12.4% (3,305) |
Number of households with income $30k - 40k:| Millerville-Hollins: | 8.8% (3) |
| State: | 8.9% (2,370) |
Number of households with income $40k - 50k:| Millerville-Hollins: | 11.8% (4) |
| State: | 13.1% (3,483) |
Number of households with income $50k - 60k:| Millerville-Hollins: | 8.8% (3) |
| Alabama: | 7.7% (2,044) |
Number of households with income $60k - 75k:| Millerville-Hollins: | 14.7% (5) |
| State: | 14.9% (3,963) |
Number of households with income $75k - 100k:| Millerville-Hollins: | 8.8% (3) |
| Alabama: | 9.5% (2,538) |
Number of households with income $100k - 125k:| Millerville-Hollins: | 5.9% (2) |
| State: | 6.5% (1,716) |
Number of households with income $125k - 150k:| Millerville-Hollins: | 2.9% (1) |
| State: | 4.3% (1,137) |
Number of households with income $150k - 200k:| Millerville-Hollins: | 5.9% (2) |
| Alabama: | 4.9% (1,291) |
Number of households with income > $200k:| Millerville-Hollins: | 2.9% (1) |
| Alabama: | 2.2% (580) |
Aggregate household income in Millerville-Hollins in 2022: $2,251,610
Median family income in Millerville-Hollins in 2022:| Millerville-Hollins: | $78,820 |
| State: | $54,676 |
Number of families with income $40k - 50k:| Millerville-Hollins: | 100.0% (58) |
| State: | 13.9% (2,772) |
Median per capita income in Millerville-Hollins in 2022:| Millerville-Hollins: | $21,472 |
| Alabama: | $18,366 |
Change in median per capita income between 2000 and 2022:| Millerville-Hollins, Alabama: | +106.1% |
| State: | +98.8% |