Yakima, WA (Washington) Houses and Residents
Estimated median house or condo value in 2022: $284,500 (it was $100,100 in 2000 )
Yakima:
$284,500Washington:
$569,500
Lower value quartile - upper value quartile: $201,900 - $395,900Mean price in 2022: Detached houses: $312,788 Here:
$312,788State:
$734,307
Townhouses or other attached units: $294,517 Here:
$294,517State:
$657,697
In 2-unit structures: $310,354 Here:
$310,354State:
$534,634
In 3-to-4-unit structures: $1,454,913 Here:
$1,454,913State:
$510,239
In 5-or-more-unit structures: $191,804 Here:
$191,804State:
$503,183
Mobile homes: $100,251 Here:
$100,251State:
$218,362
Occupied boats, RVs, vans, etc.: $17,462 Here:
$17,462State:
$159,523
Total population: 93,357 (Urban population: 72,231, Rural population: 63 (all nonfarm) )
Houses: 37,135 (35,615 occupied: 19,045 owner occupied, 16,570 renter occupied )
% of renters here:
47%State:
36%
Housing density: 1,845 houses/condos per square mile
Median price asked for vacant for-sale houses and condos in 2022: $241,236.
Median contract rent in 2022: $896 (lower quartile is $701, upper quartile is $1,117)
Median rent asked for vacant for-rent units in 2022: $1,043
Median gross rent in Yakima, WA in 2022: $1,068
Housing units in Yakima with a mortgage: 10,655 (462 second mortgage, 0 home equity loan, 375 both second mortgage and home equity loan )Houses without a mortgage: 202
Median household income for houses/condos with a mortgage: $95,939
Median household income for apartments without a mortgage: $63,687
Median monthly housing costs: $1,045
Data:
Median house or condo value ($)
Median house or condo value ($ change since 2000)
Median house or condo value ($) - White
Median house or condo value ($) - Black or African American
Median house or condo value ($) - Asian
Median house or condo value ($) - Hispanic or Latino
Median house or condo value ($) - American Indian and Alaska Native
Median house or condo value ($) - Multirace
Median house or condo value ($) - Other Race
Median price asked for mobile homes ($)
Household density (households per square mile)
Mean house or condo value by units in structure - 1, detached ($)
Mean house or condo value by units in structure - 1, attached ($)
Mean house or condo value by units in structure - 2 ($)
Mean house or condo value by units in structure by units in structure - 3 or 4 ($)
Mean house or condo value by units in structure - 5 or more ($)
Mean house or condo value by units in structure - Boat, RV, van, etc. ($)
Mean house or condo value by units in structure - Mobile home ($)
Median contract rent ($)
Median contract rent - Lower quartile ($)
Median contract rent - Upper quartile ($)
Median gross rent ($)
Urban houses (%)
Rural houses (%)
Houses occupied (%)
Houses occupied (% change since 2000)
Houses owner occupied (%)
Houses owner occupied (% change since 2000)
Houses renter occupied (%)
Houses renter occupied (% change since 2000)
Vacant housing units - For rent (%)
Vacant housing units - For rent (% change since 2000)
Vacant housing units - For sale only (%)
Vacant housing units - For sale only (% change since 2000)
Vacant housing units - Rented or sold, not occupied (%)
Vacant housing units - Rented or sold, not occupied (% change since 2000)
Vacant housing units - For seasonal, recreational, or occasional use (%)
Vacant housing units - For seasonal, recreational, or occasional use (% change since 2000)
Vacant housing units - For migrant workers (%)
Vacant housing units - For migrant workers (% change since 2000)
Vacant housing units - Other vacant (%)
Vacant housing units - Other vacant (% change since 2000)
Median monthly housing costs ($)
Median household income for houses/condos with a mortgage ($)
Median household income for houses/condos without a mortgage ($)
Median household income ($)
Median household income ($) - White
Median household income ($) - Black or African American
Median household income ($) - Asian
Median household income ($) - Hispanic or Latino
Median household income ($) - American Indian and Alaska Native
Median household income ($) - Multirace
Median household income ($) - Other Race
Mortgage status - with mortgage (%)
Mortgage status - with second mortgage (%)
Mortgage status - with home equity loan (%)
Mortgage status - with both second mortgage and home equity loan (%)
Mortgage status - without a mortgage (%)
Median year house/condo built
Median year apartment built
Household type by relationship - Male householder living alone (%)
Household type by relationship - Male householder not living alone (%)
Household type by relationship - Female householder living alone (%)
Household type by relationship - Female householder not living alone (%)
Household type by relationship - Opposite-Sex spouse (%)
Household type by relationship - Same-Sex spouse (%)
Household type by relationship - Opposite-Sex unmarried partner (%)
Household type by relationship - Same-Sex unmarried partner (%)
Household type by relationship - In group quarters (%)
Size of family households - 2-person household (%)
Size of family households - 3-person household (%)
Size of family households - 4-person household (%)
Size of family households - 5-person household (%)
Size of family households - 6-person household (%)
Size of family households - 7-or-more-person household (%)
Size of nonfamily households - 1-person household (%)
Size of nonfamily households - 2-person household (%)
Size of nonfamily households - 3-person household (%)
Size of nonfamily households - 4-person household (%)
Size of nonfamily households - 5-person household (%)
Size of nonfamily households - 6-person household (%)
Size of nonfamily households - 7-or-moreperson household (%)
Year house built - Built 2010 or later (%)
Year house built - Built 2000 to 2009 (%)
Year house built - Built 1990 to 1999 (%)
Year house built - Built 1980 to 1989 (%)
Year house built - Built 1970 to 1979 (%)
Year house built - Built 1960 to 1969 (%)
Year house built - Built 1950 to 1959 (%)
Year house built - Built 1940 to 1949 (%)
Year house built - Built 1939 or earlier (%)
Median number of rooms in houses and condos
Median number of rooms in apartments
Median number of bedrooms in owner occupied houses
Mean number of bedrooms in owner occupied houses
Median number of bedrooms in renter occupied houses
Mean number of bedrooms in renter occupied houses
Median number of vehichles in owner occupied houses
Mean number of vehichles in owner occupied houses
Median number of vehichles in renter occupied houses
Mean number of vehichles in renter occupied houses
Rooms in owner-occupied houses - 1 room (%)
Rooms in owner-occupied houses - 2 rooms (%)
Rooms in owner-occupied houses - 3 rooms (%)
Rooms in owner-occupied houses - 4 rooms (%)
Rooms in owner-occupied houses - 5 rooms (%)
Rooms in owner-occupied houses - 6 rooms (%)
Rooms in owner-occupied houses - 7 rooms (%)
Rooms in owner-occupied houses - 8 rooms (%)
Rooms in owner-occupied houses - 9+ rooms (%)
Rooms in renter-occupied houses - 1 room (%)
Rooms in renter-occupied houses - 2 rooms (%)
Rooms in renter-occupied houses - 3 rooms (%)
Rooms in renter-occupied houses - 4 rooms (%)
Rooms in renter-occupied houses - 5 rooms (%)
Rooms in renter-occupied houses - 6 rooms (%)
Rooms in renter-occupied houses - 7 rooms (%)
Rooms in renter-occupied houses - 8 rooms (%)
Rooms in renter-occupied houses - 9+ rooms (%)
Bedrooms in owner-occupied houses - no bedrooms (%)
Bedrooms in owner-occupied houses - 1 bedroom (%)
Bedrooms in owner-occupied houses - 2 bedrooms (%)
Bedrooms in owner-occupied houses - 3 bedrooms (%)
Bedrooms in owner-occupied houses - 4 bedrooms (%)
Bedrooms in owner-occupied houses - 5+ bedrooms (%)
Bedrooms in renter-occupied houses - no bedrooms (%)
Bedrooms in renter-occupied houses - 1 bedroom (%)
Bedrooms in renter-occupied houses - 2 bedrooms (%)
Bedrooms in renter-occupied houses - 3 bedrooms (%)
Bedrooms in renter-occupied houses - 4 bedrooms (%)
Bedrooms in renter-occupied houses - 5+ bedrooms (%)
Vehicles available in owner-occupied houses - no vehicle available (%)
Vehicles available in owner-occupied houses - 1 vehicle available(%)
Vehicles available in owner-occupied houses - 2 Vehicles available (%)
Vehicles available in owner-occupied houses - 3 Vehicles available (%)
Vehicles available in owner-occupied houses - 4 Vehicles available (%)
Vehicles available in owner-occupied houses - 5+ Vehicles available (%)
Vehicles available in renter-occupied houses - no vehicle available (%)
Vehicles available in renter-occupied houses - 1 vehicle available (%)
Vehicles available in renter-occupied houses - 2 Vehicles available (%)
Vehicles available in renter-occupied houses - 3 Vehicles available (%)
Vehicles available in renter-occupied houses - 4 Vehicles available (%)
Vehicles available in renter-occupied houses - 5+ Vehicles available (%)
Housing units in structures - 1, detached (%)
Housing units in structures - 1, attached (%)
Housing units in structures - 2 (%)
Housing units in structures - 3 or 4 (%)
Housing units in structures - 5 to 9 (%)
Housing units in structures - 10 to 19 (%)
Housing units in structures - 20 to 49 (%)
Housing units in structures - 50 or more (%)
Housing units in structures - Mobile home (%)
Housing units in structures - Boat, RV, van, etc. (%)
Housing units in structures - Owners - 1, detached (%)
Housing units in structures - Owners - 1, attached (%)
Housing units in structures - Owners - 2 (%)
Housing units in structures - Owners - 3 or 4 (%)
Housing units in structures - Owners - 5 to 9 (%)
Housing units in structures - Owners - 10 to 19 (%)
Housing units in structures - Owners - 20 to 49 (%)
Housing units in structures - Owners - 50 or more (%)
Housing units in structures - Owners - Mobile home (%)
Housing units in structures - Owners - Boat, RV, van, etc. (%)
Housing units in structures - Renters - 1, detached (%)
Housing units in structures - Renters - 1, attached (%)
Housing units in structures - Renters - 2 (%)
Housing units in structures - Renters - 3 or 4 (%)
Housing units in structures - Renters - 5 to 9 (%)
Housing units in structures - Renters - 10 to 19 (%)
Housing units in structures - Renters - 20 to 49 (%)
Housing units in structures - Renters - 50 or more (%)
Housing units in structures - Renters - Mobile home (%)
Housing units in structures - Renters - Boat, RV, van, etc. (%)
House/condo owner moved in on average (years ago)
Renter moved in on average (years ago)
Year householder moved into unit - Moved in 1999 to March 2000 (%)
Year householder moved into unit - Moved in 1999 to March 2000 (%) - White
Year householder moved into unit - Moved in 1999 to March 2000 (%) - Black or African American
Year householder moved into unit - Moved in 1999 to March 2000 (%) - Asian
Year householder moved into unit - Moved in 1999 to March 2000 (%) - Hispanic or Latino
Year householder moved into unit - Moved in 1999 to March 2000 (%) - American Indian and Alaska Native
Year householder moved into unit - Moved in 1999 to March 2000 (%) - Multirace
Year householder moved into unit - Moved in 1999 to March 2000 (%) - Other Race
Year householder moved into unit - Moved in 1995 to 1998 (%)
Year householder moved into unit - Moved in 1995 to 1998 (%) - White
Year householder moved into unit - Moved in 1995 to 1998 (%) - Black or African American
Year householder moved into unit - Moved in 1995 to 1998 (%) - Asian
Year householder moved into unit - Moved in 1995 to 1998 (%) - Hispanic or Latino
Year householder moved into unit - Moved in 1995 to 1998 (%) - American Indian and Alaska Native
Year householder moved into unit - Moved in 1995 to 1998 (%) - Multirace
Year householder moved into unit - Moved in 1995 to 1998 (%) - Other Race
Year householder moved into unit - Moved in 1990 to 1994 (%)
Year householder moved into unit - Moved in 1990 to 1994 (%) - White
Year householder moved into unit - Moved in 1990 to 1994 (%) - Black or African American
Year householder moved into unit - Moved in 1990 to 1994 (%) - Asian
Year householder moved into unit - Moved in 1990 to 1994 (%) - Hispanic or Latino
Year householder moved into unit - Moved in 1990 to 1994 (%) - American Indian and Alaska Native
Year householder moved into unit - Moved in 1990 to 1994 (%) - Multirace
Year householder moved into unit - Moved in 1990 to 1994 (%) - Other Race
Year householder moved into unit - Moved in 1980 to 1989 (%)
Year householder moved into unit - Moved in 1980 to 1989 (%) - White
Year householder moved into unit - Moved in 1980 to 1989 (%) - Black or African American
Year householder moved into unit - Moved in 1980 to 1989 (%) - Asian
Year householder moved into unit - Moved in 1980 to 1989 (%) - Hispanic or Latino
Year householder moved into unit - Moved in 1980 to 1989 (%) - American Indian and Alaska Native
Year householder moved into unit - Moved in 1980 to 1989 (%) - Multirace
Year householder moved into unit - Moved in 1980 to 1989 (%) - Other Race
Year householder moved into unit - Moved in 1970 to 1979 (%)
Year householder moved into unit - Moved in 1970 to 1979 (%) - White
Year householder moved into unit - Moved in 1970 to 1979 (%) - Black or African American
Year householder moved into unit - Moved in 1970 to 1979 (%) - Asian
Year householder moved into unit - Moved in 1970 to 1979 (%) - Hispanic or Latino
Year householder moved into unit - Moved in 1970 to 1979 (%) - American Indian and Alaska Native
Year householder moved into unit - Moved in 1970 to 1979 (%) - Multirace
Year householder moved into unit - Moved in 1970 to 1979 (%) - Other Race
Year householder moved into unit - Moved in 1969 or earlier (%)
Year householder moved into unit - Moved in 1969 or earlier (%) - White
Year householder moved into unit - Moved in 1969 or earlier (%) - Black or African American
Year householder moved into unit - Moved in 1969 or earlier (%) - Asian
Year householder moved into unit - Moved in 1969 or earlier (%) - Hispanic or Latino
Year householder moved into unit - Moved in 1969 or earlier (%) - American Indian and Alaska Native
Year householder moved into unit - Moved in 1969 or earlier (%) - Multirace
Year householder moved into unit - Moved in 1969 or earlier (%) - Other Race
Housing units lacking complete plumbing facilities (%)
Housing units lacking complete kitchen facilities (%)
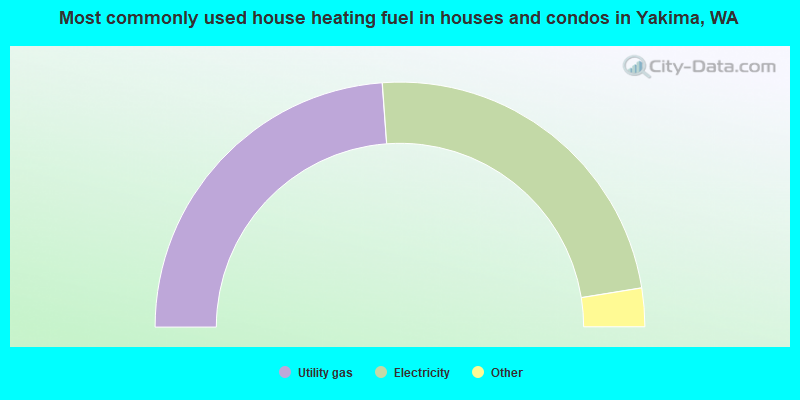
House heating fuel used in houses and condos - Utility gas (%)
House heating fuel used in houses and condos - Bottled, tank, or LP gas (%)
House heating fuel used in houses and condos - Electricity (%)
House heating fuel used in houses and condos - Fuel oil, kerosene, etc. (%)
House heating fuel used in houses and condos - Coal or coke (%)
House heating fuel used in houses and condos - Wood (%)
House heating fuel used in houses and condos - Solar energy (%)
House heating fuel used in houses and condos - Other fuel (%)
House heating fuel used in houses and condos - No fuel used (%)
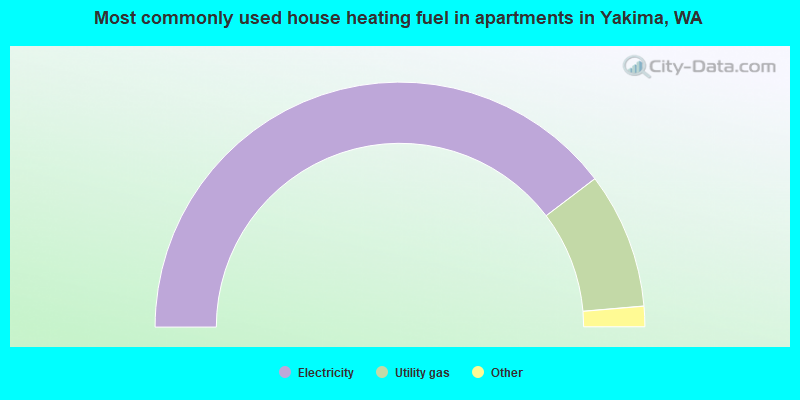
House heating fuel used in apartments - Utility gas (%)
House heating fuel used in apartments - Bottled, tank, or LP gas (%)
House heating fuel used in apartments - Electricity (%)
House heating fuel used in apartments - Fuel oil, kerosene, etc. (%)
House heating fuel used in apartments - Coal or coke (%)
House heating fuel used in apartments - Wood (%)
House heating fuel used in apartments - Solar energy (%)
House heating fuel used in apartments - Other fuel (%)
House heating fuel used in apartments - No fuel used (%)
Latest news about housing in Yakima, WA collected exclusively by city-data.com from local newspapers, TV, and radio stations
Median year house/condo built: 1968Median year apartment built: 1972Household type by relationship:
Households: 97,017
Male householders: 17,135 (4,499 living alone ), Female householders: 18,480 (6,963 living alone )13,120 spouses (13,070 opposite-sex spouses ), 4,220 unmarried partners , (3,965 opposite-sex unmarried partners ), 31,161 children (29,471 natural , 159 adopted , 1,531 stepchildren ), 2,305 grandchildren , 2,483 brothers or sisters , 1,736 parents , 0 foster children , 2,433 other relatives , 2,065 non-relatives In group quarters: 1,879
Size of family households: 7,017 2-persons , 5,008 3-persons , 5,048 4-persons , 3,920 5-persons , 1,368 6-persons , 310 7-or-more-persons .
Size of nonfamily households: 11,462 1-person , 1,482 2-persons .
12,936 married couples with children. single-parent households (3,405 men , 6,315 women ).
61.5% of residents of Yakima speak English at home. of residents speak Spanish at home (58% speak English very well , 15% speak English well , 16% speak English not well , 12% don't speak English at all ).of residents speak other Indo-European language at home (75% speak English very well , 20% speak English well , 5% don't speak English at all ).of residents speak Asian or Pacific Island language at home (60% speak English very well , 30% speak English well , 9% speak English not well , 1% don't speak English at all ).of residents speak other language at home (64% speak English very well , 26% speak English well , 7% speak English not well , 2% don't speak English at all ).
Foreign born population: 18,872 (19.5%)of them are naturalized citizens )
Median number of rooms in houses and condos:
Median number of rooms in apartments
Owner-occupied Renter-occupied
Bedrooms in owner-occupied houses and condos in Yakima, Washington
168 no bedroom 912 1 bedroom 4,497 2 bedrooms 8,892 3 bedrooms 3,533 4 bedrooms 1,043 5+ bedrooms
Bedrooms in renter-occupied apartments in Yakima, Washington
1,145 no bedroom 4,777 1 bedroom 6,152 2 bedrooms 3,349 3 bedrooms 986 4 bedrooms 161 5+ bedrooms
Owner-occupied Renter-occupied
Rooms in owner-occupied houses in Yakima, Washington
168 1 room 0 2 rooms 1,193 3 rooms 2,606 4 rooms 3,425 5 rooms 3,765 6 rooms 2,625 7 rooms 2,518 8 rooms 2,745 9+ rooms
Rooms in renter-occupied apartments in Yakima, Washington
1,079 1 room 1,106 2 rooms 2,970 3 rooms 3,812 4 rooms 3,602 5 rooms 3,132 6 rooms 291 7 rooms 280 8 rooms 298 9+ rooms
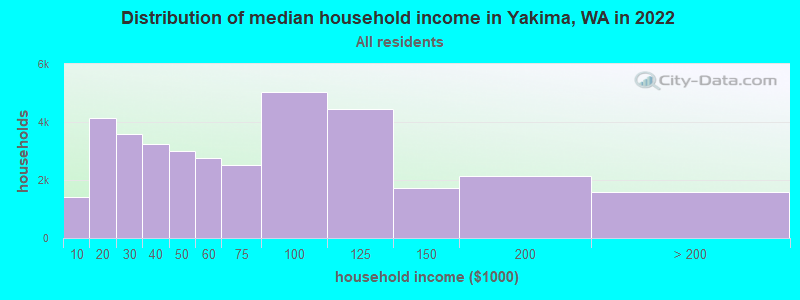
Yakima, WA household income distribution 1,417 Less than $10,0004,154 $10,000 to $19,9993,579 $20,000 to $29,9993,236 $30,000 to $39,9992,997 $40,000 to $49,9992,774 $50,000 to $59,9992,515 $60,000 to $74,9995,047 $75,000 to $99,9994,455 $100,000 to $124,9991,735 $125,000 to $149,9992,130 $150,000 to $199,9991,576 $200,000 or more
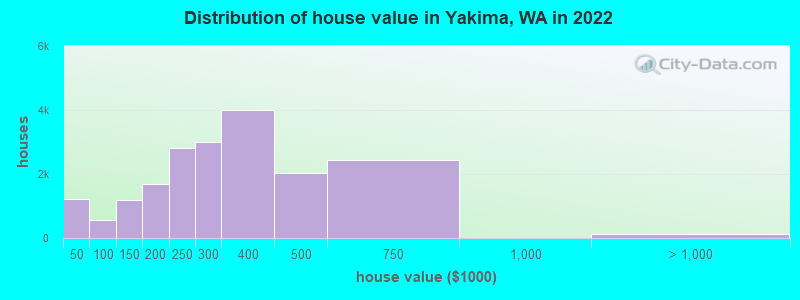
Home value of owner - occupied houses in 2022 in Yakima, WA 251 Less than $10,00090 $10,000 to $14,999405 $15,000 to $19,999360 $20,000 to $24,999122 $25,000 to $29,999277 $50,000 to $59,999146 $60,000 to $69,999142 $80,000 to $89,999584 $100,000 to $124,999606 $125,000 to $149,999948 $150,000 to $174,999724 $175,000 to $199,9992,803 $200,000 to $249,9992,992 $250,000 to $299,9993,998 $300,000 to $399,9992,027 $400,000 to $499,9992,434 $500,000 to $749,999136 $2,000,000 or moreRent paid by renters in 2022 in Yakima, WA 664 $150 to $199485 $200 to $249478 $250 to $29979 $300 to $34990 $350 to $399417 $450 to $499325 $500 to $549926 $550 to $599191 $600 to $649404 $650 to $699745 $700 to $7491,044 $750 to $7992,386 $800 to $8992,773 $900 to $9992,593 $1,000 to $1,2491,365 $1,250 to $1,499181 $1,500 to $1,999878 $2,000 to $2,49972 $2,500 to $2,999196 $3,500 or more278 No cash rent
Percentage of workers working in this county: 96.1%Number of people working at home: 2,939 (7.5% of all workers )
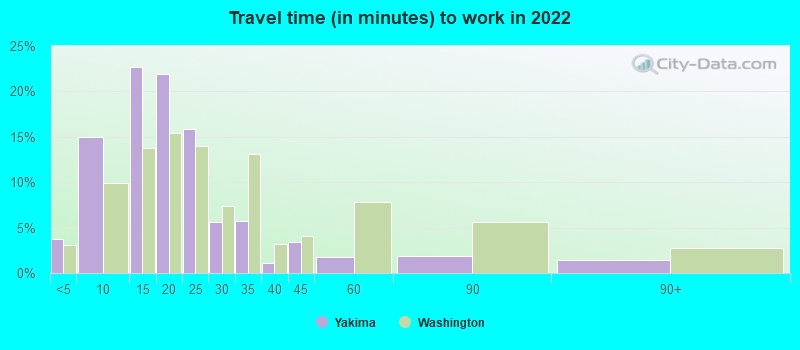
Travel time to work (commute)
Less than 5 minutes: 1,1915 to 9 minutes: 6,48910 to 14 minutes: 8,45515 to 19 minutes: 7,36220 to 24 minutes: 3,66825 to 29 minutes: 1,67830 to 34 minutes: 2,46635 to 39 minutes: 14240 to 44 minutes: 1,52645 to 59 minutes: 79260 to 89 minutes: 1,14990 or more minutes: 218
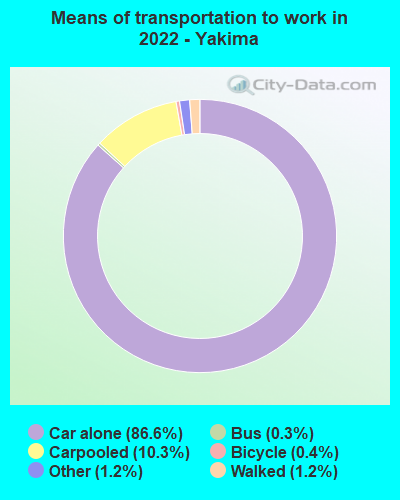
Means of transportation to work:
Drove a car alone: 36,865 (79.1%)Carpooled: 5,093 (10.9%)Bus : 197 (0.4%)Taxi: 294 (0.6%)Bicycle: 161 (0.3%)Walked: 696 (1.5%)Worked at home: 2,939 (6.3%)
Unemployment by race in 2022
Unemployment rate for White non-Hispanic residents 3.8% Males7.6% FemalesUnemployment rate for Black residents 8.2% MalesUnemployment rate for American Indian and Alaska Native residents 6.4% MalesUnemployment rate for other race residents 10.1% Males9.6% FemalesUnemployment rate for two or more race residents 1.8% Males15.3% FemalesUnemployment rate for Hispanic or Latino residents 6.9% Males10.9% Females
Year of entry for the foreign-born population in Yakima, Washington
2,929 2010 or later 4,900 2000 to 2009 4,981 1990 to 1999 3,931 1980 to 1989 1,599 1970 to 1979 929 Before 1970
First ancestries reported:
German: 4,009 (6.8%)
American: 2,859 (4.9%)
English: 2,642 (4.5%)
European: 2,086 (3.5%)
Irish: 1,450 (2.5%)
Norwegian: 545 (0.9%)
British: 508 (0.9%)
African: 360 (0.6%)
Italian: 351 (0.6%)
Dutch: 330 (0.6%)
Swedish: 297 (0.5%)
Scottish: 265 (0.4%)
French: 241 (0.4%)
Scandinavian: 206 (0.3%)
Scotch-Irish: 187 (0.3%)
Danish: 170 (0.3%)
Swiss: 117 (0.2%)
French Canadian: 104 (0.2%)
Canadian: 104 (0.2%)
Ukrainian: 89 (0.2%)
Russian: 57 (0.10%)
Israeli: 53 (0.09%)
Polish: 51 (0.09%)
Finnish: 40 (0.07%)
Czech: 40 (0.07%)
Welsh: 37 (0.06%)
Portuguese: 32 (0.05%)
Brazilian: 32 (0.05%)
Turkish: 27 (0.05%)
Hungarian: 26 (0.04%)
Eastern European: 23 (0.04%)
Lebanese: 18 (0.03%)
Basque: 18 (0.03%)
Northern European: 17 (0.03%)
Maltese: 16 (0.03%)
Czechoslovakian: 16 (0.03%)
Romanian: 15 (0.03%)
Arab: 12 (0.02%)
Bulgarian: 11 (0.02%)
Iranian: 10 (0.02%)
Belgian: 10 (0.02%)
Celtic: 9 (0.02%)
Greek: 7 (0.01%)
Ethiopian: 7 (0.01%)
Croatian: 6 (0.01%) Most common places of birth for foreign-born residents (%): Mexico Yakima:
83.9% (14,520)Washington:
21.1% (241,655)
Honduras Yakima:
3.8% (651)Washington:
0.6% (6,500)
Philippines Yakima:
2.1% (358)Washington:
6.3% (71,661)
Micronesia Yakima:
1.9% (336)Washington:
0.4% (4,144)
Place of birth for U.S.-born residents:
This state: 59,015Other state: 17,516Northeast: 1,948Midwest: 3,139South: 1,839West: 10,590 84.8% of Yakima residents lived in the same house 1 years ago.
Out of people who lived in different houses, 44.9% lived in this county.
Out of people who lived in different counties, 75.1% lived in Washington.
Yakima:
84.8%State average:
85.2%
Education attainment for males 25 years and older:
No schooling: 1,129Nursery to 4th grade: 1805th and 6th grade: 5997th and 8th grade: 4179th grade: 29410th grade: 62211th grade: 1,54812th grade, no diploma: 977High school graduate (or equivalency): 9,675Less than 1 year of college: 1,940Some college more than 1 year, no degree: 3,301Associate degree: 3,088Bachelor's degree: 3,883Master's degree: 1,425Professional school degree: 464Doctorate degree: 0
Education attainment for females 25 years and older:
No schooling: 931Nursery to 4th grade: 3805th and 6th grade: 7117th and 8th grade: 6419th grade: 63710th grade: 46611th grade: 56112th grade, no diploma: 1,365High school graduate (or equivalency): 8,855Less than 1 year of college: 2,660Some college more than 1 year, no degree: 4,819Associate degree: 3,142Bachelor's degree: 4,139Master's degree: 1,917Professional school degree: 242Doctorate degree: 321
Housing units in structures:
One, detached: 22,952One, attached: 1,646Two: 2,0043 or 4: 2,3775 to 9: 1,06510 to 19: 1,52120 to 49: 1,58750 or more: 1,863Mobile homes: 1,773Boats, RVs, vans, etc.: 347Median worth of mobile homes: $41,878
Housing units lacking complete plumbing facilities in 2022: 0.5%Housing units lacking complete kitchen facilities in 2022: 3.0%House/condo owner moved in on average 11 years ago
Renter moved in on average 3 years ago
Private vs. public school enrollment:
Students in private schools in grades 1 to 8 (elementary and middle school): 1,342 Here:
13.6%Washington:
12.4%
Students in private schools in grades 9 to 12 (high school): 385 Students in private undergraduate colleges: 411 Here:
14.3%Washington:
16.5%