Races in Yakima, Washington (WA) Detailed Stats
Data:
Races - White alone (%)
Races - White alone (% change since 2000)
Races - Black alone (%)
Races - Black alone (% change since 2000)
Races - American Indian alone (%)
Races - American Indian alone (% change since 2000)
Races - Asian alone (%)
Races - Asian alone (% change since 2000)
Races - Hispanic (%)
Races - Hispanic (% change since 2000)
Races - Native Hawaiian and Other Pacific Islander alone (%)
Races - Native Hawaiian and Other Pacific Islander alone (% change since 2000)
Races - Two or more races(%)
Races - Two or more races(% change since 2000)
Races - Other race alone (%)
Races - Other race alone (% change since 2000)
Racial diversity
Place of birth - Born in state of residence (%)
Place of birth - Born in state of residence (%) - White
Place of birth - Born in state of residence (%) - Black or African American
Place of birth - Born in state of residence (%) - Asian
Place of birth - Born in state of residence (%) - Hispanic or Latino
Place of birth - Born in state of residence (%) - American Indian and Alaska Native
Place of birth - Born in state of residence (%) - Multirace
Place of birth - Born in state of residence (%) - Other Race
Place of birth - Born in other state (%)
Place of birth - Born in other state (%) - White
Place of birth - Born in other state (%) - Black or African American
Place of birth - Born in other state (%) - Asian
Place of birth - Born in other state (%) - Hispanic or Latino
Place of birth - Born in other state (%) - American Indian and Alaska Native
Place of birth - Born in other state (%) - Multirace
Place of birth - Born in other state (%) - Other Race
Place of birth - Native, outside of US (%)
Place of birth - Native, outside of US (%) - White
Place of birth - Native, outside of US (%) - Black or African American
Place of birth - Native, outside of US (%) - Asian
Place of birth - Native, outside of US (%) - Hispanic or Latino
Place of birth - Native, outside of US (%) - American Indian and Alaska Native
Place of birth - Native, outside of US (%) - Multirace
Place of birth - Native, outside of US (%) - Other Race
Place of birth - Foreign born (%)
Place of birth - Foreign born (%) - White
Place of birth - Foreign born (%) - Black or African American
Place of birth - Foreign born (%) - Asian
Place of birth - Foreign born (%) - Hispanic or Latino
Place of birth - Foreign born (%) - American Indian and Alaska Native
Place of birth - Foreign born (%) - Multirace
Place of birth - Foreign born (%) - Other Race
Residents speaking English at home (%)
Residents speaking English at home - Born in the United States (%)
Residents speaking English at home - Native, born elsewhere (%)
Residents speaking English at home - Foreign born (%)
Residents speaking Spanish at home (%)
Residents speaking Spanish at home - Born in the United States (%)
Residents speaking Spanish at home - Native, born elsewhere (%)
Residents speaking Spanish at home - Foreign born (%)
Residents speaking other language at home (%)
Residents speaking other language at home - Born in the United States (%)
Residents speaking other language at home - Native, born elsewhere (%)
Residents speaking other language at home - Foreign born (%)
Marital status - Never married (%)
Marital status - Now married (%)
Marital status - Separated (%)
Marital status - Widowed (%)
Marital status - Divorced (%)
Ancestries Reported - Arab (%)
Ancestries Reported - Czech (%)
Ancestries Reported - Danish (%)
Ancestries Reported - Dutch (%)
Ancestries Reported - English (%)
Ancestries Reported - French (%)
Ancestries Reported - French Canadian (%)
Ancestries Reported - German (%)
Ancestries Reported - Greek (%)
Ancestries Reported - Hungarian (%)
Ancestries Reported - Irish (%)
Ancestries Reported - Italian (%)
Ancestries Reported - Lithuanian (%)
Ancestries Reported - Norwegian (%)
Ancestries Reported - Polish (%)
Ancestries Reported - Portuguese (%)
Ancestries Reported - Russian (%)
Ancestries Reported - Scotch-Irish (%)
Ancestries Reported - Scottish (%)
Ancestries Reported - Slovak (%)
Ancestries Reported - Subsaharan African (%)
Ancestries Reported - Swedish (%)
Ancestries Reported - Swiss (%)
Ancestries Reported - Ukrainian (%)
Ancestries Reported - United States (%)
Ancestries Reported - Welsh (%)
Ancestries Reported - West Indian (%)
Ancestries Reported - Other (%)
Geographical mobility - Same house 1 year ago (%)
Geographical mobility - Same house 1 year ago (%) - White
Geographical mobility - Same house 1 year ago (%) - Black or African American
Geographical mobility - Same house 1 year ago (%) - Asian
Geographical mobility - Same house 1 year ago (%) - Hispanic or Latino
Geographical mobility - Same house 1 year ago (%) - American Indian and Alaska Native
Geographical mobility - Same house 1 year ago (%) - Multirace
Geographical mobility - Same house 1 year ago (%) - Other Race
Geographical mobility - Moved within same county (%)
Geographical mobility - Moved within same county (%) - White
Geographical mobility - Moved within same county (%) - Black or African American
Geographical mobility - Moved within same county (%) - Asian
Geographical mobility - Moved within same county (%) - Hispanic or Latino
Geographical mobility - Moved within same county (%) - American Indian and Alaska Native
Geographical mobility - Moved within same county (%) - Multirace
Geographical mobility - Moved within same county (%) - Other Race
Geographical mobility - Moved from different county within same state (%)
Geographical mobility - Moved from different county within same state (%) - White
Geographical mobility - Moved from different county within same state (%) - Black or African American
Geographical mobility - Moved from different county within same state (%) - Asian
Geographical mobility - Moved from different county within same state (%) - Hispanic or Latino
Geographical mobility - Moved from different county within same state (%) - American Indian and Alaska Native
Geographical mobility - Moved from different county within same state (%) - Multirace
Geographical mobility - Moved from different county within same state (%) - Other Race
Geographical mobility - Moved from different state (%)
Geographical mobility - Moved from different state (%) - White
Geographical mobility - Moved from different state (%) - Black or African American
Geographical mobility - Moved from different state (%) - Asian
Geographical mobility - Moved from different state (%) - Hispanic or Latino
Geographical mobility - Moved from different state (%) - American Indian and Alaska Native
Geographical mobility - Moved from different state (%) - Multirace
Geographical mobility - Moved from different state (%) - Other Race
Geographical mobility - Moved from abroad (%)
Geographical mobility - Moved from abroad (%) - White
Geographical mobility - Moved from abroad (%) - Black or African American
Geographical mobility - Moved from abroad (%) - Asian
Geographical mobility - Moved from abroad (%) - Hispanic or Latino
Geographical mobility - Moved from abroad (%) - American Indian and Alaska Native
Geographical mobility - Moved from abroad (%) - Multirace
Geographical mobility - Moved from abroad (%) - Other Race
Place of birth for the foreign-born population - Ireland (%)
Place of birth for the foreign-born population - Denmark (%)
Place of birth for the foreign-born population - Norway (%)
Place of birth for the foreign-born population - Sweden (%)
Place of birth for the foreign-born population - United Kingdom (%)
Place of birth for the foreign-born population - England (%)
Place of birth for the foreign-born population - Scotland (%)
Place of birth for the foreign-born population - Other Northern Europe (%)
Place of birth for the foreign-born population - Austria (%)
Place of birth for the foreign-born population - Belgium (%)
Place of birth for the foreign-born population - France (%)
Place of birth for the foreign-born population - Germany (%)
Place of birth for the foreign-born population - Netherlands (%)
Place of birth for the foreign-born population - Switzerland (%)
Place of birth for the foreign-born population - Other Western Europe (%)
Place of birth for the foreign-born population - Greece (%)
Place of birth for the foreign-born population - Italy (%)
Place of birth for the foreign-born population - Portugal (%)
Place of birth for the foreign-born population - Spain (%)
Place of birth for the foreign-born population - Other Southern Europe (%)
Place of birth for the foreign-born population - Albania (%)
Place of birth for the foreign-born population - Belarus (%)
Place of birth for the foreign-born population - Bosnia and Herzegovina (%)
Place of birth for the foreign-born population - Bulgaria (%)
Place of birth for the foreign-born population - Croatia (%)
Place of birth for the foreign-born population - Czechoslovakia (%)
Place of birth for the foreign-born population - Hungary (%)
Place of birth for the foreign-born population - Latvia (%)
Place of birth for the foreign-born population - Lithuania (%)
Place of birth for the foreign-born population - North Macedonia (Macedonia) (%)
Place of birth for the foreign-born population - Moldova (%)
Place of birth for the foreign-born population - Poland (%)
Place of birth for the foreign-born population - Romania (%)
Place of birth for the foreign-born population - Russia (%)
Place of birth for the foreign-born population - Serbia (%)
Place of birth for the foreign-born population - Ukraine (%)
Place of birth for the foreign-born population - Other Eastern Europe (%)
Place of birth for the foreign-born population - China (%)
Place of birth for the foreign-born population - Hong Kong (%)
Place of birth for the foreign-born population - Taiwan (%)
Place of birth for the foreign-born population - Japan (%)
Place of birth for the foreign-born population - Korea (%)
Place of birth for the foreign-born population - Other Eastern Asia (%)
Place of birth for the foreign-born population - Afghanistan (%)
Place of birth for the foreign-born population - Bangladesh (%)
Place of birth for the foreign-born population - India (%)
Place of birth for the foreign-born population - Iran (%)
Place of birth for the foreign-born population - Kazakhstan (%)
Place of birth for the foreign-born population - Nepal (%)
Place of birth for the foreign-born population - Pakistan (%)
Place of birth for the foreign-born population - Sri Lanka (%)
Place of birth for the foreign-born population - Uzbekistan (%)
Place of birth for the foreign-born population - Other South Central Asia (%)
Place of birth for the foreign-born population - Burma (%)
Place of birth for the foreign-born population - Cambodia (%)
Place of birth for the foreign-born population - Indonesia (%)
Place of birth for the foreign-born population - Laos (%)
Place of birth for the foreign-born population - Malaysia (%)
Place of birth for the foreign-born population - Philippines (%)
Place of birth for the foreign-born population - Singapore (%)
Place of birth for the foreign-born population - Thailand (%)
Place of birth for the foreign-born population - Vietnam (%)
Place of birth for the foreign-born population - Other South Eastern Asia (%)
Place of birth for the foreign-born population - Armenia (%)
Place of birth for the foreign-born population - Iraq (%)
Place of birth for the foreign-born population - Israel (%)
Place of birth for the foreign-born population - Jordan (%)
Place of birth for the foreign-born population - Kuwait (%)
Place of birth for the foreign-born population - Lebanon (%)
Place of birth for the foreign-born population - Saudi Arabia (%)
Place of birth for the foreign-born population - Syria (%)
Place of birth for the foreign-born population - Turkey (%)
Place of birth for the foreign-born population - Yemen (%)
Place of birth for the foreign-born population - Other Western Asia (%)
Place of birth for the foreign-born population - Eritrea (%)
Place of birth for the foreign-born population - Ethiopia (%)
Place of birth for the foreign-born population - Kenya (%)
Place of birth for the foreign-born population - Somalia (%)
Place of birth for the foreign-born population - Uganda (%)
Place of birth for the foreign-born population - Zimbabwe (%)
Place of birth for the foreign-born population - Other Eastern Africa (%)
Place of birth for the foreign-born population - Cameroon (%)
Place of birth for the foreign-born population - Congo (%)
Place of birth for the foreign-born population - Democratic Republic of Congo (Zaire) (%)
Place of birth for the foreign-born population - Other Middle Africa (%)
Place of birth for the foreign-born population - Egypt (%)
Place of birth for the foreign-born population - Morocco (%)
Place of birth for the foreign-born population - Sudan (%)
Place of birth for the foreign-born population - Other Northern Africa (%)
Place of birth for the foreign-born population - South Africa (%)
Place of birth for the foreign-born population - Other Southern Africa (%)
Place of birth for the foreign-born population - Cabo Verde (%)
Place of birth for the foreign-born population - Ghana (%)
Place of birth for the foreign-born population - Liberia (%)
Place of birth for the foreign-born population - Nigeria (%)
Place of birth for the foreign-born population - Senegal (%)
Place of birth for the foreign-born population - Sierra Leone (%)
Place of birth for the foreign-born population - Other Western Africa (%)
Place of birth for the foreign-born population - Australia (%)
Place of birth for the foreign-born population - New Zealand (%)
Place of birth for the foreign-born population - Fiji (%)
Place of birth for the foreign-born population - Micronesia (%)
Place of birth for the foreign-born population - Bahamas (%)
Place of birth for the foreign-born population - Barbados (%)
Place of birth for the foreign-born population - Cuba (%)
Place of birth for the foreign-born population - Dominica (%)
Place of birth for the foreign-born population - Dominican Republic (%)
Place of birth for the foreign-born population - Grenada (%)
Place of birth for the foreign-born population - Haiti (%)
Place of birth for the foreign-born population - Jamaica (%)
Place of birth for the foreign-born population - St. Vincent and the Grenadines (%)
Place of birth for the foreign-born population - Trinidad and Tobago (%)
Place of birth for the foreign-born population - West Indies (%)
Place of birth for the foreign-born population - Other Caribbean (%)
Place of birth for the foreign-born population - Belize (%)
Place of birth for the foreign-born population - Costa Rica (%)
Place of birth for the foreign-born population - El Salvador (%)
Place of birth for the foreign-born population - Guatemala (%)
Place of birth for the foreign-born population - Honduras (%)
Place of birth for the foreign-born population - Mexico (%)
Place of birth for the foreign-born population - Nicaragua (%)
Place of birth for the foreign-born population - Panama (%)
Place of birth for the foreign-born population - Other Central America (%)
Place of birth for the foreign-born population - Argentina (%)
Place of birth for the foreign-born population - Bolivia (%)
Place of birth for the foreign-born population - Brazil (%)
Place of birth for the foreign-born population - Chile (%)
Place of birth for the foreign-born population - Colombia (%)
Place of birth for the foreign-born population - Ecuador (%)
Place of birth for the foreign-born population - Guyana (%)
Place of birth for the foreign-born population - Peru (%)
Place of birth for the foreign-born population - Uruguay (%)
Place of birth for the foreign-born population - Venezuela (%)
Place of birth for the foreign-born population - Other South America (%)
Place of birth for the foreign-born population - Canada (%)
Place of birth for the foreign-born population - Other Northern America (%)
Place of birth for the foreign-born population - Other (%)
Latest news about races in Yakima, WA collected exclusively by city-data.com from local newspapers, TV, and radio stations
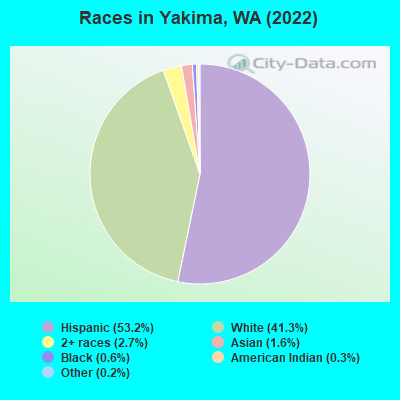
According to 2022 data, the most numerous races in Yakima, WA are White alone (40,058 residents), Hispanic (51,633 residents), and Asian alone (1,554 residents). 58.3% of Yakima residents speak English at home. 17.8% of Yakima, WA residents are foreign-born (15.5% born in Latin America), which is 15.8% greater than the foreign-born rate of 15.0% across the entire state of Washington.
Race distribution in Yakima
2000 2022
4,652,490 78.9% White alone 441,509 7.5% Hispanic 319,401 5.4% Asian alone 184,631 3.1% Black alone 175,926 3.0% Two or more races 85,396 1.4% American Indian alone 22,779 0.4% Native Hawaiian and Other 11,989 0.2% Other race alone
4,941,456 63.5% White alone 1,093,313 14.0% Hispanic 755,832 9.7% Asian alone 523,448 6.7% Two or more races 299,537 3.8% Black alone 69,024 0.9% American Indian alone 52,231 0.7% Native Hawaiian and Other 50,945 0.7% Other race alone
Income and house value in Yakima Median household income in 2022 $63,361 White non-Hispanic householders$89,217 Asian householders$63,294 Some other race householders$48,767 Two or more races householders$55,416 Hispanic or Latino race householdersMedian 2022 house value $328,269 White Non-Hispanic householders$231,635 Black or African American householders$329,690 American Indian or Alaska Native householders $292,742 Asian householders$390,796 Native Hawaiian and other Pacific Islander householders$232,204 Some other race householders$215,719 Two or more races householders$235,330 Hispanic or Latino householders
Median age by race in Yakima
48.8 Median age for White residents44.9 53.9 34.5 Median age for Black or African American residents31.4 36.7 29.1 Median age for American Indian / Alaska Native residents26.2 30.2 44.9 Median age for Asian residents48.3 42.8 -666,666,666.0 Median age for Native Hawaiian / Pacific Islander residents-666,666,666.0 -666,666,666.0 29.4 Median age for Other race residents27.8 29.5 25.5 Median age for Two or more races residents22.7 28.2 50.8 Median age for White alone residents47.2 54.7 25.8 Median age for Hispanic or Latino residents23.5 28.2
Owner/renter occupied households by race in Yakima
House owners and renters - White residents 13,392 65.3% Owner occupied7,104 34.7% Renter occupiedHouse owners and renters - Black or African American residents 157 34.8% Owner occupied294 65.2% Renter occupiedHouse owners and renters - American Indian / Alaska Native residents 137 28.2% Owner occupied348 71.8% Renter occupiedHouse owners and renters - Asian residents 539 86.8% Owner occupied82 13.2% Renter occupiedHouse owners and renters - Native Hawaiian / Pacific Islander residents 43 37.5% Owner occupied71 62.5% Renter occupiedHouse owners and renters - Other race residents 2,438 51.0% Owner occupied2,342 49.0% Renter occupiedHouse owners and renters - Two or more races residents 2,676 28.2% Owner occupied6,828 71.8% Renter occupiedHouse owners and renters - White alone residents 12,507 65.0% Owner occupied6,738 35.0% Renter occupiedHouse owners and renters - Hispanic or Latino residents 5,795 40.3% Owner occupied8,600 59.7% Renter occupied
Language usage in Yakima
English speakers - Total 58.3% of residents of Yakima speak English at home.
40.2% of residents speak Spanish at home 20,350 57.6% Speak English very well14,954 42.4% Speak English less than very well1.4% of residents speak other language at home 1,004 79.4% Speak English very well261 20.6% Speak English less than very well
English speakers - Born in the United States 73.8% of residents of Yakima speak English at home.
24.9% of residents speak Spanish at home 3,872 91.7% Speak English very well352 8.3% Speak English less than very well1.3% of residents speak other language at home 170 78.0% Speak English very well48 22.0% Speak English less than very well
English speakers - Native, born elsewhere 24.4% of residents of Yakima speak English at home.
73.2% of residents speak Spanish at home 407 34.5% Speak English very well774 65.5% Speak English less than very well2.4% of residents speak other language at home 39 100.0% Speak English very well
English speakers - Foreign-born 10.5% of residents of Yakima speak English at home.
85.3% of residents speak Spanish at home 5,066 32.3% Speak English very well10,606 67.7% Speak English less than very well4.2% of residents speak other language at home 558 72.4% Speak English very well213 27.6% Speak English less than very well
White (Caucasian) - Speak only English Native:
95.7% (38,733)Foreign-born:
73.2% (805)
White (Caucasian) - Speak another language Native:
4.3% (1,738)Foreign-born:
26.8% (294)
Black or African American - Speak only English Native:
84.4% (903)Foreign-born:
91.1% (183)
Black or African American - Speak another language Native:
14.3% (153)Foreign-born:
18.0% (36)
American Indian / Alaska Native - Speak another language Native:
27.7% (357)Foreign-born:
53.8% (171)
Asian - Speak only English Native:
85.5% (548)Foreign-born:
25.2% (230)
Asian - Speak another language Native:
14.5% (93)Foreign-born:
74.8% (683)
Native Hawaiian / Pacific Islander - Speak only English Native:
70.4% (343)Foreign-born:
27.2% (65)
Native Hawaiian / Pacific Islander - Speak another language Native:
27.5% (134)Foreign-born:
73.3% (176)
Other race - Speak only English Native:
22.1% (1,850)Foreign-born:
7.8% (535)
Other race - Speak another language Native:
77.9% (6,525)Foreign-born:
92.2% (6,298)
Two or more races - Speak only English Native:
37.2% (6,866)Foreign-born:
3.9% (361)
Two or more races - Speak another language Native:
62.8% (11,598)Foreign-born:
96.1% (8,952)
White alone - Speak only English Native:
97.2% (38,528)Foreign-born:
48.2% (352)
White alone - Speak another language Native:
2.8% (1,092)Foreign-born:
52.2% (381)
Hispanic or Latino - Speak only English Native:
32.6% (9,069)Foreign-born:
5.8% (973)
Hispanic or Latino - Speak another language Native:
67.4% (18,736)Foreign-born:
94.2% (15,672)
Foreign-born residents in Yakima 17,303 residents are foreign born (15.5% Latin America ).
This city:
17.8%Washington:
14.9%
Marital status for residents in Yakima Marital status - White (Caucasian) population 15 years and over
Males 35.1% Never married43.8% Now married0.9% Separated3.6% Widowed16.6% DivorcedFemales 27.2% Never married40.0% Now married1.4% Separated15.0% Widowed16.5% DivorcedWomen who gave birth in the past 12 months Now married:
100.0% (576)Unmarried:
0.0% (0)
Women who did not give birth in the past 12 months Now married:
27.1% (2,105)Unmarried:
72.9% (5,675)
Marital status - Black or African American population 15 years and over
Males 49.1% Never married28.0% Now married3.0% Separated0.3% Widowed19.6% DivorcedFemales 37.2% Never married37.9% Now married7.7% Separated14.5% Widowed2.7% DivorcedWomen who gave birth in the past 12 months Now married:
0.0% (0)Unmarried:
100.0% (68)
Women who did not give birth in the past 12 months Now married:
69.1% (141)Unmarried:
30.9% (63)
Marital status - American Indian / Alaska Native population 15 years and over
Males 36.3% Never married38.5% Now married3.3% Separated0.0% Widowed22.0% DivorcedFemales 35.8% Never married35.6% Now married4.2% Separated3.6% Widowed20.8% DivorcedWomen who gave birth in the past 12 months Now married:
0.0% (0)Unmarried:
100.0% (46)
Women who did not give birth in the past 12 months Now married:
37.2% (185)Unmarried:
62.8% (313)
Marital status - Asian population 15 years and over
Males 35.7% Never married58.1% Now married0.0% Separated0.0% Widowed6.2% DivorcedFemales 7.7% Never married77.1% Now married0.0% Separated4.6% Widowed10.6% DivorcedWomen who gave birth in the past 12 months Now married:
100.0% (29)Unmarried:
0.0% (0)
Women who did not give birth in the past 12 months Now married:
88.2% (276)Unmarried:
11.8% (37)
Marital status - Native Hawaiian / Pacific Islander population 15 years and over
Males 71.1% Never married19.5% Now married9.5% Separated0.0% Widowed0.0% DivorcedFemales 44.0% Never married21.3% Now married11.3% Separated0.0% Widowed23.4% DivorcedWomen who did not give birth in the past 12 months Now married:
42.6% (49)Unmarried:
57.4% (67)
Marital status - Other race population 15 years and over
Males 45.8% Never married46.8% Now married0.0% Separated0.0% Widowed7.4% DivorcedFemales 43.7% Never married42.0% Now married6.7% Separated5.5% Widowed2.1% DivorcedWomen who gave birth in the past 12 months Now married:
97.9% (332)Unmarried:
2.1% (7)
Women who did not give birth in the past 12 months Now married:
37.9% (1,528)Unmarried:
62.1% (2,502)
Marital status - Two or more races population 15 years and over
Males 54.7% Never married30.0% Now married2.0% Separated3.6% Widowed9.7% DivorcedFemales 52.5% Never married23.5% Now married9.1% Separated3.2% Widowed11.7% DivorcedWomen who gave birth in the past 12 months Now married:
13.3% (92)Unmarried:
86.7% (598)
Women who did not give birth in the past 12 months Now married:
28.5% (2,277)Unmarried:
71.5% (5,720)
Marital status - White alone, not Hispanic / Latino population 15 years and over
Males 32.8% Never married44.8% Now married0.9% Separated3.9% Widowed17.6% DivorcedFemales 25.2% Never married39.7% Now married1.5% Separated16.0% Widowed17.6% DivorcedWomen who gave birth in the past 12 months Now married:
100.0% (524)Unmarried:
0.0% (0)
Women who did not give birth in the past 12 months Now married:
29.4% (2,070)Unmarried:
70.6% (4,974)
Marital status - Hispanic or Latino population 15 years and over
Males 54.1% Never married35.0% Now married1.2% Separated2.2% Widowed7.6% DivorcedFemales 50.6% Never married31.9% Now married8.2% Separated3.3% Widowed6.0% DivorcedWomen who gave birth in the past 12 months Now married:
44.0% (476)Unmarried:
56.0% (605)
Women who did not give birth in the past 12 months Now married:
31.3% (3,727)Unmarried:
68.7% (8,172)
Ancestries in Yakima
4,009 6.8% German2,859 4.9% American2,642 4.5% English2,086 3.5% European1,450 2.5% Irish545 0.9% Norwegian508 0.9% British360 0.6% African351 0.6% Italian330 0.6% Dutch297 0.5% Swedish265 0.4% Scottish241 0.4% French206 0.3% Scandinavian187 0.3% Scotch-Irish170 0.3% Danish117 0.2% Swiss104 0.2% French Canadian104 0.2% Canadian89 0.2% Ukrainian57 0.10% Russian53 0.09% Israeli51 0.09% Polish40 0.07% Finnish40 0.07% Czech37 0.06% Welsh32 0.05% Portuguese32 0.05% Brazilian27 0.05% Turkish26 0.04% Hungarian23 0.04% Eastern European18 0.03% Lebanese18 0.03% Basque17 0.03% Northern European16 0.03% Maltese16 0.03% Czechoslovakian15 0.03% Romanian12 0.02% Arab11 0.02% Bulgarian10 0.02% Iranian10 0.02% Belgian9 0.02% Celtic7 0.01% Greek7 0.01% Ethiopian6 0.01% Croatian
Geographical mobility in Yakima Same house 1 year ago 38,665 89.1% White (Caucasian)869 68.6% Black or African American1,178 78.4% American Indian / Alaska Native1,330 85.6% Asian747 90.4% Native Hawaiian / Pacific Islander17,171 87.0% Other race25,302 77.2% Two or more races35,781 89.3% White alone, not Hispanic / Latino41,604 82.5% Hispanic or LatinoMoved within same county 3,155 7.3% White / Caucasian109 8.6% Black or African American200 13.3% American Indian / Alaska Native93 6.0% Asian80 9.7% Native Hawaiian / Pacific Islander1,862 9.4% Other race6,710 20.5% Two or more races2,718 6.8% White alone, not Hispanic / Latino7,796 15.5% Hispanic or LatinoMoved within same state 1,104 2.5% White / Caucasian29 2.3% Black or African American42 2.8% American Indian / Alaska Native51 3.3% Asian9 1.1% Native Hawaiian / Pacific Islander244 1.2% Other race434 1.3% Two or more races1,104 2.8% White alone, not Hispanic / Latino632 1.3% Hispanic or LatinoMoved from different state 455 1.0% White / Caucasian247 19.5% Black or African American16 1.1% American Indian / Alaska Native80 5.1% Asian189 1.0% Other race12 0.0% Two or more races455 1.1% White alone, not Hispanic / Latino120 0.2% Hispanic or LatinoMoved from abroad 23 1.8% Black or African American71 0.4% Other race322 1.0% Two or more races255 0.5% Hispanic or Latino
Children Nativity (place of birth) in Yakima
Children under 6 years - Living with two parents Both parents native 2,417 100.0% NativeBoth parents foreign-born 1,357 100.0% NativeOne native, one foreign-born parent 1,103 100.0% NativeChildren under 6 years - Living with one parent Native parent 2,881 100.0% NativeForeign-born parent 1,888 79.1% Native498 20.9% Foreign-bornChildren 6 to 17 years - Living with two parents Both parents native 2,921 99.3% Native21 0.7% Foreign-bornBoth parents foreign-born 3,346 100.0% NativeOne native, one foreign-born parent 1,553 87.7% Native218 12.3% Foreign-bornChildren 6 to 17 years - Living with one parent Native parent 4,711 100.0% NativeForeign-born parent 2,748 51.7% Native2,563 48.3% Foreign-born
Grandparents responsible for own grandchildren in Yakima
Grandparents (30 to 59 years) White / Caucasian 141 47.7% Responsible for grandchildren155 52.3% Not responsible for grandchildrenBlack or African American 7 100.0% Not responsible for grandchildrenNative Hawaiian / Pacific Islander 70 100.0% Responsible for grandchildrenOther race 24 15.1% Responsible for grandchildren133 84.9% Not responsible for grandchildrenTwo or more races 67 30.5% Responsible for grandchildren152 69.5% Not responsible for grandchildrenWhite alone, not Hispanic / Latino 106 49.7% Responsible for grandchildren107 50.3% Not responsible for grandchildrenHispanic or Latino 54 15.8% Responsible for grandchildren287 84.2% Not responsible for grandchildrenGrandparents (60 years and over) White / Caucasian 78 14.3% Responsible for grandchildren465 85.7% Not responsible for grandchildrenBlack or African American 22 100.0% Not responsible for grandchildrenNative Hawaiian / Pacific Islander 40 100.0% Not responsible for grandchildrenOther race 85 42.0% Responsible for grandchildren117 58.0% Not responsible for grandchildrenTwo or more races 80 34.9% Responsible for grandchildren150 65.1% Not responsible for grandchildrenWhite alone, not Hispanic / Latino 85 12.7% Responsible for grandchildren586 87.3% Not responsible for grandchildrenHispanic or Latino 112 29.7% Responsible for grandchildren265 70.3% Not responsible for grandchildren