West Melbourne, FL (Florida) Houses and Residents
| West Melbourne: | $371,086 |
| Florida: | $354,100 |
Mean price in 2022:
Detached houses: $402,409
Here: $402,409 State: $500,941 Townhouses or other attached units: $343,667
Here: $343,667 State: $370,869 In 3-to-4-unit structures: $169,149
Here: $169,149 State: $309,944 In 5-or-more-unit structures: $149,188
Here: $149,188 State: $447,145 Mobile homes: $59,977
Here: $59,977 State: $113,202
Total population: 20,078 (Urban population: 9,749, Rural population: 0)
Houses: 11,196 (10,282 occupied: 8,119 owner occupied, 2,228 renter occupied)
| % of renters here: | 22% |
| State: | 33% |
Housing density: 1,431 houses/condos per square mile
Median price asked for vacant for-sale houses and condos in 2022: $900,947.
Median contract rent in 2022: $1,727 (lower quartile is $1,239, upper quartile is over $2,000)
Median rent asked for vacant for-rent units in 2022: $1,876
Median gross rent in West Melbourne, FL in 2022: $1,806
Housing units in West Melbourne with a mortgage: 5,235 (494 second mortgage, 0 home equity loan, 416 both second mortgage and home equity loan)
Houses without a mortgage: 125
Median household income for houses/condos with a mortgage: $114,726
Median household income for apartments without a mortgage: $71,052
Median monthly housing costs: $1,499
Compare current foreclosures near West Melbourne, FL:
| Photo | Address | Area | Beds / Baths | Price | Details |
|---|---|---|---|---|---|

|
#1
Heather Ave NE
Palm Bay, FL 32907
|
1,569 sq. feet
|
2 baths 3 beds |
$300,000
|
show details |

|
#2
Snapdragon Dr NW
Palm Bay, FL 32907
|
2,862 sq. feet
|
2 baths 4 beds |
show details | |

|
#3
Academy St NE
Palm Bay, FL 32905
|
1,793 sq. feet
|
2 baths 3 beds |
show details | |

|
#4
Meadowwood Ct
Melbourne, FL 32935
|
968 sq. feet
|
2 baths 2 beds |
show details | |

|
#5
Schooner Dr
Merritt Island, FL 32952
|
2,176 sq. feet
|
2 baths 3 beds |
show details | |

|
#6
N Sylvan Ln
Melbourne, FL 32935
|
2,172 sq. feet
|
2 baths 3 beds |
show details | |

|
#7
Riviera Dr NE
Palm Bay, FL 32905
|
1,940 sq. feet
|
3 baths 4 beds |
show details | |

|
#8
Broomsedge Circle
Melbourne, FL 32904
|
3,350 sq. feet
|
2 baths 4 beds |
show details | |

|
#9
Chicory Ave NE
Palm Bay, FL 32907
|
2,083 sq. feet
|
2 baths 4 beds |
show details | |

|
#10
Chipper Dr NE
Palm Bay, FL 32905
|
1,286 sq. feet
|
1 baths 3 beds |
show details |
| Photo | Address | Area | Beds / Baths | Price | Details |
|---|---|---|---|---|---|

|
#11
Manor Dr NE
Palm Bay, FL 32905
|
1,496 sq. feet
|
2 baths 2 beds |
show details | |

|
#12
Coastal Hill Dr
Satellite Beach, FL 32937
|
1,965 sq. feet
|
3 baths 3 beds |
show details | |

|
#13
Tangelo Dr NE
Palm Bay, FL 32905
|
720 sq. feet
|
1 baths 1 beds |
show details | |

|
#14
Bermuda Ct NW
Palm Bay, FL 32907
|
2,047 sq. feet
|
2 baths 3 beds |
show details | |

|
#15
Hampton Dr NE
Palm Bay, FL 32905
|
1,286 sq. feet
|
2 baths 3 beds |
show details | |

|
#16
Alesio Ave SE
Palm Bay, FL 32909
|
1,649 sq. feet
|
2 baths 3 beds |
show details | |

|
#17
Brunswick Ln
Rockledge, FL 32955
|
1,392 sq. feet
|
2 baths 3 beds |
show details | |

|
#18
Edwards St NE
Palm Bay, FL 32905
|
1,286 sq. feet
|
1 baths 3 beds |
show details | |

|
#19
Campus Cir
Melbourne, FL 32935
|
1,368 sq. feet
|
2 baths 3 beds |
show details | |

|
#20
Sylvia Rd
Melbourne, FL 32904
|
1,692 sq. feet
|
2 baths 4 beds |
show details |
| Photo | Address | Area | Beds / Baths | Price | Details |
|---|---|---|---|---|---|

|
#21
Atlantic Blvd
Satellite Beach, FL 32937
|
1,220 sq. feet
|
2 baths 3 beds |
show details | |

|
#22
Murset Ave SE
Palm Bay, FL 32909
|
1,783 sq. feet
|
2 baths 3 beds |
show details | |

|
#23
Ponkapoag Way
Satellite Beach, FL 32937
|
1,222 sq. feet
|
2 baths 3 beds |
show details | |

|
#24
Badger Dr NE
Palm Bay, FL 32905
|
1,303 sq. feet
|
2 baths 3 beds |
show details | |

|
#25
Eastman Ave NE
Palm Bay, FL 32905
|
1,059 sq. feet
|
2 baths 2 beds |
show details | |

|
#26
Cloverleaf Ave SE
Palm Bay, FL 32909
|
1,134 sq. feet
|
2 baths 3 beds |
show details | |

|
#27
Sunrise Ave
Satellite Beach, FL 32937
|
1,734 sq. feet
|
2 baths 3 beds |
show details | |

|
#28
Hanson Ave SW
Palm Bay, FL 32908
|
1,438 sq. feet
|
2 baths 3 beds |
show details | |

|
#29
Seven Gables Cir SE
Palm Bay, FL 32909
|
1,909 sq. feet
|
2 baths 4 beds |
show details | |

|
#30
Slone Blvd
Melbourne, FL 32935
|
1,481 sq. feet
|
2 baths 3 beds |
show details |
| Photo | Address | Area | Beds / Baths | Price | Details |
|---|---|---|---|---|---|

|
#31
Sand Pine Rd
Indialantic, FL 32903
|
2,793 sq. feet
|
2 baths 3 beds |
show details | |

|
#32
Wading Bird Cir SW
Palm Bay, FL 32908
|
3,736 sq. feet
|
3 baths 5 beds |
show details | |

|
#33
Algeria St NE
Palm Bay, FL 32905
|
1,881 sq. feet
|
2 baths 3 beds |
show details | |

|
#34
Melissa Ct
Melbourne, FL 32934
|
1,837 sq. feet
|
2 baths 3 beds |
show details | |

|
#35
Benchor Rd NW
Palm Bay, FL 32907
|
2,083 sq. feet
|
2 baths 4 beds |
show details | |

|
#36
Chicory Ave NE
Palm Bay, FL 32907
|
1,586 sq. feet
|
2 baths 3 beds |
show details | |

|
#37
Emerson Dr NE
Palm Bay, FL 32907
|
1,336 sq. feet
|
2 baths 3 beds |
show details | |

|
#38
Riley Ave NE
Palm Bay, FL 32907
|
1,706 sq. feet
|
2 baths 4 beds |
show details | |

|
#39
Advana St NE
Palm Bay, FL 32905
|
2,370 sq. feet
|
2 baths 3 beds |
show details | |

|
#40
Emerson Dr NE
Palm Bay, FL 32907
|
1,814 sq. feet
|
2 baths 3 beds |
show details |
| Photo | Address | Area | Beds / Baths | Price | Details |
|---|---|---|---|---|---|

|
#41
Golden Dove Ave NE
Palm Bay, FL 32907
|
1,872 sq. feet
|
2 baths 3 beds |
show details | |

|
#42
Haverford Ln NE
Palm Bay, FL 32907
|
2,284 sq. feet
|
3 baths 4 beds |
show details | |

|
#43
Dobbins Rd NW
Palm Bay, FL 32907
|
1,100 sq. feet
|
2 baths 3 beds |
show details | |

|
#44
Dacotah Ave NE
Palm Bay, FL 32905
|
837 sq. feet
|
1 baths 2 beds |
show details | |

|
#45
Heather Ave NE
Palm Bay, FL 32907
|
1,727 sq. feet
|
3 baths 4 beds |
show details | |

|
#46
Airview Ave NE
Palm Bay, FL 32907
|
1,208 sq. feet
|
2 baths 3 beds |
show details | |

|
#47
Beekman St NE
Palm Bay, FL 32905
|
1,639 sq. feet
|
2 baths 3 beds |
show details | |

|
#48
Battersea Ave SE
Palm Bay, FL 32909
|
1,200 sq. feet
|
2 baths 3 beds |
show details | |

|
#49
Seabreeze Dr
Indialantic, FL 32903
|
3,471 sq. feet
|
3 baths 5 beds |
show details | |

|
Check over 1 million property listings on Foreclosure.com!
|
browse all offers | |||


 | What is currently going on with the real estate market in Brevard? (333 replies) |
| Homes off of 192 near police foundation park? (3 replies) |
| Tree nursery with home delivery? (0 replies) |
| Considering Palm Bay , Pros and cons? (34 replies) |
| My family's recent survey of Brevard County schools and homes (24 replies) |
| Viera vs. West Melbourne (2 replies) |
Median year apartment built: 2002
Household type by relationship:
Households: 27,637- Male householders: 4,526 (1,241 living alone), Female householders: 5,780 (1,799 living alone)
5,174 spouses (5,159 opposite-sex spouses), 513 unmarried partners, (500 opposite-sex unmarried partners), 8,711 children (8,285 natural, 49 adopted, 376 stepchildren), 283 grandchildren, 400 brothers or sisters, 401 parents, 61 foster children, 668 other relatives, 661 non-relatives
- In group quarters: 452
Size of family households: 2,608 2-persons, 1,808 3-persons, 1,286 4-persons, 488 5-persons, 309 6-persons, 98 7-or-more-persons.
Size of nonfamily households: 2,982 1-person, 613 2-persons, 51 3-persons, 62 4-persons.
5,041 married couples with children.
608 single-parent households (102 men, 506 women).
84.6% of residents of West Melbourne speak English at home.
7.0% of residents speak Spanish at home (67% speak English very well, 19% speak English well, 4% speak English not well, 10% don't speak English at all).
3.6% of residents speak other Indo-European language at home (73% speak English very well, 17% speak English well, 8% speak English not well, 2% don't speak English at all).
4.3% of residents speak Asian or Pacific Island language at home (59% speak English very well, 8% speak English well, 32% speak English not well).
0.3% of residents speak other language at home (100% speak English very well).
Foreign born population: 3,271 (11.8%)
(67.6% of them are naturalized citizens)
| Here: | 6.5 |
| State: | 5.9 |
| Here: | 4.1 |
| State: | 4.2 |

- Bedrooms in owner-occupied houses and condos in West Melbourne, Florida
- 0no bedroom
- 131 bedroom
- 1,1222 bedrooms
- 3,5743 bedrooms
- 2,9084 bedrooms
- 5025+ bedrooms

- Bedrooms in renter-occupied apartments in West Melbourne, Florida
- 60no bedroom
- 3151 bedroom
- 1,0832 bedrooms
- 5313 bedrooms
- 1874 bedrooms
- 525+ bedrooms

- Cars and other vehicles available in West Melbourne in owner-occupied houses/condos
- 271no vehicle
- 2,9541 vehicle
- 2,9782 vehicles
- 1,3373 vehicles
- 2584 vehicles
- 3215+ vehicles

- Cars and other vehicles available in West Melbourne in renter-occupied apartments
- 231no vehicle
- 1,0511 vehicle
- 8452 vehicles
- 363 vehicles
- 644 vehicles
- 05+ vehicles

- Rooms in owner-occupied houses in West Melbourne, Florida
- 01 room
- 132 rooms
- 903 rooms
- 5984 rooms
- 1,5035 rooms
- 1,7256 rooms
- 1,8007 rooms
- 1,0278 rooms
- 1,3619+ rooms
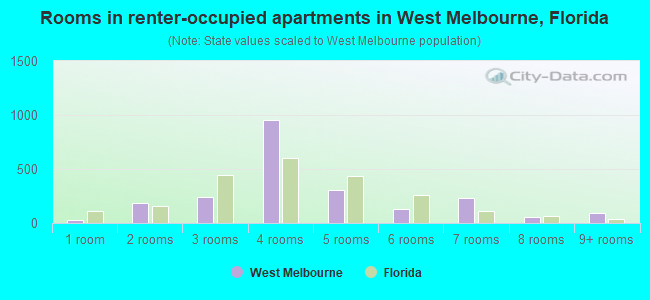
- Rooms in renter-occupied apartments in West Melbourne, Florida
- 261 room
- 1822 rooms
- 2443 rooms
- 9544 rooms
- 3075 rooms
- 1266 rooms
- 2347 rooms
- 588 rooms
- 969+ rooms


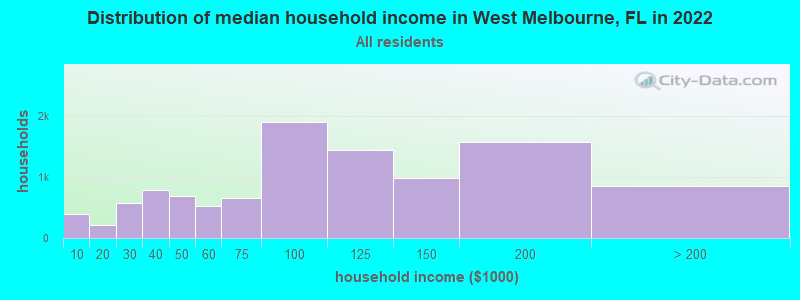
West Melbourne, FL household income distribution

- 396Less than $10,000
- 221$10,000 to $19,999
- 578$20,000 to $29,999
- 784$30,000 to $39,999
- 683$40,000 to $49,999
- 520$50,000 to $59,999
- 648$60,000 to $74,999
- 1,902$75,000 to $99,999
- 1,445$100,000 to $124,999
- 978$125,000 to $149,999
- 1,569$150,000 to $199,999
- 845$200,000 or more
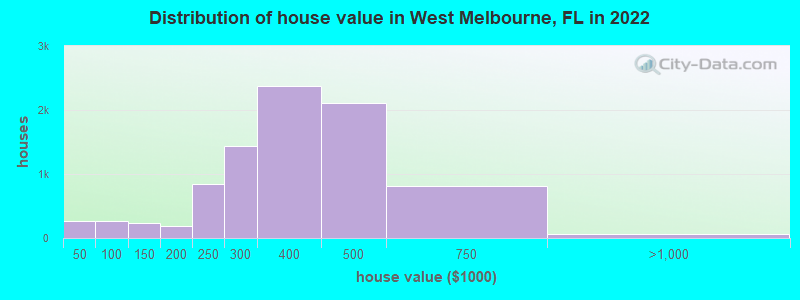
Home value of owner - occupied houses in 2022 in West Melbourne, FL
-
- 38Less than $10,000
- 36$15,000 to $19,999
- 73$20,000 to $24,999
- 13$25,000 to $29,999
- 29$30,000 to $34,999
- 79$40,000 to $49,999
- 28$50,000 to $59,999
- 43$60,000 to $69,999
- 35$70,000 to $79,999
- 74$80,000 to $89,999
- 4$90,000 to $99,999
- 83$100,000 to $124,999
- 157$125,000 to $149,999
- 188$150,000 to $174,999
- 5$175,000 to $199,999
- 848$200,000 to $249,999
- 1,441$250,000 to $299,999
- 2,370$300,000 to $399,999
- 2,106$400,000 to $499,999
- 816$500,000 to $749,999
- 31$750,000 to $999,999
- 8$1,000,000 to $1,499,999
- 17$1,500,000 to $1,999,999
Rent paid by renters in 2022 in West Melbourne, FL
-
- 30$150 to $199
- 14$500 to $549
- 18$650 to $699
- 7$700 to $749
- 17$750 to $799
- 78$800 to $899
- 20$900 to $999
- 339$1,000 to $1,249
- 304$1,250 to $1,499
- 1,001$1,500 to $1,999
- 330$2,000 to $2,499
- 142$2,500 to $2,999
- 18$3,000 to $3,499
- 58$3,500 or more
- 138No cash rent


Percentage of workers working in this county: 97.0%
Number of people working at home: 2,560 (19.6% of all workers)
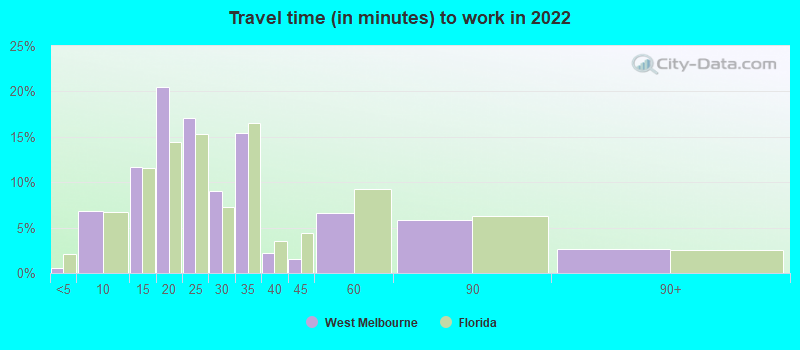
Travel time to work (commute)
- Less than 5 minutes: 225
- 5 to 9 minutes: 894
- 10 to 14 minutes: 2,110
- 15 to 19 minutes: 1,754
- 20 to 24 minutes: 1,921
- 25 to 29 minutes: 495
- 30 to 34 minutes: 1,545
- 35 to 39 minutes: 44
- 40 to 44 minutes: 183
- 45 to 59 minutes: 613
- 60 to 89 minutes: 343
- 90 or more minutes: 354
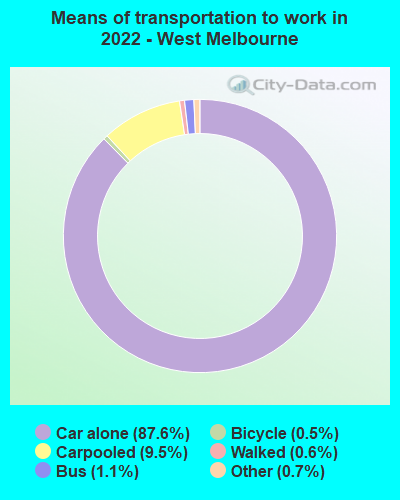
Means of transportation to work:
- Drove a car alone: 9,108 (70.1%)
- Carpooled: 1,026 (7.9%)
- Bus: 181 (1.4%)
- Taxi: 98 (0.8%)
- Bicycle: 50 (0.4%)
- Walked: 73 (0.6%)
- Worked at home: 2,560 (19.7%)

- Unemployment by race in 2022
- Unemployment rate for White non-Hispanic residents
- 5.4%Males
- 2.2%Females
- Unemployment rate for Asian residents
- 20.7%Males
- 8.3%Females
- Unemployment rate for other race residents
- 35.3%Females
- Unemployment rate for two or more race residents
- 10.4%Males
- Unemployment rate for Hispanic or Latino residents
- 0.6%Males

- Year of entry for the foreign-born population in West Melbourne, Florida
- 1,0752010 or later
- 7162000 to 2009
- 4571990 to 1999
- 1291980 to 1989
- 1061970 to 1979
- 287Before 1970

First ancestries reported:
- English: 1,268 (12.2%)
- Italian: 1,066 (10.2%)
- American: 1,019 (9.8%)
- Irish: 810 (7.8%)
- German: 757 (7.3%)
- European: 285 (2.7%)
- Polish: 272 (2.6%)
- French: 149 (1.4%)
- Canadian: 117 (1.1%)
- Scotch-Irish: 100 (1.0%)
- Eastern European: 95 (0.9%)
- Norwegian: 91 (0.9%)
- Portuguese: 91 (0.9%)
- Russian: 87 (0.8%)
- Arab: 59 (0.6%)
- Jamaican: 43 (0.4%)
- Swedish: 34 (0.3%)
- British: 32 (0.3%)
- Welsh: 32 (0.3%)
- Scottish: 31 (0.3%)
- Greek: 28 (0.3%)
- Romanian: 27 (0.3%)
- Swiss: 27 (0.3%)
- Dutch: 26 (0.2%)
- Trinidadian and Tobagonian: 23 (0.2%)
- Zimbabwean: 21 (0.2%)
- French Canadian: 18 (0.2%)
- Albanian: 17 (0.2%)
- Brazilian: 13 (0.1%)
- African: 12 (0.1%)
- Northern European: 9 (0.09%)
- Hungarian: 6 (0.06%)
- Pennsylvania German: 6 (0.06%)
- British West Indian: 6 (0.06%)
Most common places of birth for foreign-born residents (%):
| West Melbourne: | 13.2% (407) |
| Florida: | 1.2% (56,071) |
| West Melbourne: | 10.2% (313) |
| Florida: | 1.1% (49,838) |
| West Melbourne: | 9.6% (294) |
| Florida: | 1.3% (60,604) |
| West Melbourne: | 9.5% (291) |
| Florida: | 2.7% (122,906) |
| West Melbourne: | 6.9% (211) |
| Florida: | 2.1% (94,349) |
| West Melbourne: | 5.8% (177) |
| Florida: | 5.7% (262,042) |
| West Melbourne: | 4.6% (141) |
| Florida: | 1.2% (54,272) |
| West Melbourne: | 4.2% (128) |
| Florida: | 2.1% (96,693) |
| West Melbourne: | 4.0% (122) |
| Florida: | 22.0% (1,006,576) |
| West Melbourne: | 3.6% (110) |
| Florida: | 1.8% (84,403) |
| West Melbourne: | 3.4% (104) |
| Florida: | 0.1% (4,597) |
| West Melbourne: | 3.0% (91) |
| Florida: | 6.5% (298,669) |
| West Melbourne: | 2.8% (87) |
| Florida: | 0.7% (31,076) |
| West Melbourne: | 2.2% (68) |
| Florida: | 1.2% (54,585) |
| West Melbourne: | 1.8% (55) |
| Florida: | 5.0% (227,319) |
| West Melbourne: | 1.8% (55) |
| Florida: | 0.2% (9,493) |
Place of birth for U.S.-born residents:
- This state: 8,503
- Other state: 15,021
- Northeast: 4,885
- Midwest: 4,685
- South: 3,401
- West: 2,091
88.6% of West Melbourne residents lived in the same house 1 years ago.
Out of people who lived in different houses, 30.3% lived in this county.
Out of people who lived in different counties, 44.1% lived in Florida.
| West Melbourne: | 88.6% |
| State average: | 86.3% |
Education attainment for males 25 years and older:
- No schooling: 336
- Nursery to 4th grade: 0
- 5th and 6th grade: 0
- 7th and 8th grade: 28
- 9th grade: 33
- 10th grade: 49
- 11th grade: 0
- 12th grade, no diploma: 168
- High school graduate (or equivalency): 1,503
- Less than 1 year of college: 582
- Some college more than 1 year, no degree: 1,227
- Associate degree: 1,037
- Bachelor's degree: 2,789
- Master's degree: 1,286
- Professional school degree: 400
- Doctorate degree: 240

Education attainment for females 25 years and older:
- No schooling: 267
- Nursery to 4th grade: 5
- 5th and 6th grade: 0
- 7th and 8th grade: 37
- 9th grade: 7
- 10th grade: 89
- 11th grade: 69
- 12th grade, no diploma: 79
- High school graduate (or equivalency): 2,619
- Less than 1 year of college: 672
- Some college more than 1 year, no degree: 1,413
- Associate degree: 852
- Bachelor's degree: 2,243
- Master's degree: 1,030
- Professional school degree: 258
- Doctorate degree: 227

Housing units in structures:
- One, detached: 8,017
- One, attached: 347
- Two: 27
- 3 or 4: 501
- 5 to 9: 711
- 10 to 19: 466
- 20 to 49: 331
- 50 or more: 343
- Mobile homes: 448
Median worth of mobile homes: $66,836
Housing units lacking complete kitchen facilities in 2022: 0.3%
House/condo owner moved in on average 7 years ago
Renter moved in on average 0 years ago

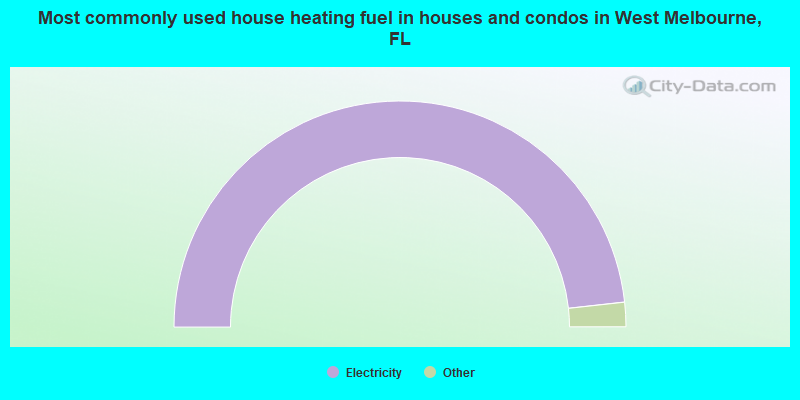
- 96.5%Electricity
- 1.7%Utility gas
- 0.8%No fuel used
- 0.6%Solar energy
- 0.2%Coal or coke
- 0.1%Bottled, tank, or LP gas
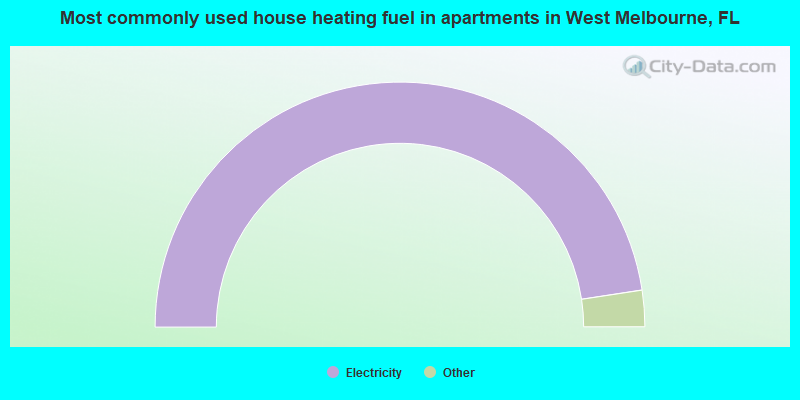
- 95.2%Electricity
- 2.2%Utility gas
- 1.0%Bottled, tank, or LP gas
- 0.8%Other fuel
- 0.8%No fuel used
Private vs. public school enrollment:
| Here: | 24.6% |
| Florida: | 15.8% |
| Here: | 29.9% |
| Florida: | 12.9% |
| Here: | 34.2% |
| Florida: | 23.6% |


