Races in West Melbourne, Florida (FL) Detailed Stats
Data:
Races - White alone (%)
Races - White alone (% change since 2000)
Races - Black alone (%)
Races - Black alone (% change since 2000)
Races - American Indian alone (%)
Races - American Indian alone (% change since 2000)
Races - Asian alone (%)
Races - Asian alone (% change since 2000)
Races - Hispanic (%)
Races - Hispanic (% change since 2000)
Races - Native Hawaiian and Other Pacific Islander alone (%)
Races - Native Hawaiian and Other Pacific Islander alone (% change since 2000)
Races - Two or more races(%)
Races - Two or more races(% change since 2000)
Races - Other race alone (%)
Races - Other race alone (% change since 2000)
Racial diversity
Place of birth - Born in state of residence (%)
Place of birth - Born in state of residence (%) - White
Place of birth - Born in state of residence (%) - Black or African American
Place of birth - Born in state of residence (%) - Asian
Place of birth - Born in state of residence (%) - Hispanic or Latino
Place of birth - Born in state of residence (%) - American Indian and Alaska Native
Place of birth - Born in state of residence (%) - Multirace
Place of birth - Born in state of residence (%) - Other Race
Place of birth - Born in other state (%)
Place of birth - Born in other state (%) - White
Place of birth - Born in other state (%) - Black or African American
Place of birth - Born in other state (%) - Asian
Place of birth - Born in other state (%) - Hispanic or Latino
Place of birth - Born in other state (%) - American Indian and Alaska Native
Place of birth - Born in other state (%) - Multirace
Place of birth - Born in other state (%) - Other Race
Place of birth - Native, outside of US (%)
Place of birth - Native, outside of US (%) - White
Place of birth - Native, outside of US (%) - Black or African American
Place of birth - Native, outside of US (%) - Asian
Place of birth - Native, outside of US (%) - Hispanic or Latino
Place of birth - Native, outside of US (%) - American Indian and Alaska Native
Place of birth - Native, outside of US (%) - Multirace
Place of birth - Native, outside of US (%) - Other Race
Place of birth - Foreign born (%)
Place of birth - Foreign born (%) - White
Place of birth - Foreign born (%) - Black or African American
Place of birth - Foreign born (%) - Asian
Place of birth - Foreign born (%) - Hispanic or Latino
Place of birth - Foreign born (%) - American Indian and Alaska Native
Place of birth - Foreign born (%) - Multirace
Place of birth - Foreign born (%) - Other Race
Residents speaking English at home (%)
Residents speaking English at home - Born in the United States (%)
Residents speaking English at home - Native, born elsewhere (%)
Residents speaking English at home - Foreign born (%)
Residents speaking Spanish at home (%)
Residents speaking Spanish at home - Born in the United States (%)
Residents speaking Spanish at home - Native, born elsewhere (%)
Residents speaking Spanish at home - Foreign born (%)
Residents speaking other language at home (%)
Residents speaking other language at home - Born in the United States (%)
Residents speaking other language at home - Native, born elsewhere (%)
Residents speaking other language at home - Foreign born (%)
Marital status - Never married (%)
Marital status - Now married (%)
Marital status - Separated (%)
Marital status - Widowed (%)
Marital status - Divorced (%)
Ancestries Reported - Arab (%)
Ancestries Reported - Czech (%)
Ancestries Reported - Danish (%)
Ancestries Reported - Dutch (%)
Ancestries Reported - English (%)
Ancestries Reported - French (%)
Ancestries Reported - French Canadian (%)
Ancestries Reported - German (%)
Ancestries Reported - Greek (%)
Ancestries Reported - Hungarian (%)
Ancestries Reported - Irish (%)
Ancestries Reported - Italian (%)
Ancestries Reported - Lithuanian (%)
Ancestries Reported - Norwegian (%)
Ancestries Reported - Polish (%)
Ancestries Reported - Portuguese (%)
Ancestries Reported - Russian (%)
Ancestries Reported - Scotch-Irish (%)
Ancestries Reported - Scottish (%)
Ancestries Reported - Slovak (%)
Ancestries Reported - Subsaharan African (%)
Ancestries Reported - Swedish (%)
Ancestries Reported - Swiss (%)
Ancestries Reported - Ukrainian (%)
Ancestries Reported - United States (%)
Ancestries Reported - Welsh (%)
Ancestries Reported - West Indian (%)
Ancestries Reported - Other (%)
Geographical mobility - Same house 1 year ago (%)
Geographical mobility - Same house 1 year ago (%) - White
Geographical mobility - Same house 1 year ago (%) - Black or African American
Geographical mobility - Same house 1 year ago (%) - Asian
Geographical mobility - Same house 1 year ago (%) - Hispanic or Latino
Geographical mobility - Same house 1 year ago (%) - American Indian and Alaska Native
Geographical mobility - Same house 1 year ago (%) - Multirace
Geographical mobility - Same house 1 year ago (%) - Other Race
Geographical mobility - Moved within same county (%)
Geographical mobility - Moved within same county (%) - White
Geographical mobility - Moved within same county (%) - Black or African American
Geographical mobility - Moved within same county (%) - Asian
Geographical mobility - Moved within same county (%) - Hispanic or Latino
Geographical mobility - Moved within same county (%) - American Indian and Alaska Native
Geographical mobility - Moved within same county (%) - Multirace
Geographical mobility - Moved within same county (%) - Other Race
Geographical mobility - Moved from different county within same state (%)
Geographical mobility - Moved from different county within same state (%) - White
Geographical mobility - Moved from different county within same state (%) - Black or African American
Geographical mobility - Moved from different county within same state (%) - Asian
Geographical mobility - Moved from different county within same state (%) - Hispanic or Latino
Geographical mobility - Moved from different county within same state (%) - American Indian and Alaska Native
Geographical mobility - Moved from different county within same state (%) - Multirace
Geographical mobility - Moved from different county within same state (%) - Other Race
Geographical mobility - Moved from different state (%)
Geographical mobility - Moved from different state (%) - White
Geographical mobility - Moved from different state (%) - Black or African American
Geographical mobility - Moved from different state (%) - Asian
Geographical mobility - Moved from different state (%) - Hispanic or Latino
Geographical mobility - Moved from different state (%) - American Indian and Alaska Native
Geographical mobility - Moved from different state (%) - Multirace
Geographical mobility - Moved from different state (%) - Other Race
Geographical mobility - Moved from abroad (%)
Geographical mobility - Moved from abroad (%) - White
Geographical mobility - Moved from abroad (%) - Black or African American
Geographical mobility - Moved from abroad (%) - Asian
Geographical mobility - Moved from abroad (%) - Hispanic or Latino
Geographical mobility - Moved from abroad (%) - American Indian and Alaska Native
Geographical mobility - Moved from abroad (%) - Multirace
Geographical mobility - Moved from abroad (%) - Other Race
Place of birth for the foreign-born population - Ireland (%)
Place of birth for the foreign-born population - Denmark (%)
Place of birth for the foreign-born population - Norway (%)
Place of birth for the foreign-born population - Sweden (%)
Place of birth for the foreign-born population - United Kingdom (%)
Place of birth for the foreign-born population - England (%)
Place of birth for the foreign-born population - Scotland (%)
Place of birth for the foreign-born population - Other Northern Europe (%)
Place of birth for the foreign-born population - Austria (%)
Place of birth for the foreign-born population - Belgium (%)
Place of birth for the foreign-born population - France (%)
Place of birth for the foreign-born population - Germany (%)
Place of birth for the foreign-born population - Netherlands (%)
Place of birth for the foreign-born population - Switzerland (%)
Place of birth for the foreign-born population - Other Western Europe (%)
Place of birth for the foreign-born population - Greece (%)
Place of birth for the foreign-born population - Italy (%)
Place of birth for the foreign-born population - Portugal (%)
Place of birth for the foreign-born population - Spain (%)
Place of birth for the foreign-born population - Other Southern Europe (%)
Place of birth for the foreign-born population - Albania (%)
Place of birth for the foreign-born population - Belarus (%)
Place of birth for the foreign-born population - Bosnia and Herzegovina (%)
Place of birth for the foreign-born population - Bulgaria (%)
Place of birth for the foreign-born population - Croatia (%)
Place of birth for the foreign-born population - Czechoslovakia (%)
Place of birth for the foreign-born population - Hungary (%)
Place of birth for the foreign-born population - Latvia (%)
Place of birth for the foreign-born population - Lithuania (%)
Place of birth for the foreign-born population - North Macedonia (Macedonia) (%)
Place of birth for the foreign-born population - Moldova (%)
Place of birth for the foreign-born population - Poland (%)
Place of birth for the foreign-born population - Romania (%)
Place of birth for the foreign-born population - Russia (%)
Place of birth for the foreign-born population - Serbia (%)
Place of birth for the foreign-born population - Ukraine (%)
Place of birth for the foreign-born population - Other Eastern Europe (%)
Place of birth for the foreign-born population - China (%)
Place of birth for the foreign-born population - Hong Kong (%)
Place of birth for the foreign-born population - Taiwan (%)
Place of birth for the foreign-born population - Japan (%)
Place of birth for the foreign-born population - Korea (%)
Place of birth for the foreign-born population - Other Eastern Asia (%)
Place of birth for the foreign-born population - Afghanistan (%)
Place of birth for the foreign-born population - Bangladesh (%)
Place of birth for the foreign-born population - India (%)
Place of birth for the foreign-born population - Iran (%)
Place of birth for the foreign-born population - Kazakhstan (%)
Place of birth for the foreign-born population - Nepal (%)
Place of birth for the foreign-born population - Pakistan (%)
Place of birth for the foreign-born population - Sri Lanka (%)
Place of birth for the foreign-born population - Uzbekistan (%)
Place of birth for the foreign-born population - Other South Central Asia (%)
Place of birth for the foreign-born population - Burma (%)
Place of birth for the foreign-born population - Cambodia (%)
Place of birth for the foreign-born population - Indonesia (%)
Place of birth for the foreign-born population - Laos (%)
Place of birth for the foreign-born population - Malaysia (%)
Place of birth for the foreign-born population - Philippines (%)
Place of birth for the foreign-born population - Singapore (%)
Place of birth for the foreign-born population - Thailand (%)
Place of birth for the foreign-born population - Vietnam (%)
Place of birth for the foreign-born population - Other South Eastern Asia (%)
Place of birth for the foreign-born population - Armenia (%)
Place of birth for the foreign-born population - Iraq (%)
Place of birth for the foreign-born population - Israel (%)
Place of birth for the foreign-born population - Jordan (%)
Place of birth for the foreign-born population - Kuwait (%)
Place of birth for the foreign-born population - Lebanon (%)
Place of birth for the foreign-born population - Saudi Arabia (%)
Place of birth for the foreign-born population - Syria (%)
Place of birth for the foreign-born population - Turkey (%)
Place of birth for the foreign-born population - Yemen (%)
Place of birth for the foreign-born population - Other Western Asia (%)
Place of birth for the foreign-born population - Eritrea (%)
Place of birth for the foreign-born population - Ethiopia (%)
Place of birth for the foreign-born population - Kenya (%)
Place of birth for the foreign-born population - Somalia (%)
Place of birth for the foreign-born population - Uganda (%)
Place of birth for the foreign-born population - Zimbabwe (%)
Place of birth for the foreign-born population - Other Eastern Africa (%)
Place of birth for the foreign-born population - Cameroon (%)
Place of birth for the foreign-born population - Congo (%)
Place of birth for the foreign-born population - Democratic Republic of Congo (Zaire) (%)
Place of birth for the foreign-born population - Other Middle Africa (%)
Place of birth for the foreign-born population - Egypt (%)
Place of birth for the foreign-born population - Morocco (%)
Place of birth for the foreign-born population - Sudan (%)
Place of birth for the foreign-born population - Other Northern Africa (%)
Place of birth for the foreign-born population - South Africa (%)
Place of birth for the foreign-born population - Other Southern Africa (%)
Place of birth for the foreign-born population - Cabo Verde (%)
Place of birth for the foreign-born population - Ghana (%)
Place of birth for the foreign-born population - Liberia (%)
Place of birth for the foreign-born population - Nigeria (%)
Place of birth for the foreign-born population - Senegal (%)
Place of birth for the foreign-born population - Sierra Leone (%)
Place of birth for the foreign-born population - Other Western Africa (%)
Place of birth for the foreign-born population - Australia (%)
Place of birth for the foreign-born population - New Zealand (%)
Place of birth for the foreign-born population - Fiji (%)
Place of birth for the foreign-born population - Micronesia (%)
Place of birth for the foreign-born population - Bahamas (%)
Place of birth for the foreign-born population - Barbados (%)
Place of birth for the foreign-born population - Cuba (%)
Place of birth for the foreign-born population - Dominica (%)
Place of birth for the foreign-born population - Dominican Republic (%)
Place of birth for the foreign-born population - Grenada (%)
Place of birth for the foreign-born population - Haiti (%)
Place of birth for the foreign-born population - Jamaica (%)
Place of birth for the foreign-born population - St. Vincent and the Grenadines (%)
Place of birth for the foreign-born population - Trinidad and Tobago (%)
Place of birth for the foreign-born population - West Indies (%)
Place of birth for the foreign-born population - Other Caribbean (%)
Place of birth for the foreign-born population - Belize (%)
Place of birth for the foreign-born population - Costa Rica (%)
Place of birth for the foreign-born population - El Salvador (%)
Place of birth for the foreign-born population - Guatemala (%)
Place of birth for the foreign-born population - Honduras (%)
Place of birth for the foreign-born population - Mexico (%)
Place of birth for the foreign-born population - Nicaragua (%)
Place of birth for the foreign-born population - Panama (%)
Place of birth for the foreign-born population - Other Central America (%)
Place of birth for the foreign-born population - Argentina (%)
Place of birth for the foreign-born population - Bolivia (%)
Place of birth for the foreign-born population - Brazil (%)
Place of birth for the foreign-born population - Chile (%)
Place of birth for the foreign-born population - Colombia (%)
Place of birth for the foreign-born population - Ecuador (%)
Place of birth for the foreign-born population - Guyana (%)
Place of birth for the foreign-born population - Peru (%)
Place of birth for the foreign-born population - Uruguay (%)
Place of birth for the foreign-born population - Venezuela (%)
Place of birth for the foreign-born population - Other South America (%)
Place of birth for the foreign-born population - Canada (%)
Place of birth for the foreign-born population - Other Northern America (%)
Place of birth for the foreign-born population - Other (%)
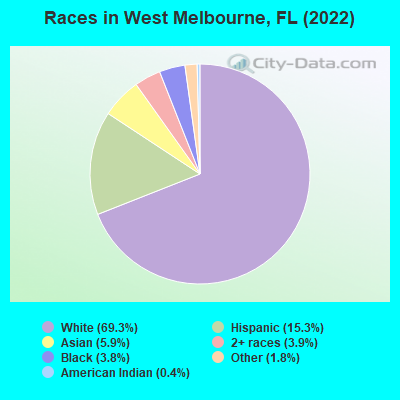
According to 2022 data, the most numerous races in West Melbourne, FL are White alone (19,147 residents), Hispanic (4,228 residents), and Black alone (1,064 residents). 84.8% of West Melbourne residents speak English at home. 11.1% of West Melbourne, FL residents are foreign-born (4.8% born in Latin America, 4.3% born in Asia, 1.5% born in Europe), which is 88.7% less than the foreign-born rate of 21.0% across the entire state of Florida.
Race distribution in West Melbourne
2000 2022
10,458,509 65.4% White alone 2,682,715 16.8% Hispanic 2,264,268 14.2% Black alone 261,693 1.6% Asian alone 236,954 1.5% Two or more races 42,358 0.3% American Indian alone 28,994 0.2% Other race alone 6,887 0.04% Native Hawaiian and Other
11,309,403 50.8% White alone 6,025,039 27.1% Hispanic 3,241,015 14.6% Black alone 861,630 3.9% Two or more races 623,692 2.8% Asian alone 152,054 0.7% Other race alone 22,504 0.1% American Indian alone 9,486 0.04% Native Hawaiian and Other
Income and house value in West Melbourne Median household income in 2022 $84,844 White non-Hispanic householders$84,109 Black householders$68,239 American Indian and Alaska Native householders$108,446 Asian householders$130,163 Two or more races householders$111,760 Hispanic or Latino race householdersMedian 2022 house value $442,502 White Non-Hispanic householders$443,435 Black or African American householders$266,061 American Indian or Alaska Native householders $632,946 Asian householders$436,900 Some other race householders$402,826 Two or more races householders$393,490 Hispanic or Latino householders
Median age by race in West Melbourne
44.4 Median age for White residents40.9 47.0 33.5 Median age for Black or African American residents32.5 39.4 28.7 Median age for American Indian / Alaska Native residents29.8 27.2 47.3 Median age for Asian residents40.7 47.9 -679,849,340.2 Median age for Native Hawaiian / Pacific Islander residents-858,307,848.3 -443,298,968.6 31.4 Median age for Other race residents33.3 34.5 32.0 Median age for Two or more races residents26.4 34.1 46.0 Median age for White alone residents42.6 47.4 31.0 Median age for Hispanic or Latino residents27.7 34.1
Owner/renter occupied households by race in West Melbourne
House owners and renters - White residents 6,481 80.3% Owner occupied1,589 19.7% Renter occupiedHouse owners and renters - Black or African American residents 203 55.8% Owner occupied161 44.2% Renter occupiedHouse owners and renters - American Indian / Alaska Native residents 148 68.1% Owner occupied69 31.9% Renter occupiedHouse owners and renters - Asian residents 574 96.2% Owner occupied23 3.8% Renter occupiedHouse owners and renters - Native Hawaiian / Pacific Islander residents 19 100.0% Renter occupiedHouse owners and renters - Other race residents 101 45.5% Owner occupied121 54.5% Renter occupiedHouse owners and renters - Two or more races residents 714 70.5% Owner occupied298 29.5% Renter occupiedHouse owners and renters - White alone residents 6,253 81.6% Owner occupied1,407 18.4% Renter occupiedHouse owners and renters - Hispanic or Latino residents 812 63.8% Owner occupied460 36.2% Renter occupied
Language usage in West Melbourne
English speakers - Total 84.8% of residents of West Melbourne speak English at home.
7.6% of residents speak Spanish at home 1,281 64.5% Speak English very well705 35.5% Speak English less than very well7.5% of residents speak other language at home 1,373 70.4% Speak English very well578 29.6% Speak English less than very well
English speakers - Born in the United States 96.5% of residents of West Melbourne speak English at home.
1.6% of residents speak Spanish at home 213 91.4% Speak English very well20 8.6% Speak English less than very well1.7% of residents speak other language at home 210 85.0% Speak English very well37 15.0% Speak English less than very well
English speakers - Native, born elsewhere 40.1% of residents of West Melbourne speak English at home.
53.1% of residents speak Spanish at home 373 80.0% Speak English very well93 20.0% Speak English less than very well2.3% of residents speak other language at home 20 100.0% Speak English very well
English speakers - Foreign-born 20.1% of residents of West Melbourne speak English at home.
28.7% of residents speak Spanish at home 347 36.8% Speak English very well597 63.2% Speak English less than very well51.4% of residents speak other language at home 1,160 68.6% Speak English very well530 31.4% Speak English less than very well
White (Caucasian) - Speak only English Native:
98.2% (18,194)Foreign-born:
31.7% (256)
White (Caucasian) - Speak another language Native:
2.1% (391)Foreign-born:
64.5% (519)
Black or African American - Speak only English Native:
93.8% (847)Foreign-born:
60.8% (64)
Black or African American - Speak another language Native:
6.3% (57)Foreign-born:
39.9% (42)
Asian - Speak only English Native:
64.7% (192)Foreign-born:
9.8% (131)
Asian - Speak another language Native:
29.8% (89)Foreign-born:
88.8% (1,185)
Other race - Speak only English Native:
65.7% (274)Foreign-born:
6.8% (40)
Other race - Speak another language Native:
35.7% (149)Foreign-born:
93.4% (550)
Two or more races - Speak only English Native:
69.3% (1,576)Foreign-born:
44.1% (288)
Two or more races - Speak another language Native:
30.8% (701)Foreign-born:
59.0% (385)
White alone - Speak only English Native:
98.8% (17,509)Foreign-born:
36.9% (227)
White alone - Speak another language Native:
1.2% (221)Foreign-born:
62.2% (383)
Hispanic or Latino - Speak only English Native:
63.1% (1,734)Foreign-born:
21.6% (266)
Hispanic or Latino - Speak another language Native:
37.4% (1,026)Foreign-born:
77.6% (956)
Foreign-born residents in West Melbourne 3,076 residents are foreign born (4.8% Latin America , 4.3% Asia , 1.5% Europe ).
This city:
11.1%Florida:
21.1%
Marital status for residents in West Melbourne Marital status - White (Caucasian) population 15 years and over
Males 34.9% Never married50.9% Now married2.4% Separated1.8% Widowed10.0% DivorcedFemales 22.6% Never married47.4% Now married0.5% Separated13.6% Widowed15.9% DivorcedWomen who gave birth in the past 12 months Now married:
83.0% (291)Unmarried:
17.0% (60)
Women who did not give birth in the past 12 months Now married:
49.9% (1,956)Unmarried:
50.1% (1,968)
Marital status - Black or African American population 15 years and over
Males 54.7% Never married28.4% Now married8.4% Separated1.0% Widowed7.6% DivorcedFemales 27.8% Never married23.5% Now married0.0% Separated2.9% Widowed45.8% DivorcedWomen who did not give birth in the past 12 months Now married:
16.6% (28)Unmarried:
83.4% (142)
Marital status - American Indian / Alaska Native population 15 years and over
Males 32.1% Never married67.9% Now married0.0% Separated0.0% Widowed0.0% DivorcedFemales 35.7% Never married61.1% Now married0.0% Separated0.0% Widowed3.2% DivorcedWomen who did not give birth in the past 12 months Now married:
67.6% (157)Unmarried:
32.4% (75)
Marital status - Asian population 15 years and over
Males 47.2% Never married36.6% Now married0.0% Separated0.0% Widowed16.2% DivorcedFemales 22.9% Never married59.2% Now married1.1% Separated10.0% Widowed6.8% DivorcedWomen who gave birth in the past 12 months Now married:
100.0% (19)Unmarried:
0.0% (0)
Women who did not give birth in the past 12 months Now married:
84.9% (320)Unmarried:
15.1% (57)
Marital status - Other race population 15 years and over
Males 28.8% Never married65.1% Now married0.0% Separated0.0% Widowed6.0% DivorcedFemales 35.7% Never married56.0% Now married0.0% Separated0.0% Widowed8.3% DivorcedWomen who gave birth in the past 12 months Now married:
100.0% (17)Unmarried:
0.0% (0)
Women who did not give birth in the past 12 months Now married:
49.8% (136)Unmarried:
50.2% (138)
Marital status - Two or more races population 15 years and over
Males 40.5% Never married48.9% Now married0.0% Separated0.0% Widowed10.6% DivorcedFemales 19.8% Never married61.3% Now married0.0% Separated4.9% Widowed14.0% DivorcedWomen who gave birth in the past 12 months Now married:
0.0% (0)Unmarried:
100.0% (26)
Women who did not give birth in the past 12 months Now married:
67.2% (567)Unmarried:
32.8% (276)
Marital status - White alone, not Hispanic / Latino population 15 years and over
Males 34.9% Never married50.2% Now married2.6% Separated1.9% Widowed10.4% DivorcedFemales 20.9% Never married48.4% Now married0.5% Separated14.0% Widowed16.1% DivorcedWomen who gave birth in the past 12 months Now married:
100.0% (301)Unmarried:
0.0% (0)
Women who did not give birth in the past 12 months Now married:
50.6% (1,866)Unmarried:
49.4% (1,822)
Marital status - Hispanic or Latino population 15 years and over
Males 34.3% Never married60.8% Now married0.0% Separated0.0% Widowed4.9% DivorcedFemales 30.7% Never married51.6% Now married0.0% Separated5.0% Widowed12.7% DivorcedWomen who gave birth in the past 12 months Now married:
0.0% (0)Unmarried:
100.0% (68)
Women who did not give birth in the past 12 months Now married:
60.8% (693)Unmarried:
39.2% (447)
Ancestries in West Melbourne
1,268 12.2% English1,066 10.2% Italian1,019 9.8% American810 7.8% Irish757 7.3% German285 2.7% European272 2.6% Polish149 1.4% French117 1.1% Canadian100 1.0% Scotch-Irish95 0.9% Eastern European91 0.9% Norwegian91 0.9% Portuguese87 0.8% Russian59 0.6% Arab43 0.4% Jamaican34 0.3% Swedish32 0.3% British32 0.3% Welsh31 0.3% Scottish28 0.3% Greek27 0.3% Romanian27 0.3% Swiss26 0.2% Dutch23 0.2% Trinidadian and Tobagonian21 0.2% Zimbabwean18 0.2% French Canadian17 0.2% Albanian13 0.1% Brazilian12 0.1% African9 0.09% Northern European6 0.06% Hungarian6 0.06% Pennsylvania German6 0.06% British West Indian
Geographical mobility in West Melbourne Same house 1 year ago 18,058 90.4% White (Caucasian)972 90.0% Black or African American261 37.2% American Indian / Alaska Native1,501 89.2% Asian17 100.0% Native Hawaiian / Pacific Islander658 66.3% Other race2,784 89.0% Two or more races17,256 91.1% White alone, not Hispanic / Latino3,307 80.5% Hispanic or LatinoMoved within same county 866 4.3% White / Caucasian48 4.4% Black or African American156 9.3% Asian84 8.5% Other race85 2.7% Two or more races764 4.0% White alone, not Hispanic / Latino209 5.1% Hispanic or LatinoMoved within same state 646 3.2% White / Caucasian52 4.8% Black or African American114 3.6% Two or more races589 3.1% White alone, not Hispanic / Latino86 2.1% Hispanic or LatinoMoved from different state 423 2.1% White / Caucasian21 1.9% Black or African American265 37.8% American Indian / Alaska Native276 27.8% Other race127 4.1% Two or more races362 1.9% White alone, not Hispanic / Latino390 9.5% Hispanic or LatinoMoved from abroad 59 0.3% White141 20.1% American Indian / Alaska Native70 7.1% Other race77 0.4% White alone, not Hispanic / Latino63 1.5% Hispanic or Latino
Children Nativity (place of birth) in West Melbourne
Children under 6 years - Living with two parents Both parents native 1,053 100.0% NativeBoth parents foreign-born 176 100.0% NativeOne native, one foreign-born parent 337 100.0% NativeChildren under 6 years - Living with one parent Native parent 218 100.0% NativeChildren 6 to 17 years - Living with two parents Both parents native 2,997 100.0% NativeBoth parents foreign-born 207 56.0% Native162 44.0% Foreign-bornOne native, one foreign-born parent 210 100.0% NativeChildren 6 to 17 years - Living with one parent Native parent 452 99.4% Native3 0.6% Foreign-bornForeign-born parent 52 65.4% Native28 34.6% Foreign-born
Grandparents responsible for own grandchildren in West Melbourne
Grandparents (30 to 59 years) White / Caucasian 43 100.0% Not responsible for grandchildrenAsian 42 100.0% Not responsible for grandchildrenWhite alone, not Hispanic / Latino 38 100.0% Not responsible for grandchildrenGrandparents (60 years and over) White / Caucasian 27 19.6% Responsible for grandchildren112 80.4% Not responsible for grandchildrenAsian 23 100.0% Not responsible for grandchildrenWhite alone, not Hispanic / Latino 24 22.5% Responsible for grandchildren84 77.5% Not responsible for grandchildren