South Jefferson, OK (Oklahoma) Houses and Residents
| South Jefferson: | $72,054 |
| Oklahoma: | $191,700 |
Total population: 1,606 (Urban population: 0, Rural population: 1,746 (157 farm, 1,589 nonfarm))
Houses: 948 (735 occupied: 555 owner occupied, 180 renter occupied)
| % of renters here: | 24% |
| State: | 35% |
Housing density: 3 houses/condos per square mile
Median price asked for vacant for-sale houses and condos in 2022 in this county: $74,606.
Median contract rent in 2022: $314 (lower quartile is $169, upper quartile is $395)
Median rent asked for vacant for-rent units in 2022: $289
Median gross rent in South Jefferson, OK in 2022: $526
Housing units in South Jefferson with a mortgage: 116 (2 second mortgage, 0 home equity loan, 0 both second mortgage and home equity loan)
Houses without a mortgage: 239


Household type by relationship:
Households: 6,328- In family households: 5,356 (1,314 male householders, 456 female householders)
1,356 spouses, 1,769 children (1,568 natural, 56 adopted, 145 stepchildren), 162 grandchildren, 27 brothers or sisters, 51 parents, foster children, 65 other relatives, 127 non-relatives
- In nonfamily households: 972 (412 male householders (355 living alone)), 452 female householders (416 living alone)), 108 nonrelatives
- In group quarters: 144 (134 institutionalized population)
1,115 married couples with children.
348 single-parent households (105 men, 243 women).
89.9% of residents of South Jefferson speak English at home.
9.3% of residents speak Spanish at home (66% speak English very well, 17% speak English well, 14% speak English not well, 3% don't speak English at all).
0.2% of residents speak other Indo-European language at home (100% speak English very well).
0.2% of residents speak Asian or Pacific Island language at home (50% speak English very well, 50% speak English well).
0.4% of residents speak other language at home (100% speak English very well).
Foreign born population: 82 (3.9%)
(45.1% of them are naturalized citizens)
| Here: | 6.1 |
| State: | 6.1 |
| Here: | 4.9 |
| State: | 4.5 |

- Bedrooms in owner-occupied houses and condos in South Jefferson, Oklahoma
- 0no bedroom
- 131 bedroom
- 2042 bedrooms
- 2803 bedrooms
- 474 bedrooms
- 115+ bedrooms

- Bedrooms in renter-occupied apartments in South Jefferson, Oklahoma
- 0no bedroom
- 391 bedroom
- 842 bedrooms
- 513 bedrooms
- 64 bedrooms
- 05+ bedrooms

- Cars and other vehicles available in South Jefferson in owner-occupied houses/condos
- 33no vehicle
- 1401 vehicle
- 2332 vehicles
- 1143 vehicles
- 174 vehicles
- 185+ vehicles

- Cars and other vehicles available in South Jefferson in renter-occupied apartments
- 48no vehicle
- 761 vehicle
- 422 vehicles
- 123 vehicles
- 24 vehicles
- 05+ vehicles

- Rooms in owner-occupied houses in South Jefferson, Oklahoma
- 01 room
- 32 rooms
- 143 rooms
- 894 rooms
- 1455 rooms
- 1546 rooms
- 947 rooms
- 358 rooms
- 219+ rooms

- Rooms in renter-occupied apartments in South Jefferson, Oklahoma
- 01 room
- 122 rooms
- 193 rooms
- 564 rooms
- 635 rooms
- 196 rooms
- 77 rooms
- 48 rooms
- 09+ rooms


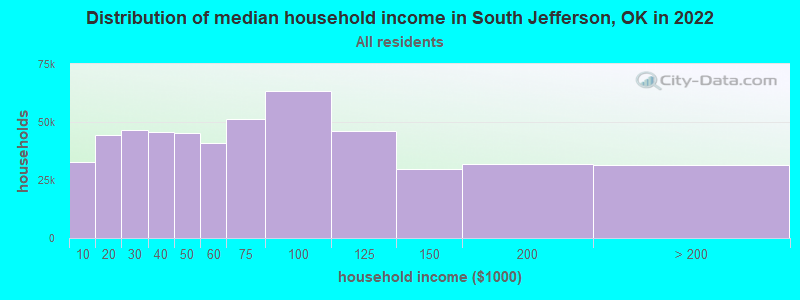
South Jefferson, OK household income distribution

- 19,687Less than $10,000
- 31,214$10,000 to $19,999
- 30,666$20,000 to $29,999
- 30,164$30,000 to $39,999
- 27,856$40,000 to $49,999
- 27,886$50,000 to $59,999
- 36,694$60,000 to $74,999
- 45,056$75,000 to $99,999
- 33,696$100,000 to $124,999
- 20,394$125,000 to $149,999
- 22,061$150,000 to $199,999
- 21,095$200,000 or more
Percentage of workers working in this county: 68.8%
Number of people working at home: 59 (8.5% of all workers)
Travel time to work (commute)
- Less than 5 minutes: 93
- 5 to 9 minutes: 96
- 10 to 14 minutes: 70
- 15 to 19 minutes: 75
- 20 to 24 minutes: 43
- 25 to 29 minutes: 6
- 30 to 34 minutes: 61
- 35 to 39 minutes: 15
- 40 to 44 minutes: 16
- 45 to 59 minutes: 51
- 60 to 89 minutes: 34
- 90 or more minutes: 34
Means of transportation to work:
- Drove a car alone: 457 (74.8%)
- Carpooled: 105 (17.2%)
- Bicycle: 2 (0.3%)
- Walked: 15 (2.5%)
- Other means: 15 (2.5%)
- Worked at home: 17 (2.8%)


- Year of entry for the foreign-born population in South Jefferson, Oklahoma
- 61995 to March 2000
- 111990 to 1994
- 01985 to 1989
- 31980 to 1984
- 61975 to 1979
- 81970 to 1974
- 31965 to 1969
- 1Before 1965
Most common places of birth for foreign-born residents (%):
| South Jefferson: | 94.7% (36) |
| Oklahoma: | 42.5% (55,971) |
| South Jefferson: | 5.3% (2) |
| Oklahoma: | 0.2% (320) |
Place of birth for U.S.-born residents:
- This state: 880
- Other state: 824
- Northeast: 9
- Midwest: 35
- South: 677
- West: 103
59% of South Jefferson residents lived in the same house 5 years ago.
Out of people who lived in different houses, 50% lived in this county.
Out of people who lived in different counties, 32% lived in Oklahoma.
Education attainment for males 25 years and older:
- No schooling: 24
- Nursery to 4th grade: 11
- 5th and 6th grade: 10
- 7th and 8th grade: 43
- 9th grade: 23
- 10th grade: 25
- 11th grade: 31
- 12th grade, no diploma: 20
- High school graduate (or equivalency): 191
- Less than 1 year of college: 32
- Some college more than 1 year, no degree: 67
- Associate degree: 6
- Bachelor's degree: 59
- Master's degree: 10
- Professional school degree: 2
- Doctorate degree: 5

Education attainment for females 25 years and older:
- No schooling: 9
- Nursery to 4th grade: 11
- 5th and 6th grade: 14
- 7th and 8th grade: 40
- 9th grade: 32
- 10th grade: 45
- 11th grade: 53
- 12th grade, no diploma: 18
- High school graduate (or equivalency): 241
- Less than 1 year of college: 58
- Some college more than 1 year, no degree: 75
- Associate degree: 12
- Bachelor's degree: 48
- Master's degree: 8
- Professional school degree: 4
- Doctorate degree: 2


Housing units in structures:
- One, detached: 759
- One, attached: 12
- Two: 62
- 3 or 4: 6
- 20 to 49: 5
- Mobile homes: 104
Median worth of mobile homes: $37,111
Housing units lacking complete kitchen facilities: 1.8%

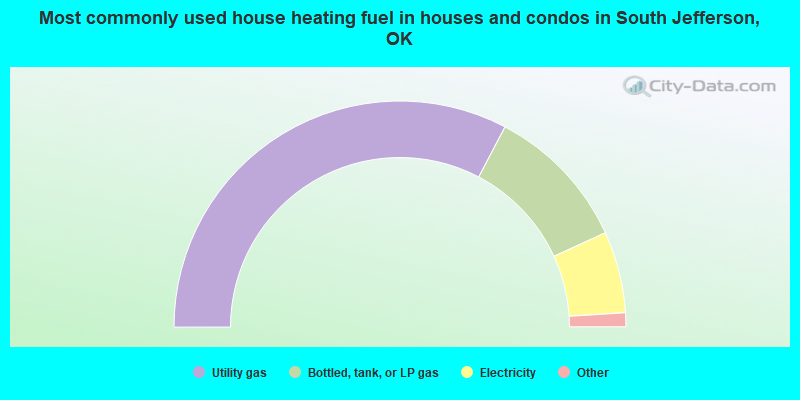
- 65.4%Utility gas
- 20.9%Bottled, tank, or LP gas
- 11.7%Electricity
- 1.8%Wood
- 0.2%Fuel oil, kerosene, etc.
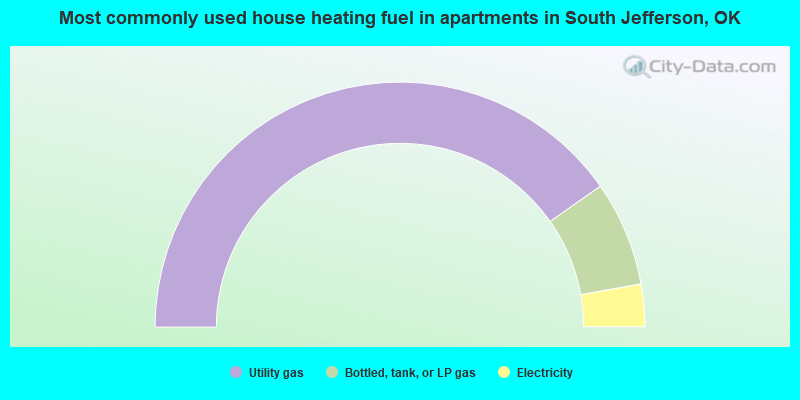
- 80.6%Utility gas
- 13.9%Bottled, tank, or LP gas
- 5.6%Electricity
Private vs. public school enrollment:
| Here: | 0.0% |
| Oklahoma: | 6.4% |
| Here: | 0.0% |
| Oklahoma: | 6.2% |
| Here: | 0.0% |
| Oklahoma: | 16.6% |


