South Jefferson, Oklahoma (OK) income map, earnings map, and wages data
The median household income in South Jefferson, OK in 2022 was $39,024, which was 52.9% less than the median annual income of $59,673 across the entire state of Oklahoma. Compared to the median income of $21,630 in 2000 this represents an increase of 44.6%. The per capita income in 2022 was $22,946, which means an increase of 47.0% compared to 2000 when it was $12,158.
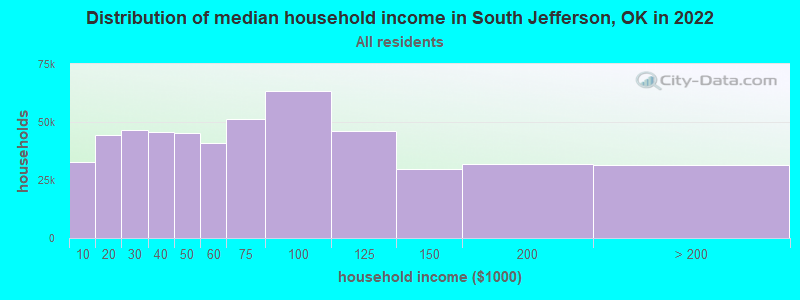
Income statistics for all residents
Median household income in South Jefferson, OK in 2022:| South Jefferson: | $39,025 |
| State: | $59,673 |
Change in median household income between 2000 and 2022:| South Jefferson, Oklahoma: | +80.4% |
| Oklahoma: | +78.7% |
Number of households with income < $10k:| South Jefferson: | 6.4% (32,675) |
| State: | 6.4% (100,950) |
Number of households with income $10k - 20k:| South Jefferson: | 8.8% (44,592) |
| State: | 8.8% (137,709) |
Number of households with income $20k - 30k:| South Jefferson: | 9.1% (46,511) |
| Oklahoma: | 9.1% (143,661) |
Number of households with income $30k - 40k:| South Jefferson: | 9.0% (45,681) |
| State: | 9.0% (141,098) |
Number of households with income $40k - 50k:| South Jefferson: | 8.9% (45,387) |
| State: | 8.9% (140,217) |
Number of households with income $50k - 60k:| South Jefferson: | 8.1% (41,082) |
| State: | 8.1% (126,882) |
Number of households with income $60k - 75k:| South Jefferson: | 10.0% (51,138) |
| State: | 10.0% (157,916) |
Number of households with income $75k - 100k:| South Jefferson: | 12.4% (63,151) |
| State: | 12.4% (195,015) |
Number of households with income $100k - 125k:| South Jefferson: | 9.0% (45,916) |
| State: | 9.0% (141,779) |
Number of households with income $125k - 150k:| South Jefferson: | 5.8% (29,657) |
| State: | 5.8% (91,594) |
Number of households with income $150k - 200k:| South Jefferson: | 6.3% (31,923) |
| State: | 6.3% (98,589) |
Number of households with income > $200k:| South Jefferson: | 6.2% (31,654) |
| State: | 6.2% (97,770) |
Aggregate household income in South Jefferson in 2022: $636,378,272
Median family income in South Jefferson in 2022:| South Jefferson: | $51,679 |
| State: | $75,476 |
Median non-family income in South Jefferson in 2022:| South Jefferson: | $23,140 |
| State: | $35,419 |
Change in median non-family income between 2000 and 2022:| South Jefferson, Oklahoma: | +87.2% |
| Oklahoma: | +83.2% |
Median per capita income in South Jefferson in 2022:| South Jefferson: | $22,946 |
| State: | $32,930 |
Change in median per capita income between 2000 and 2022:| South Jefferson, Oklahoma: | +88.7% |
| State: | +86.6% |
Income statistics for White residents
Median household income in South Jefferson, OK in 2022:| South Jefferson: | $39,851 |
| State: | $63,444 |
Change in median household income between 2000 and 2022:| South Jefferson, Oklahoma: | +80.9% |
| State: | +79.3% |
Number of households with income < $10k:| South Jefferson: | 5.5% (19,015) |
| State: | 5.5% (60,994) |
Number of households with income $10k - 20k:| South Jefferson: | 8.2% (28,482) |
| Oklahoma: | 8.2% (91,263) |
Number of households with income $20k - 30k:| South Jefferson: | 8.7% (30,253) |
| Oklahoma: | 8.7% (96,988) |
Number of households with income $30k - 40k:| South Jefferson: | 8.4% (29,066) |
| Oklahoma: | 8.4% (93,121) |
Number of households with income $40k - 50k:| South Jefferson: | 8.6% (29,746) |
| Oklahoma: | 8.6% (95,446) |
Number of households with income $50k - 60k:| South Jefferson: | 7.9% (27,347) |
| State: | 7.9% (87,723) |
Number of households with income $60k - 75k:| South Jefferson: | 9.9% (34,333) |
| Oklahoma: | 9.9% (109,955) |
Number of households with income $75k - 100k:| South Jefferson: | 12.9% (44,891) |
| State: | 12.9% (143,880) |
Number of households with income $100k - 125k:| South Jefferson: | 9.7% (33,659) |
| Oklahoma: | 9.7% (107,851) |
Number of households with income $125k - 150k:| South Jefferson: | 6.3% (21,772) |
| Oklahoma: | 6.3% (69,802) |
Number of households with income $150k - 200k:| South Jefferson: | 6.9% (23,956) |
| State: | 6.9% (76,863) |
Number of households with income > $200k:| South Jefferson: | 7.0% (24,341) |
| State: | 7.0% (78,099) |
Aggregate household income in South Jefferson in 2022: $445,370,846
Median family income in South Jefferson in 2022:| South Jefferson: | $56,249 |
| State: | $82,251 |
Number of families with income < $10k:| South Jefferson: | 9.5% (28) |
| State: | 3.4% (24,057) |
Number of families with income $10k - 20k:| South Jefferson: | 10.6% (31) |
| State: | 4.1% (29,440) |
Number of families with income $20k - 30k:| South Jefferson: | 11.8% (35) |
| State: | 5.7% (40,670) |
Number of families with income $30k - 40k:| South Jefferson: | 9.8% (29) |
| State: | 6.5% (46,540) |
Number of families with income $40k - 50k:| South Jefferson: | 11.8% (35) |
| State: | 7.7% (55,082) |
Number of families with income $50k - 60k:| South Jefferson: | 9.2% (27) |
| State: | 7.5% (53,408) |
Number of families with income $60k - 75k:| South Jefferson: | 7.1% (21) |
| State: | 10.4% (74,624) |
Number of families with income $75k - 100k:| South Jefferson: | 9.9% (29) |
| State: | 15.3% (109,679) |
Number of families with income $100k - 125k:| South Jefferson: | 10.0% (30) |
| State: | 12.0% (86,208) |
Number of families with income $150k - 200k:| South Jefferson: | 10.4% (31) |
| Oklahoma: | 9.4% (67,640) |
Median non-family income in South Jefferson in 2022:| South Jefferson: | $23,015 |
| State: | $36,941 |
Change in median non-family income between 2000 and 2022:| South Jefferson, Oklahoma: | +88.8% |
| Oklahoma: | +83.5% |
Median per capita income in South Jefferson in 2022:| South Jefferson: | $24,541 |
| State: | $37,390 |
Change in median per capita income between 2000 and 2022:| South Jefferson, Oklahoma: | +94.7% |
| Oklahoma: | +92.4% |
Income statistics for Hispanic or Latino residents
Median household income in South Jefferson, OK in 2022:| South Jefferson: | $24,225 |
| Oklahoma: | $52,856 |
Change in median household income between 2000 and 2022:| South Jefferson, Oklahoma: | +103.3% |
| State: | +89.4% |
Number of households with income < $10k:| South Jefferson: | 6.0% (1,699) |
| State: | 6.0% (7,958) |
Number of households with income $10k - 20k:| South Jefferson: | 8.4% (2,382) |
| State: | 8.4% (11,153) |
Number of households with income $20k - 30k:| South Jefferson: | 9.7% (2,776) |
| State: | 9.7% (13,003) |
Number of households with income $30k - 40k:| South Jefferson: | 11.7% (3,336) |
| State: | 11.7% (15,624) |
Number of households with income $40k - 50k:| South Jefferson: | 11.0% (3,139) |
| State: | 11.0% (14,697) |
Number of households with income $50k - 60k:| South Jefferson: | 9.6% (2,740) |
| State: | 9.6% (12,832) |
Number of households with income $60k - 75k:| South Jefferson: | 12.2% (3,484) |
| State: | 12.2% (16,321) |
Number of households with income $75k - 100k:| South Jefferson: | 12.5% (3,557) |
| Oklahoma: | 12.5% (16,668) |
Number of households with income $100k - 125k:| South Jefferson: | 7.5% (2,132) |
| Oklahoma: | 7.5% (9,988) |
Number of households with income $125k - 150k:| South Jefferson: | 4.5% (1,290) |
| Oklahoma: | 4.5% (6,042) |
Number of households with income $150k - 200k:| South Jefferson: | 3.8% (1,084) |
| State: | 3.8% (5,080) |
Number of households with income > $200k:| South Jefferson: | 3.0% (867) |
| State: | 3.0% (4,063) |
Aggregate household income in South Jefferson in 2022: $6,152,800
Median family income in South Jefferson in 2022:| South Jefferson: | $23,771 |
| State: | $55,896 |
Number of families with income < $10k:| South Jefferson: | 11.9% (6) |
| State: | 5.1% (5,166) |
Number of families with income $10k - 20k:| South Jefferson: | 12.0% (6) |
| Oklahoma: | 6.4% (6,492) |
Number of families with income $20k - 30k:| South Jefferson: | 13.4% (6) |
| State: | 8.4% (8,466) |
Number of families with income $30k - 40k:| South Jefferson: | 15.1% (7) |
| State: | 12.3% (12,391) |
Number of families with income $40k - 50k:| South Jefferson: | 15.4% (7) |
| State: | 11.7% (11,827) |
Number of families with income $50k - 60k:| South Jefferson: | 9.8% (5) |
| State: | 9.7% (9,746) |
Number of families with income $60k - 75k:| South Jefferson: | 6.9% (3) |
| Oklahoma: | 12.9% (13,025) |
Number of families with income $75k - 100k:| South Jefferson: | 6.9% (3) |
| State: | 13.1% (13,152) |
Number of families with income $100k - 125k:| South Jefferson: | 5.3% (2) |
| State: | 8.2% (8,262) |
Number of families with income $150k - 200k:| South Jefferson: | 3.5% (2) |
| Oklahoma: | 3.9% (3,936) |
Median non-family income in South Jefferson in 2022:| South Jefferson: | $11,842 |
| State: | $33,093 |
Change in median non-family income between 2000 and 2022:| South Jefferson, Oklahoma: | +89.5% |
| State: | +64.0% |
Median per capita income in South Jefferson in 2022:| South Jefferson: | $11,057 |
| Oklahoma: | $19,473 |
Change in median per capita income between 2000 and 2022:| South Jefferson, Oklahoma: | +104.2% |
| State: | +97.3% |
Income statistics for American Indian and Alaska Native residents
Median household income in South Jefferson, OK in 2022:| South Jefferson: | $22,980 |
| State: | $53,261 |
Change in median household income between 2000 and 2022:| South Jefferson, Oklahoma: | +93.5% |
| State: | +94.7% |
Number of households with income < $10k:| South Jefferson: | 8.0% (1,722) |
| State: | 8.0% (7,959) |
Number of households with income $10k - 20k:| South Jefferson: | 11.2% (2,414) |
| State: | 11.2% (11,175) |
Number of households with income $20k - 30k:| South Jefferson: | 9.7% (2,089) |
| State: | 9.7% (9,654) |
Number of households with income $30k - 40k:| South Jefferson: | 9.2% (1,969) |
| State: | 9.1% (9,092) |
Number of households with income $40k - 50k:| South Jefferson: | 9.1% (1,955) |
| State: | 9.1% (9,020) |
Number of households with income $50k - 60k:| South Jefferson: | 8.7% (1,878) |
| State: | 8.8% (8,714) |
Number of households with income $60k - 75k:| South Jefferson: | 10.7% (2,296) |
| Oklahoma: | 10.7% (10,616) |
Number of households with income $75k - 100k:| South Jefferson: | 11.5% (2,466) |
| State: | 11.5% (11,402) |
Number of households with income $100k - 125k:| South Jefferson: | 8.8% (1,894) |
| Oklahoma: | 8.8% (8,769) |
Number of households with income $125k - 150k:| South Jefferson: | 5.0% (1,076) |
| State: | 5.0% (4,965) |
Number of households with income $150k - 200k:| South Jefferson: | 4.5% (975) |
| State: | 4.5% (4,512) |
Number of households with income > $200k:| South Jefferson: | 3.6% (774) |
| State: | 3.6% (3,569) |
Aggregate household income in South Jefferson in 2022: $862,503
Median family income in South Jefferson in 2022:| South Jefferson: | $22,060 |
| State: | $61,590 |
Median non-family income in South Jefferson in 2022:| South Jefferson: | $25,412 |
| State: | $30,288 |
Change in median non-family income between 2000 and 2022:| South Jefferson, Oklahoma: | +93.6% |
| Oklahoma: | +92.2% |
Median per capita income in South Jefferson in 2022:| South Jefferson: | $27,899 |
| Oklahoma: | $25,549 |
Change in median per capita income between 2000 and 2022:| South Jefferson, Oklahoma: | +118.8% |
| State: | +118.7% |
Income statistics for Multirace residents
Median household income in South Jefferson, OK in 2022:| South Jefferson: | $42,817 |
| State: | $53,626 |
Change in median household income between 2000 and 2022:| South Jefferson, Oklahoma: | +85.2% |
| State: | +81.7% |
Number of households with income < $10k:| South Jefferson: | 6.8% (4,774) |
| Oklahoma: | 6.8% (11,975) |
Number of households with income $10k - 20k:| South Jefferson: | 8.9% (6,257) |
| Oklahoma: | 8.9% (15,797) |
Number of households with income $20k - 30k:| South Jefferson: | 10.3% (7,201) |
| State: | 10.2% (18,071) |
Number of households with income $30k - 40k:| South Jefferson: | 11.1% (7,777) |
| State: | 11.0% (19,477) |
Number of households with income $40k - 50k:| South Jefferson: | 9.4% (6,603) |
| State: | 9.3% (16,501) |
Number of households with income $50k - 60k:| South Jefferson: | 8.9% (6,219) |
| State: | 8.9% (15,635) |
Number of households with income $60k - 75k:| South Jefferson: | 10.9% (7,683) |
| State: | 10.9% (19,250) |
Number of households with income $75k - 100k:| South Jefferson: | 11.4% (8,024) |
| State: | 11.5% (20,279) |
Number of households with income $100k - 125k:| South Jefferson: | 7.9% (5,569) |
| State: | 8.0% (14,067) |
Number of households with income $125k - 150k:| South Jefferson: | 4.9% (3,420) |
| Oklahoma: | 4.9% (8,612) |
Number of households with income $150k - 200k:| South Jefferson: | 5.0% (3,513) |
| State: | 5.0% (8,897) |
Number of households with income > $200k:| South Jefferson: | 4.5% (3,167) |
| State: | 4.5% (7,970) |
Aggregate household income in South Jefferson in 2022: $2,243,197
Median family income in South Jefferson in 2022:| South Jefferson: | $14,865 |
| Oklahoma: | $62,946 |
Number of families with income < $10k:| South Jefferson: | 65.6% (11) |
| State: | 5.1% (6,084) |
Number of families with income $50k - 60k:| South Jefferson: | 34.4% (6) |
| Oklahoma: | 7.7% (9,220) |
Median non-family income in South Jefferson in 2022:| South Jefferson: | $50,191 |
| Oklahoma: | $34,773 |
Change in median non-family income between 2000 and 2022:| South Jefferson, Oklahoma: | +94.3% |
| Oklahoma: | +103.1% |
Median per capita income in South Jefferson in 2022:| South Jefferson: | $11,923 |
| Oklahoma: | $23,085 |
Change in median per capita income between 2000 and 2022:| South Jefferson, Oklahoma: | +94.4% |
| State: | +93.8% |
Income statistics for other residents
Number of households with income < $10k:| South Jefferson: | 7.5% (3) |
| State: | 8.1% (3,420) |
Number of households with income $10k - 20k:| South Jefferson: | 10.0% (4) |
| State: | 8.6% (3,635) |
Number of households with income $20k - 30k:| South Jefferson: | 10.0% (4) |
| State: | 9.0% (3,808) |
Number of households with income $30k - 40k:| South Jefferson: | 7.5% (3) |
| Oklahoma: | 11.4% (4,791) |
Number of households with income $40k - 50k:| South Jefferson: | 7.5% (3) |
| Oklahoma: | 10.1% (4,256) |
Number of households with income $50k - 60k:| South Jefferson: | 12.5% (5) |
| Oklahoma: | 11.7% (4,946) |
Number of households with income $60k - 75k:| South Jefferson: | 15.0% (6) |
| State: | 12.7% (5,342) |
Number of households with income $75k - 100k:| South Jefferson: | 12.5% (5) |
| State: | 11.4% (4,792) |
Number of households with income $100k - 125k:| South Jefferson: | 7.5% (3) |
| State: | 6.1% (2,568) |
Number of households with income $125k - 150k:| South Jefferson: | 5.0% (2) |
| State: | 5.4% (2,298) |
Number of households with income $150k - 200k:| South Jefferson: | 2.5% (1) |
| Oklahoma: | 3.4% (1,427) |
Number of households with income > $200k:| South Jefferson: | 2.5% (1) |
| Oklahoma: | 2.2% (918) |
Aggregate household income in South Jefferson in 2022: $2,606,033
Median family income in South Jefferson in 2022:| South Jefferson: | $28,813 |
| State: | $55,625 |
Number of families with income < $10k:| South Jefferson: | 13.6% (6) |
| State: | 5.7% (1,864) |
Number of families with income $10k - 20k:| South Jefferson: | 15.9% (7) |
| Oklahoma: | 6.8% (2,219) |
Number of families with income $20k - 30k:| South Jefferson: | 2.8% (1) |
| State: | 8.5% (2,761) |
Number of families with income $30k - 40k:| South Jefferson: | 9.3% (4) |
| Oklahoma: | 11.1% (3,618) |
Number of families with income $100k - 125k:| South Jefferson: | 58.4% (26) |
| Oklahoma: | 6.3% (2,046) |
Median non-family income in South Jefferson in 2022:| South Jefferson: | $9,696 |
| Oklahoma: | $28,279 |
Change in median non-family income between 2000 and 2022:| South Jefferson, Oklahoma: | +55.1% |
| Oklahoma: | +38.2% |
Median per capita income in South Jefferson in 2022:| South Jefferson: | $17,076 |
| State: | $21,007 |
Change in median per capita income between 2000 and 2022:| South Jefferson, Oklahoma: | +123.5% |
| State: | +119.2% |