Santa Fe, NM (New Mexico) Houses and Residents
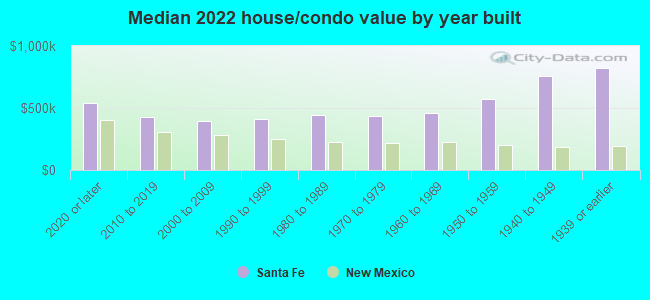
| Santa Fe: | $449,900 |
| New Mexico: | $243,100 |
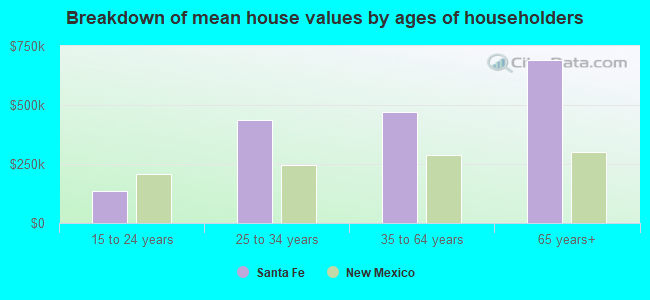
Mean price in 2022:
Detached houses: $595,886
Here: $595,886 State: $322,045 Townhouses or other attached units: $541,715
Here: $541,715 State: $284,053 In 2-unit structures: $1,103,745
Here: $1,103,745 State: $354,971 In 3-to-4-unit structures: $308,022
Here: $308,022 State: $235,720 In 5-or-more-unit structures: $388,240
Here: $388,240 State: $217,304 Mobile homes: $100,561
Here: $100,561 State: $117,675
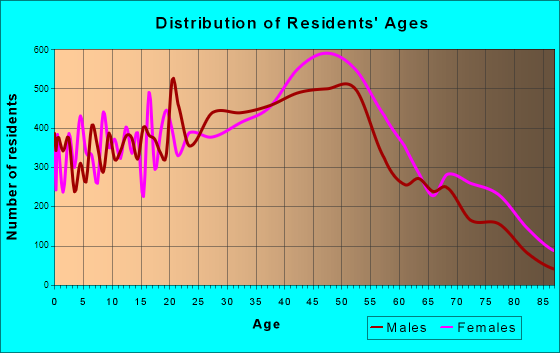
Total population: 70,297 (Urban population: 60,600, Rural population: 1,205 (all nonfarm))
Houses: 47,460 (43,401 occupied: 26,446 owner occupied, 16,955 renter occupied)
| % of renters here: | 39% |
| State: | 29% |
Housing density: 1,271 houses/condos per square mile
Median price asked for vacant for-sale houses and condos in 2022: $139,456.
Median contract rent in 2022: $1,233 (lower quartile is $866, upper quartile is $1,627)
Median rent asked for vacant for-rent units in 2022: $2,112
Median gross rent in Santa Fe, NM in 2022: $1,316
Housing units in Santa Fe with a mortgage: 15,863 (554 second mortgage, 0 home equity loan, 128 both second mortgage and home equity loan)
Houses without a mortgage: 221
Median household income for houses/condos with a mortgage: $99,706
Median household income for apartments without a mortgage: $72,777
Median monthly housing costs: $1,286
Compare current foreclosures in Santa Fe, NM:
| Photo | Address | Area | Beds / Baths | Price | Details |
|---|---|---|---|---|---|

|
#1
Avenida De Las Alturas
Santa Fe, NM 87505
|
1,644 sq. feet
|
2 baths 3 beds |
$509,000
|
show details |

|
#2
Willy Rd
Santa Fe, NM 87507
|
2,097 sq. feet
|
2 baths 3 beds |
show details | |

|
#3
Candela St
Santa Fe, NM 87505
|
2,032 sq. feet
|
2 baths 3 beds |
show details | |

|
#4
Avenida Aldea
Santa Fe, NM 87507
|
1,098 sq. feet
|
1 baths 2 beds |
show details | |

|
#5
Candela St
Santa Fe, NM 87505
|
1,845 sq. feet
|
2 baths 3 beds |
show details | |

|
#6
Sibley Rd # A
Santa Fe, NM 87508
|
2,887 sq. feet
|
2 baths 4 beds |
show details | |

|
#7
Camino Vistas Encantada
Santa Fe, NM 87507
|
2,106 sq. feet
|
2 baths 4 beds |
show details | |

|
#8
Ventoso
Santa Fe, NM 87505
|
3,141 sq. feet
|
3 baths 3 beds |
show details | |

|
#9
Jemez Rd
Santa Fe, NM 87507
|
1,516 sq. feet
|
- baths 3 beds |
show details | |

|
#10
Griffi 2109
Santa Fe, NM 87501
|
- sq. feet
|
- baths - beds |
show details |
| Photo | Address | Area | Beds / Baths | Price | Details |
|---|---|---|---|---|---|

|
#11
Griffin St, C O Kay Carlson Notary Pu
Santa Fe, NM 87501
|
- sq. feet
|
- baths - beds |
show details | |

|
#12
Jaramillo Ln
Santa Fe, NM 87507
|
- sq. feet
|
- baths - beds |
show details | |

|
#13
Sunset St Apt H
Santa Fe, NM 87501
|
- sq. feet
|
- baths - beds |
show details | |

|
#14
Woods Loop
Santa Fe, NM 87505
|
- sq. feet
|
- baths - beds |
show details | |

|
#15
Zepol Rd, Trlr 123
Santa Fe, NM 87507
|
- sq. feet
|
- baths - beds |
show details | |

|
#16
Santo Domingo St Unit C
Santa Fe, NM 87507
|
- sq. feet
|
- baths - beds |
show details | |

|
#17
Griffi 2212
Santa Fe, NM 87501
|
- sq. feet
|
- baths - beds |
show details | |

|
#18
Griffi 2112
Santa Fe, NM 87501
|
- sq. feet
|
- baths - beds |
show details | |

|
#19
Griffi 2119
Santa Fe, NM 87501
|
- sq. feet
|
- baths - beds |
show details | |

|
#20
Griffi 2210
Santa Fe, NM 87501
|
- sq. feet
|
- baths - beds |
show details |
| Photo | Address | Area | Beds / Baths | Price | Details |
|---|---|---|---|---|---|

|
#21
Griffi 1401
Santa Fe, NM 87501
|
- sq. feet
|
- baths - beds |
show details | |

|
#22
Bonitas Loop
Santa Fe, NM 87507
|
- sq. feet
|
- baths - beds |
show details | |

|
#23
Jemez Rd, Trlr 32
Santa Fe, NM 87507
|
- sq. feet
|
- baths - beds |
show details | |

|
#24
Griffi 1206
Santa Fe, NM 87501
|
- sq. feet
|
- baths - beds |
show details | |

|
#25
Viento Del Norte
Santa Fe, NM 87507
|
- sq. feet
|
- baths - beds |
show details | |

|
#26
Agua Fria St
Santa Fe, NM 87507
|
- sq. feet
|
- baths - beds |
show details | |

|
#27
Beckner Rd, Unit 5101
Santa Fe, NM 87507
|
- sq. feet
|
- baths - beds |
show details | |

|
#28
Zepol Rd Apt 105
Santa Fe, NM 87507
|
- sq. feet
|
- baths - beds |
show details | |

|
#29
Gonzales Rd # 8
Santa Fe, NM 87501
|
- sq. feet
|
- baths - beds |
show details | |

|
#30
Cochiti St
Santa Fe, NM 87505
|
- sq. feet
|
- baths - beds |
show details |
| Photo | Address | Area | Beds / Baths | Price | Details |
|---|---|---|---|---|---|

|
#31
Calle Lisa
Santa Fe, NM 87507
|
- sq. feet
|
- baths - beds |
show details | |

|
#32
N Guadalupe St # 620
Santa Fe, NM 87501
|
- sq. feet
|
- baths - beds |
show details | |

|
#33
Calle Carmilita
Santa Fe, NM 87505
|
- sq. feet
|
- baths - beds |
show details | |

|
#34
Pinon Vista St
Santa Fe, NM 87501
|
- sq. feet
|
- baths - beds |
show details | |

|
#35
Calle Roble
Santa Fe, NM 87501
|
- sq. feet
|
- baths - beds |
show details | |

|
#36
Luna Dr
Santa Fe, NM 87508
|
- sq. feet
|
- baths - beds |
show details | |

|
#37
Carlson Rd
Santa Fe, NM 87508
|
- sq. feet
|
- baths - beds |
show details | |

|
#38
Hopi Rd
Santa Fe, NM 87505
|
- sq. feet
|
- baths - beds |
show details | |

|
#39
Mesa Del Oro Loop
Santa Fe, NM 87507
|
- sq. feet
|
- baths - beds |
show details | |

|
#40
Calle Ensenada
Santa Fe, NM 87505
|
- sq. feet
|
- baths - beds |
show details |
| Photo | Address | Area | Beds / Baths | Price | Details |
|---|---|---|---|---|---|

|
#41
1/2 Bishops Lodge Rd
Santa Fe, NM 87501
|
- sq. feet
|
- baths - beds |
show details | |

|
#42
Emily Rd
Santa Fe, NM 87508
|
- sq. feet
|
- baths - beds |
show details | |

|
#43
County Road 84
Santa Fe, NM 87506
|
- sq. feet
|
- baths - beds |
show details | |

|
#44
Granada St
Santa Fe, NM 87505
|
- sq. feet
|
- baths - beds |
show details | |

|
#45
Paseo De La Conquistadora
Santa Fe, NM 87501
|
- sq. feet
|
- baths - beds |
show details | |

|
#46
W Alameda St
Santa Fe, NM 87507
|
- sq. feet
|
- baths - beds |
show details | |

|
#47
Camino Consuelo
Santa Fe, NM 87507
|
- sq. feet
|
- baths - beds |
show details | |

|
#48
Artifact Pl
Santa Fe, NM 87508
|
- sq. feet
|
- baths - beds |
show details | |

|
#49
Miguel Chavez Rd Unit 116
Santa Fe, NM 87505
|
- sq. feet
|
- baths - beds |
show details | |

|
Check over 1 million property listings on Foreclosure.com!
|
browse all offers | |||


 | Renting vs Buying in Santa Fe (10 replies) |
| Rental Homes in Santa Fe (4 replies) |
| "Good" areas of Santa Fe for rentals (7 replies) |
| Info on Off Grid Rentals in Santa Fe (0 replies) |
| Santa Fe neighborhoods to consider for rental (3 replies) |
| Is Santa Fe This Bad? (139 replies) |
Median year apartment built: 1987
Household type by relationship:
Households: 89,001- Male householders: 19,775 (8,345 living alone), Female householders: 23,626 (10,089 living alone)
13,880 spouses (13,789 opposite-sex spouses), 3,155 unmarried partners, (2,716 opposite-sex unmarried partners), 18,839 children (17,858 natural, 82 adopted, 899 stepchildren), 1,444 grandchildren, 1,032 brothers or sisters, 1,152 parents, 0 foster children, 1,600 other relatives, 2,560 non-relatives
- In group quarters: 1,938
Size of family households: 10,787 2-persons, 5,770 3-persons, 3,505 4-persons, 1,076 5-persons, 321 6-persons, 129 7-or-more-persons.
Size of nonfamily households: 18,434 1-person, 2,606 2-persons, 773 3-persons.
5,925 married couples with children.
6,222 single-parent households (1,367 men, 4,855 women).
68.0% of residents of Santa Fe speak English at home.
29.1% of residents speak Spanish at home (65% speak English very well, 20% speak English well, 10% speak English not well, 5% don't speak English at all).
2.6% of residents speak other Indo-European language at home (86% speak English very well, 10% speak English well, 4% speak English not well).
1.4% of residents speak Asian or Pacific Island language at home (79% speak English very well, 7% speak English well, 14% speak English not well).
0.6% of residents speak other language at home (86% speak English very well, 13% speak English well, 1% speak English not well).
Foreign born population: 13,897 (15.6%)
(42.2% of them are naturalized citizens)
| Here: | 5.9 |
| State: | 5.9 |
| Here: | 3.8 |
| State: | 4.2 |
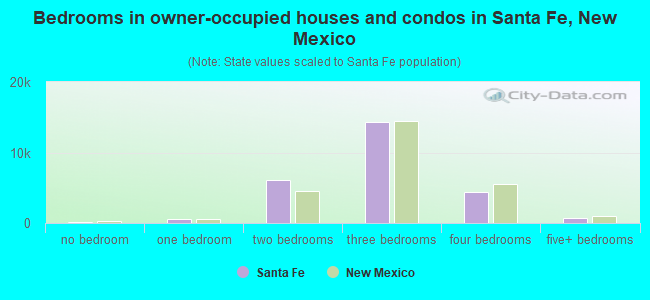
- Bedrooms in owner-occupied houses and condos in Santa Fe, New Mexico
- 210no bedroom
- 5271 bedroom
- 6,1302 bedrooms
- 14,3473 bedrooms
- 4,4594 bedrooms
- 7735+ bedrooms
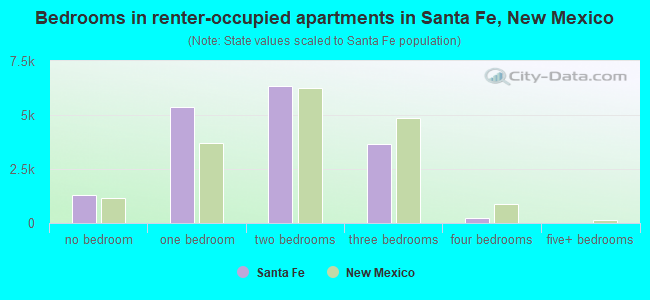
- Bedrooms in renter-occupied apartments in Santa Fe, New Mexico
- 1,313no bedroom
- 5,3891 bedroom
- 6,3562 bedrooms
- 3,6453 bedrooms
- 2524 bedrooms
- 05+ bedrooms
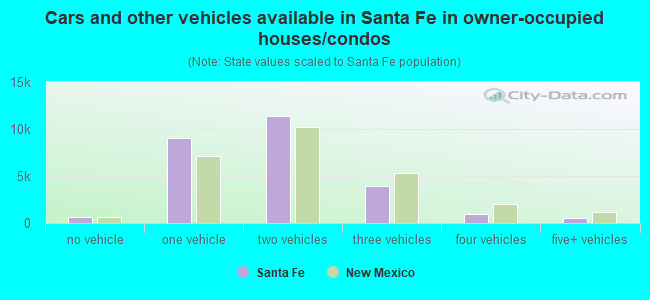
- Cars and other vehicles available in Santa Fe in owner-occupied houses/condos
- 603no vehicle
- 9,0031 vehicle
- 11,3922 vehicles
- 3,9343 vehicles
- 1,0024 vehicles
- 5125+ vehicles
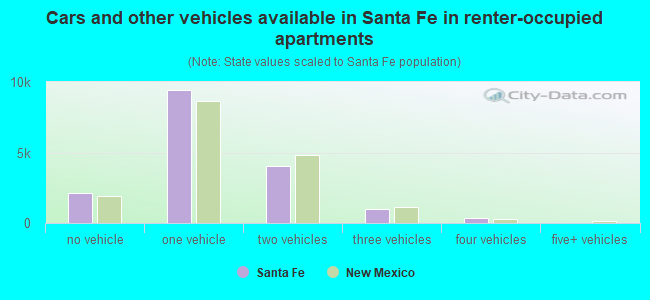
- Cars and other vehicles available in Santa Fe in renter-occupied apartments
- 2,139no vehicle
- 9,4681 vehicle
- 4,0102 vehicles
- 9763 vehicles
- 3624 vehicles
- 05+ vehicles
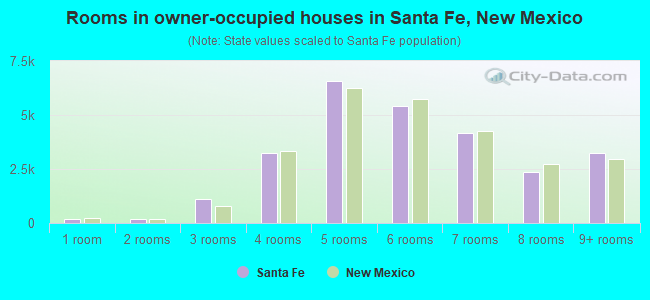
- Rooms in owner-occupied houses in Santa Fe, New Mexico
- 1641 room
- 1772 rooms
- 1,1333 rooms
- 3,2484 rooms
- 6,5515 rooms
- 5,4026 rooms
- 4,1457 rooms
- 2,3778 rooms
- 3,2499+ rooms
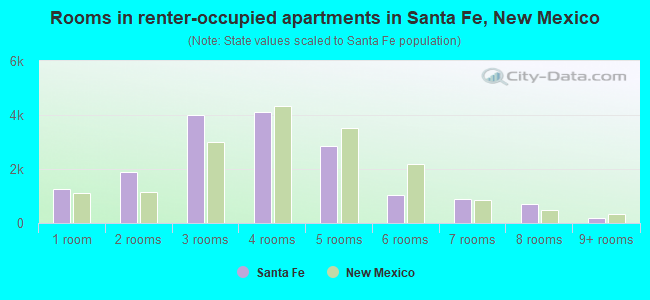
- Rooms in renter-occupied apartments in Santa Fe, New Mexico
- 1,2611 room
- 1,9042 rooms
- 4,0023 rooms
- 4,1104 rooms
- 2,8705 rooms
- 1,0276 rooms
- 8877 rooms
- 7198 rooms
- 1759+ rooms
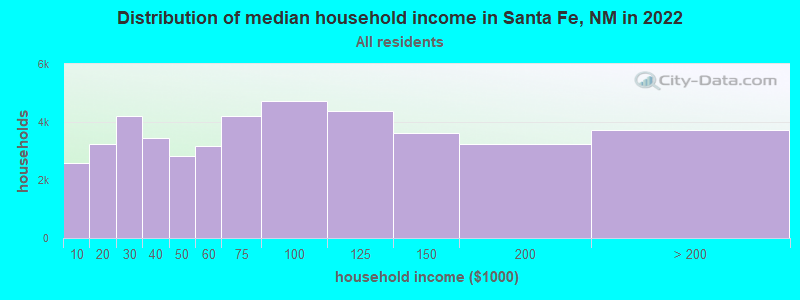
Santa Fe, NM household income distribution

- 2,573Less than $10,000
- 3,257$10,000 to $19,999
- 4,220$20,000 to $29,999
- 3,455$30,000 to $39,999
- 2,828$40,000 to $49,999
- 3,184$50,000 to $59,999
- 4,198$60,000 to $74,999
- 4,724$75,000 to $99,999
- 4,372$100,000 to $124,999
- 3,636$125,000 to $149,999
- 3,245$150,000 to $199,999
- 3,709$200,000 or more
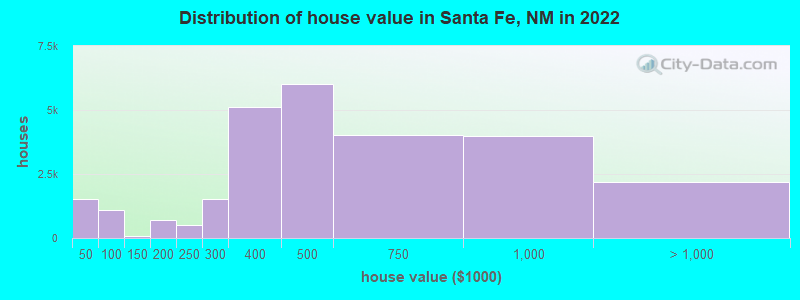
Home value of owner - occupied houses in 2022 in Santa Fe, NM
-
- 177Less than $10,000
- 68$10,000 to $14,999
- 183$15,000 to $19,999
- 282$20,000 to $24,999
- 167$25,000 to $29,999
- 189$30,000 to $34,999
- 134$35,000 to $39,999
- 323$40,000 to $49,999
- 298$50,000 to $59,999
- 65$60,000 to $69,999
- 51$70,000 to $79,999
- 345$80,000 to $89,999
- 37$100,000 to $124,999
- 49$125,000 to $149,999
- 400$150,000 to $174,999
- 321$175,000 to $199,999
- 494$200,000 to $249,999
- 1,510$250,000 to $299,999
- 5,130$300,000 to $399,999
- 6,016$400,000 to $499,999
- 4,022$500,000 to $749,999
- 3,985$750,000 to $999,999
- 1,103$1,000,000 to $1,499,999
- 678$1,500,000 to $1,999,999
- 419$2,000,000 or more
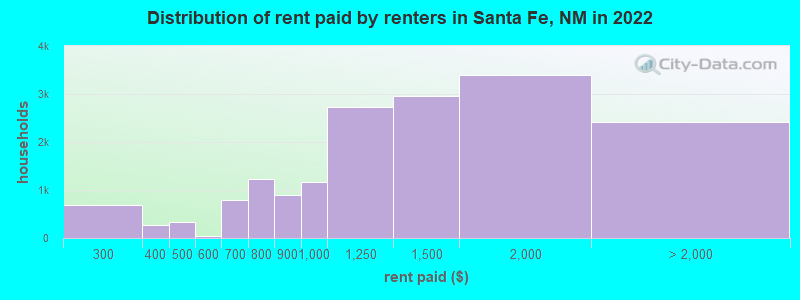
Rent paid by renters in 2022 in Santa Fe, NM
-
- 29$150 to $199
- 346$200 to $249
- 347$250 to $299
- 279$300 to $349
- 169$400 to $449
- 164$450 to $499
- 44$550 to $599
- 613$600 to $649
- 179$650 to $699
- 290$700 to $749
- 943$750 to $799
- 903$800 to $899
- 1,161$900 to $999
- 2,722$1,000 to $1,249
- 2,953$1,250 to $1,499
- 3,391$1,500 to $1,999
- 824$2,000 to $2,499
- 156$2,500 to $2,999
- 123$3,000 to $3,499
- 366$3,500 or more
- 953No cash rent
Percentage of workers working in this county: 93.0%
Number of people working at home: 7,013 (15.8% of all workers)
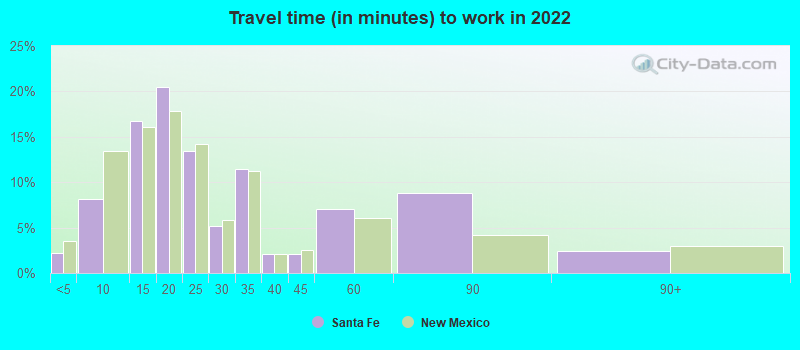
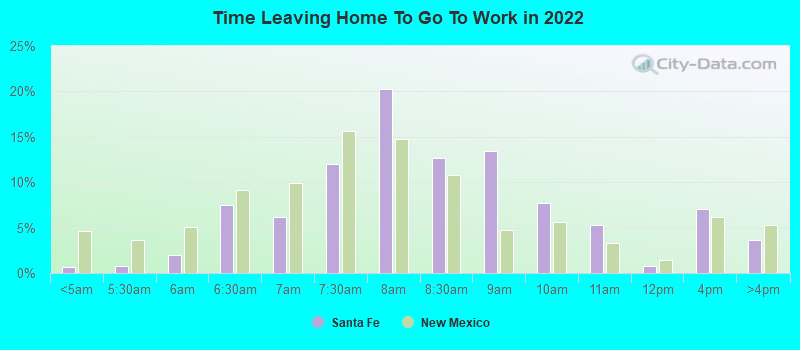
Travel time to work (commute)
- Less than 5 minutes: 1,095
- 5 to 9 minutes: 3,902
- 10 to 14 minutes: 7,898
- 15 to 19 minutes: 10,043
- 20 to 24 minutes: 4,997
- 25 to 29 minutes: 1,970
- 30 to 34 minutes: 3,870
- 35 to 39 minutes: 39
- 40 to 44 minutes: 502
- 45 to 59 minutes: 1,744
- 60 to 89 minutes: 885
- 90 or more minutes: 558
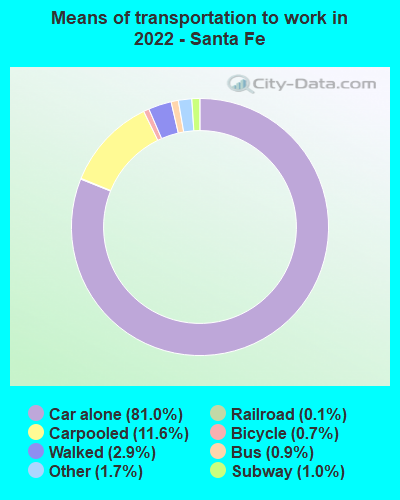
Means of transportation to work:
- Drove a car alone: 42,197 (71.4%)
- Carpooled: 6,046 (10.2%)
- Bus: 482 (0.8%)
- Long-distance train or commuter rail: 524 (0.9%)
- Light rail, streetcar or trolley: 67 (0.1%)
- Taxi: 886 (1.5%)
- Bicycle: 389 (0.7%)
- Walked: 1,525 (2.6%)
- Worked at home: 7,013 (11.9%)
- Unemployment by race in 2022
- Unemployment rate for White non-Hispanic residents
- 6.7%Males
- 3.5%Females
- Unemployment rate for Black residents
- 3.9%Males
- Unemployment rate for American Indian and Alaska Native residents
- 3.9%Males
- 11.0%Females
- Unemployment rate for Asian residents
- 5.9%Males
- Unemployment rate for other race residents
- 6.3%Males
- 2.6%Females
- Unemployment rate for two or more race residents
- 4.0%Males
- 1.2%Females
- Unemployment rate for Hispanic or Latino residents
- 5.3%Males
- 1.3%Females
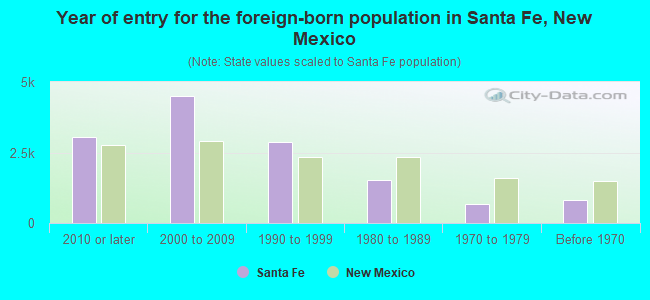
- Year of entry for the foreign-born population in Santa Fe, New Mexico
- 3,0562010 or later
- 4,4932000 to 2009
- 2,8811990 to 1999
- 1,5371980 to 1989
- 6591970 to 1979
- 828Before 1970
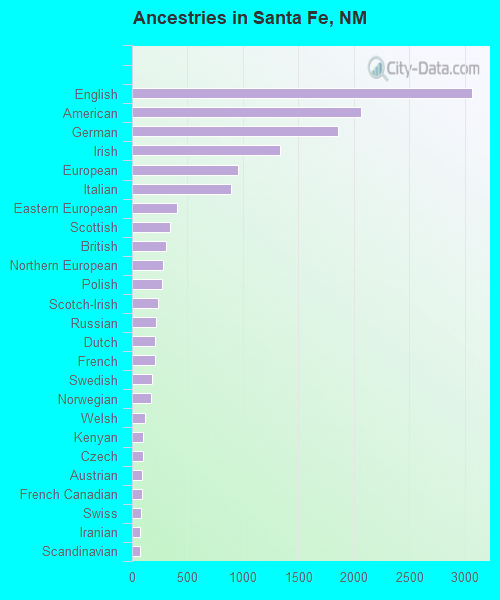
First ancestries reported:
- English: 3,066 (6.1%)
- American: 2,067 (4.1%)
- German: 1,860 (3.7%)
- Irish: 1,335 (2.6%)
- European: 959 (1.9%)
- Italian: 896 (1.8%)
- Eastern European: 402 (0.8%)
- Scottish: 339 (0.7%)
- British: 307 (0.6%)
- Northern European: 283 (0.6%)
- Polish: 267 (0.5%)
- Scotch-Irish: 230 (0.5%)
- Russian: 220 (0.4%)
- Dutch: 209 (0.4%)
- French: 205 (0.4%)
- Swedish: 177 (0.4%)
- Norwegian: 175 (0.3%)
- Welsh: 114 (0.2%)
- Kenyan: 100 (0.2%)
- Czech: 96 (0.2%)
- Austrian: 90 (0.2%)
- French Canadian: 89 (0.2%)
- Swiss: 83 (0.2%)
- Iranian: 73 (0.1%)
- Scandinavian: 71 (0.1%)
- South African: 59 (0.1%)
- Greek: 55 (0.1%)
- Slovak: 52 (0.1%)
- Cajun: 51 (0.1%)
- Finnish: 48 (0.09%)
- Basque: 43 (0.09%)
- Belgian: 37 (0.07%)
- Ukrainian: 37 (0.07%)
- Hungarian: 36 (0.07%)
- African: 33 (0.07%)
- Slavic: 33 (0.07%)
- Australian: 33 (0.07%)
- Lithuanian: 27 (0.05%)
- Canadian: 27 (0.05%)
- Portuguese: 27 (0.05%)
- Serbian: 26 (0.05%)
- Croatian: 25 (0.05%)
- Romanian: 22 (0.04%)
- Danish: 21 (0.04%)
- Jamaican: 19 (0.04%)
- Celtic: 17 (0.03%)
- Turkish: 12 (0.02%)
- Albanian: 11 (0.02%)
- Afghan: 11 (0.02%)
- Brazilian: 9 (0.02%)
- Arab: 7 (0.01%)
- Estonian: 4 (0.01%)
Most common places of birth for foreign-born residents (%):
| Santa Fe: | 57.1% (7,479) |
| New Mexico: | 66.5% (129,316) |
| Santa Fe: | 7.0% (915) |
| New Mexico: | 1.1% (2,049) |
| Santa Fe: | 3.8% (493) |
| New Mexico: | 0.8% (1,561) |
| Santa Fe: | 2.9% (385) |
| New Mexico: | 1.6% (3,140) |
| Santa Fe: | 2.1% (276) |
| New Mexico: | 1.9% (3,753) |
| Santa Fe: | 1.8% (230) |
| New Mexico: | 1.1% (2,195) |
Place of birth for U.S.-born residents:
- This state: 40,104
- Other state: 33,599
- Northeast: 8,345
- Midwest: 7,434
- South: 8,369
- West: 9,451
86.8% of Santa Fe residents lived in the same house 1 years ago.
Out of people who lived in different houses, 37.3% lived in this county.
Out of people who lived in different counties, 28.9% lived in New Mexico.
| Santa Fe: | 86.8% |
| State average: | 88.2% |
Education attainment for males 25 years and older:
- No schooling: 776
- Nursery to 4th grade: 117
- 5th and 6th grade: 388
- 7th and 8th grade: 407
- 9th grade: 283
- 10th grade: 380
- 11th grade: 256
- 12th grade, no diploma: 704
- High school graduate (or equivalency): 5,407
- Less than 1 year of college: 2,436
- Some college more than 1 year, no degree: 4,448
- Associate degree: 1,997
- Bachelor's degree: 7,808
- Master's degree: 3,638
- Professional school degree: 1,585
- Doctorate degree: 1,557

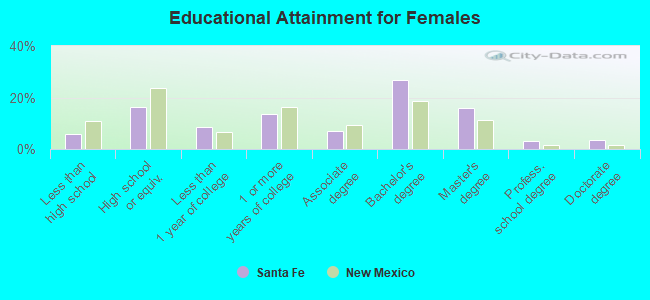
Education attainment for females 25 years and older:
- No schooling: 347
- Nursery to 4th grade: 294
- 5th and 6th grade: 618
- 7th and 8th grade: 247
- 9th grade: 303
- 10th grade: 108
- 11th grade: 187
- 12th grade, no diploma: 33
- High school graduate (or equivalency): 5,805
- Less than 1 year of college: 2,981
- Some college more than 1 year, no degree: 4,861
- Associate degree: 2,447
- Bachelor's degree: 9,483
- Master's degree: 5,627
- Professional school degree: 1,061
- Doctorate degree: 1,200


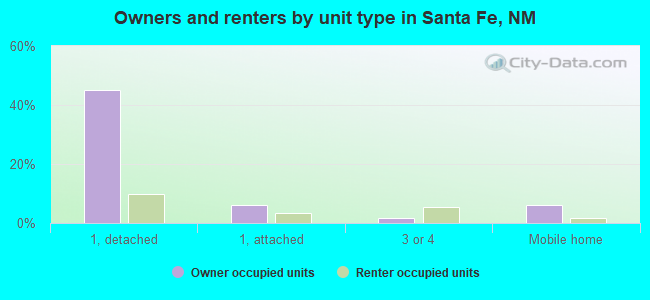
Housing units in structures:
- One, detached: 25,506
- One, attached: 4,523
- Two: 1,077
- 3 or 4: 3,625
- 5 to 9: 2,884
- 10 to 19: 4,028
- 20 to 49: 561
- 50 or more: 1,342
- Mobile homes: 3,914
Median worth of mobile homes: $52,600
Housing units lacking complete kitchen facilities in 2022: 1.8%
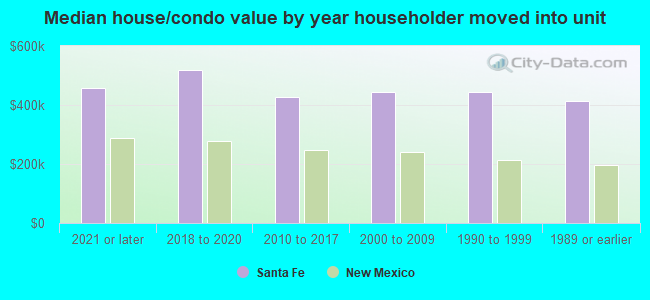
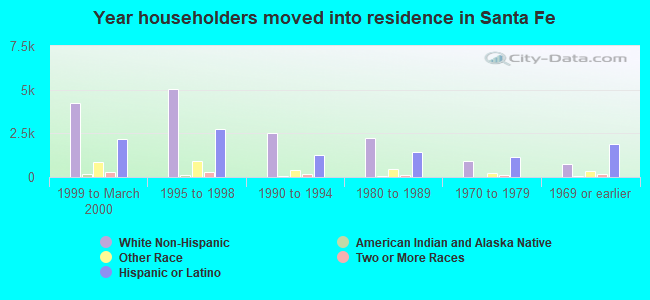
House/condo owner moved in on average 11 years ago
Renter moved in on average 2 years ago
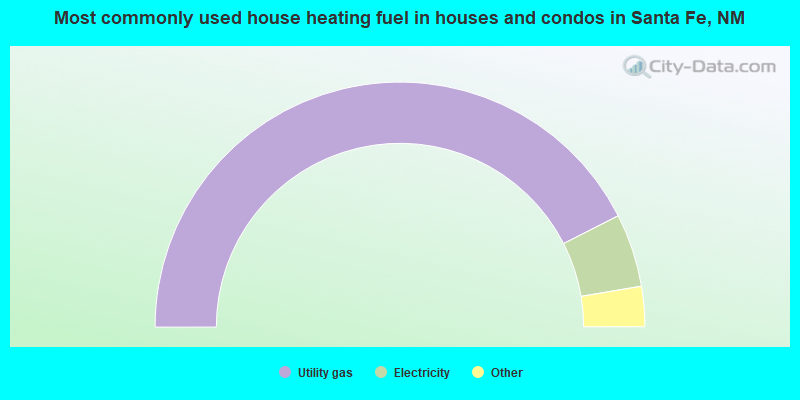
- 85.0%Utility gas
- 9.7%Electricity
- 1.8%Wood
- 1.7%Bottled, tank, or LP gas
- 1.3%Solar energy
- 0.4%Other fuel
- 0.1%No fuel used
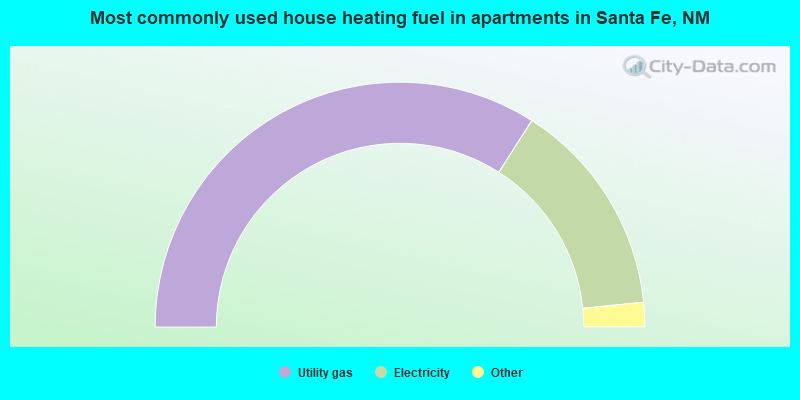
- 68.1%Utility gas
- 28.7%Electricity
- 1.4%Bottled, tank, or LP gas
- 0.7%Wood
- 0.5%Solar energy
- 0.3%No fuel used
- 0.2%Other fuel
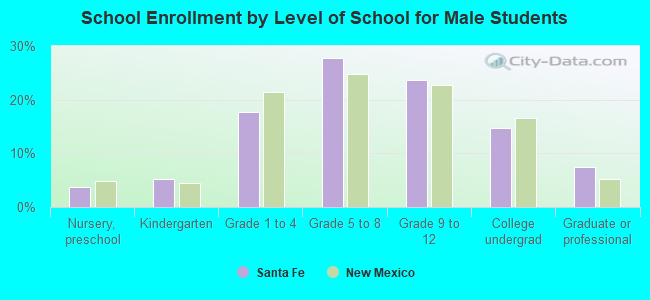
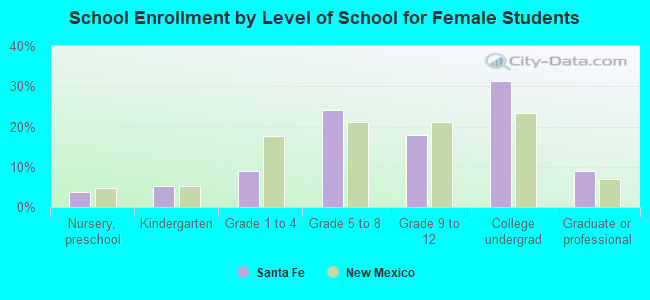
Private vs. public school enrollment:
| Here: | 12.9% |
| New Mexico: | 10.2% |
| Here: | 8.3% |
| New Mexico: | 10.0% |
| Here: | 8.9% |
| New Mexico: | 12.3% |