Work and Jobs in Santa Fe, New Mexico (NM) Detailed Stats
Occupations, Industries, Unemployment, Workers, Commute
Settings
X


Recent posts about work in Santa Fe, New Mexico on our local forum with over 2,400,000 registered users:
 | Work from home jobs over in Santa Fe? (5 replies) |
| Full Time Jobs in Santa Fe (3 replies) |
| Considering Retirement In Santa Fe (85 replies) |
| Santa Fe Job Market - Jobs (90 replies) |
| Renting vs Buying in Santa Fe (10 replies) |
| Relocating to Santa Fe, working in Los Alamos, concerned about water (38 replies) |
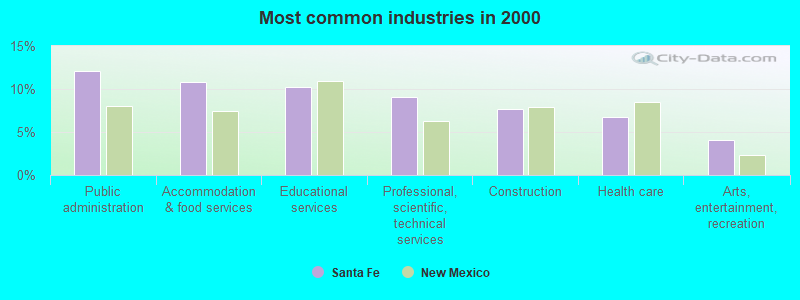
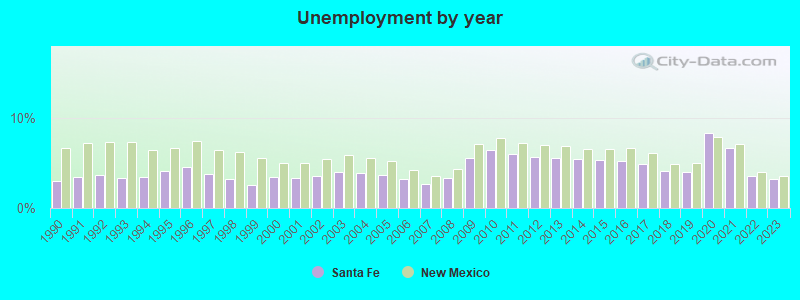
The unemployment rate in 2023 in Santa Fe, NM was 3.2%, which was 12.5% less than the unemployment rate of 3.6% across the entire state of New Mexico. Compared to the unemployment rate of 5.6% in 2013, this represents a decrease of 75.0%. The most common industries in Santa Fe are: Public administration (12.1% of civilian employees), Accommodation & food services (10.8% of civilian employees), Educational services (10.2% of civilian employees). 93.0% of workers work in Santa Fe County and 15.8% of all workers work at home. 53.4% of workers are employees of private companies, which is 6.9% less than the rate of 57.1% across the entire state of New Mexico.
Whole page based on the data from 2000 / 2022 when the population of Santa Fe, New Mexico was 62,203 / 89,001
Whole page based on the data from 2000 / 2022 when the population of Santa Fe, New Mexico was 62,203 / 89,001
Most common industries
Most common industries | |||
|---|---|---|---|
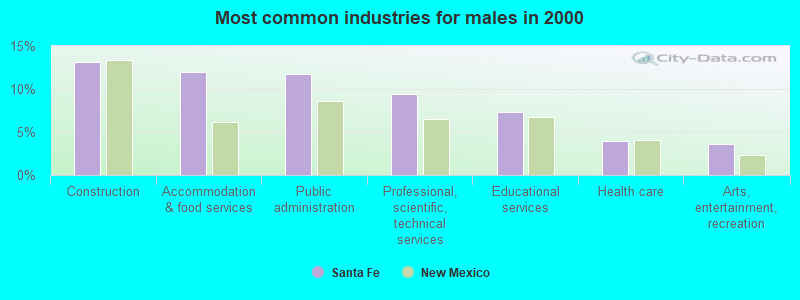
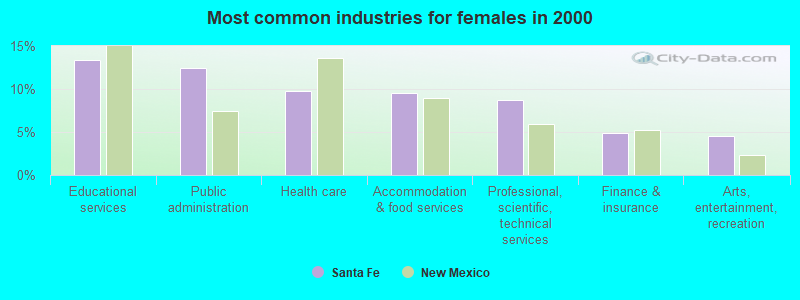
Industry | All | Males | Females |
| Public administration | 12.1% (3,912) | 11.7% (1,965) | 12.4% (1,947) |
| Accommodation and food services | 10.8% (3,514) | 12.0% (2,015) | 9.6% (1,499) |
| Educational services | 10.2% (3,317) | 7.3% (1,223) | 13.4% (2,094) |
| Professional, scientific, and technical services | 9.1% (2,955) | 9.4% (1,587) | 8.7% (1,368) |
| Construction | 7.7% (2,487) | 13.1% (2,209) | 1.8% (278) |
| Health care | 6.8% (2,199) | 3.9% (662) | 9.8% (1,537) |
| Arts, entertainment, and recreation | 4.1% (1,320) | 3.6% (609) | 4.5% (711) |
| Finance and insurance | 3.5% (1,137) | 2.2% (371) | 4.9% (766) |
| Real estate and rental and leasing | 2.9% (945) | 3.2% (533) | 2.6% (412) |
| Administrative and support and waste management services | 2.8% (910) | 3.4% (573) | 2.2% (337) |
| Food and beverage stores | 2.1% (696) | 2.5% (423) | 1.7% (273) |
| Used merchandise, gift, novelty, and souvenir, and other miscellaneous stores | 2.0% (656) | 1.5% (259) | 2.5% (397) |
| Social assistance | 1.9% (604) | 0.7% (112) | 3.1% (492) |
| Religious, grantmaking, civic, professional, and similar organizations | 1.7% (552) | 1.1% (186) | 2.3% (366) |
| Repair and maintenance | 1.7% (549) | 2.7% (461) | 0.6% (88) |
| Department and other general merchandise stores | 1.6% (519) | 0.8% (139) | 2.4% (380) |
| Publishing, and motion picture and sound recording industries | 1.6% (507) | 1.8% (301) | 1.3% (206) |
| Personal and laundry services | 1.3% (438) | 1.3% (221) | 1.4% (217) |
| Motor vehicle and parts dealers | 0.9% (308) | 1.5% (257) | 0.3% (51) |
| Furniture and home furnishings, and household appliance stores | 0.9% (302) | 0.8% (142) | 1.0% (160) |
| Clothing and accessories, including shoe, stores | 0.8% (265) | 0.4% (68) | 1.3% (197) |
| Private households | 0.8% (260) | 0.2% (40) | 1.4% (220) |
| Data processing, libraries, and other information services | 0.8% (247) | 0.8% (128) | 0.8% (119) |
| Building material and garden equipment and supplies dealers | 0.7% (243) | 0.9% (150) | 0.6% (93) |
| Miscellaneous manufacturing | 0.7% (235) | 0.9% (144) | 0.6% (91) |
| Other transportation, and support activities, and couriers | 0.6% (198) | 0.9% (146) | 0.3% (52) |
| Agriculture, forestry, fishing and hunting | 0.6% (196) | 0.7% (112) | 0.5% (84) |
| Broadcasting and telecommunications | 0.5% (178) | 0.6% (109) | 0.4% (69) |
| Utilities | 0.5% (174) | 0.8% (134) | 0.3% (40) |
| Sporting goods, camera, and hobby and toy stores | 0.5% (170) | 0.5% (81) | 0.6% (89) |
| Jewelry, luggage, and leather goods stores | 0.4% (134) | 0.1% (20) | 0.7% (114) |
| Metal and metal products | 0.4% (131) | 0.7% (110) | 0.1% (21) |
| Miscellaneous nondurable goods merchant wholesalers | 0.4% (131) | 0.5% (82) | 0.3% (49) |
| Furniture and related product manufacturing | 0.4% (119) | 0.6% (98) | 0.1% (21) |
| Other direct selling establishments | 0.4% (116) | 0.3% (51) | 0.4% (65) |
| Groceries and related products merchant wholesalers | 0.3% (113) | 0.5% (80) | 0.2% (33) |
| Radio, TV, and computer stores | 0.3% (107) | 0.5% (89) | 0.1% (18) |
| Nonmetallic mineral products | 0.3% (102) | 0.3% (58) | 0.3% (44) |
| Health and personal care, except drug, stores | 0.3% (88) | 0.2% (27) | 0.4% (61) |
| Printing and related support activities | 0.3% (85) | 0.4% (63) | 0.1% (22) |
| Food | 0.3% (83) | 0.4% (68) | 0.1% (15) |
| Book stores and news dealers | 0.2% (81) | 0.1% (25) | 0.4% (56) |
| Pharmacies and drug stores | 0.2% (77) | 0.2% (33) | 0.3% (44) |
| Electronic shopping and mail-order houses | 0.2% (76) | 0.2% (27) | 0.3% (49) |
| U. S. Postal service | 0.2% (71) | 0.3% (55) | 0.1% (16) |
| Computer and electronic products | 0.2% (62) | 0.2% (31) | 0.2% (31) |
| Truck transportation | 0.2% (61) | 0.3% (54) | 0.0% (7) |
| Office supplies and stationery stores | 0.2% (56) | 0.2% (34) | 0.1% (22) |
| Music stores | 0.2% (54) | 0.3% (47) | 0.0% (7) |
| Rail transportation | 0.2% (54) | 0.2% (36) | 0.1% (18) |
| Miscellaneous durable goods merchant wholesalers | 0.1% (48) | 0.1% (18) | 0.2% (30) |
| Apparel | 0.1% (45) | 0.0% (0) | 0.3% (45) |
| Professional and commercial equipment and supplies merchant wholesalers | 0.1% (42) | 0.1% (18) | 0.2% (24) |
| Alcoholic beverages merchant wholesalers | 0.1% (40) | 0.2% (35) | 0.0% (5) |
| Hardware, plumbing and heating equipment, and supplies merchant wholesalers | 0.1% (38) | 0.2% (34) | 0.0% (4) |
| Electrical and electronic goods merchant wholesalers | 0.1% (36) | 0.2% (27) | 0.1% (9) |
| Sewing, needlework, and piece goods stores | 0.1% (35) | 0.0% (0) | 0.2% (35) |
| Beverage and tobacco products | 0.1% (32) | 0.1% (23) | 0.1% (9) |
| Wood products | 0.1% (25) | 0.1% (25) | 0.0% (0) |
| Mining, quarrying, and oil and gas extraction | 0.1% (23) | 0.1% (23) | 0.0% (0) |
| Paper | 0.1% (18) | 0.1% (18) | 0.0% (0) |
Unemployment in Santa Fe
- Unemployment by race in 2022
- Unemployment rate for White non-Hispanic residents
- 6.7%Males
- 3.5%Females
- Unemployment rate for Black residents
- 3.9%Males
- Unemployment rate for American Indian and Alaska Native residents
- 3.9%Males
- 11.0%Females
- Unemployment rate for Asian residents
- 5.9%Males
- Unemployment rate for other race residents
- 6.3%Males
- 2.6%Females
- Unemployment rate for two or more race residents
- 4.0%Males
- 1.2%Females
- Unemployment rate for Hispanic or Latino residents
- 5.3%Males
- 1.3%Females
- Unemployment by race in 2000
- Unemployment rate for White non-Hispanic residents
- 2.3%Males
- 3.2%Females
- Unemployment rate for Black residents
- 6.2%Males
- 6.2%Females
- Unemployment rate for American Indian and Alaska Native residents
- 11.7%Males
- 7.7%Females
- Unemployment rate for other race residents
- 7.1%Males
- 5.3%Females
- Unemployment rate for two or more race residents
- 3.9%Males
- 7.8%Females
- Unemployment rate for Hispanic or Latino residents
- 7.0%Males
- 6.7%Females
Unemployment in 2023:
| Santa Fe: | 3.2% |
| New Mexico: | 3.6% |
Unemployment in 2022:
| Santa Fe: | 3.6% |
| New Mexico: | 4.0% |
Unemployment in 2021:
| Santa Fe: | 6.7% |
| New Mexico: | 7.1% |
Unemployment in 2020:
| Santa Fe: | 8.3% |
| New Mexico: | 7.9% |
Unemployment in 2019:
| Santa Fe: | 4.0% |
| New Mexico: | 5.0% |
Unemployment in 2018:
| Santa Fe: | 4.1% |
| New Mexico: | 4.9% |
Unemployment in 2017:
| Santa Fe: | 4.9% |
| New Mexico: | 6.1% |
Unemployment in 2016:
| Santa Fe: | 5.2% |
| New Mexico: | 6.7% |
Unemployment in 2015:
| Santa Fe: | 5.3% |
| New Mexico: | 6.6% |
Unemployment in 2014:
| Santa Fe: | 5.4% |
| New Mexico: | 6.6% |
Unemployment in 2013:
| Santa Fe: | 5.6% |
| New Mexico: | 6.9% |
Unemployment in 2012:
| Santa Fe: | 5.7% |
| New Mexico: | 7.0% |
Unemployment in 2011:
| Santa Fe: | 6.0% |
| New Mexico: | 7.2% |
Unemployment in 2010:
| Santa Fe: | 6.5% |
| New Mexico: | 7.8% |
Unemployment in 2009:
| Santa Fe: | 5.6% |
| New Mexico: | 7.1% |
Unemployment in 2008:
| Santa Fe: | 3.3% |
| New Mexico: | 4.3% |
Unemployment in 2007:
| Santa Fe: | 2.7% |
| New Mexico: | 3.6% |
Unemployment in 2006:
| Santa Fe: | 3.2% |
| New Mexico: | 4.2% |
Unemployment in 2005:
| Santa Fe: | 3.7% |
| New Mexico: | 5.2% |
Unemployment in 2004:
| Santa Fe: | 3.9% |
| New Mexico: | 5.6% |
Unemployment in 2003:
| Santa Fe: | 4.0% |
| New Mexico: | 5.9% |
Unemployment in 2002:
| Santa Fe: | 3.6% |
| New Mexico: | 5.5% |
Unemployment in 2001:
| Santa Fe: | 3.3% |
| New Mexico: | 5.0% |
Unemployment in 2000:
| Santa Fe: | 3.4% |
| New Mexico: | 5.0% |
Unemployment in 1999:
| Santa Fe: | 2.6% |
| New Mexico: | 5.6% |
Unemployment in 1998:
| Santa Fe: | 3.2% |
| New Mexico: | 6.2% |
Unemployment in 1997:
| Santa Fe: | 3.8% |
| New Mexico: | 6.4% |
Unemployment in 1996:
| Santa Fe: | 4.6% |
| New Mexico: | 7.5% |
Unemployment in 1995:
| Santa Fe: | 4.1% |
| New Mexico: | 6.7% |
Unemployment in 1994:
| Santa Fe: | 3.4% |
| New Mexico: | 6.5% |
Unemployment in 1993:
| Santa Fe: | 3.3% |
| New Mexico: | 7.3% |
Unemployment in 1992:
| Santa Fe: | 3.7% |
| New Mexico: | 7.3% |
Unemployment in 1991:
| Santa Fe: | 3.4% |
| New Mexico: | 7.2% |
Unemployment in 1990:
| Santa Fe: | 3.0% |
| New Mexico: | 6.7% |
Time leaving home to go to work
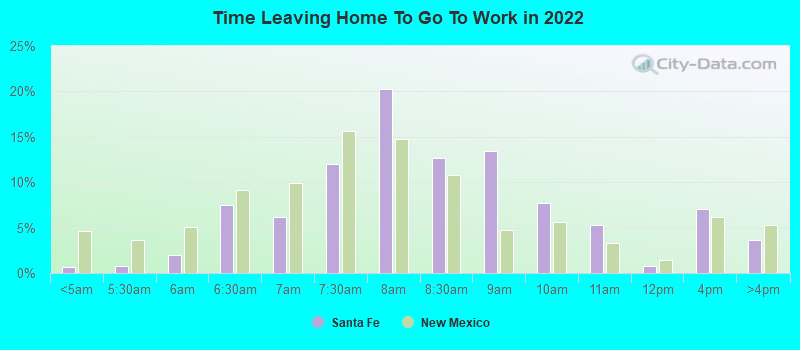
12:00 a.m. to 4:59 a.m.:
| Santa Fe: | 0.6% (242) |
| New Mexico: | 4.6% (38,210) |
5:00 a.m. to 5:29 a.m.:
| Santa Fe: | 0.7% (279) |
| New Mexico: | 3.6% (30,094) |
5:30 a.m. to 5:59 a.m.:
| Santa Fe: | 2.0% (748) |
| New Mexico: | 5.1% (41,811) |
6:00 a.m. to 6:29 a.m.:
| Santa Fe: | 7.5% (2,808) |
| New Mexico: | 9.1% (74,992) |
6:30 a.m. to 6:59 a.m.:
| Santa Fe: | 6.2% (2,329) |
| New Mexico: | 9.9% (81,934) |
7:00 a.m. to 7:29 a.m.:
| Santa Fe: | 12.0% (4,497) |
| New Mexico: | 15.6% (129,058) |
7:30 a.m. to 7:59 a.m.:
| Santa Fe: | 20.3% (7,618) |
| New Mexico: | 14.8% (121,786) |
8:00 a.m. to 8:29 a.m.:
| Santa Fe: | 12.7% (4,756) |
| New Mexico: | 10.8% (89,083) |
8:30 a.m. to 8:59 a.m.:
| Santa Fe: | 13.4% (5,038) |
| New Mexico: | 4.7% (39,064) |
9:00 a.m. to 9:59 a.m.:
| Santa Fe: | 7.8% (2,910) |
| New Mexico: | 5.6% (46,001) |
10:00 a.m. to 10:59 a.m.:
| Santa Fe: | 5.3% (1,976) |
| New Mexico: | 3.3% (26,972) |
11:00 a.m. to 11:59 a.m.:
| Santa Fe: | 0.8% (308) |
| New Mexico: | 1.4% (11,540) |
12:00 p.m. to 3:59 p.m.:
| Santa Fe: | 7.0% (2,629) |
| New Mexico: | 6.2% (50,927) |
4:00 p.m. to 11:59 p.m.:
| Santa Fe: | 3.6% (1,365) |
| New Mexico: | 5.3% (43,945) |

<5am:
| Santa Fe: | 1.2% (394) |
| New Mexico: | 2.8% (20,931) |
5:30am:
| Santa Fe: | 0.8% (264) |
| New Mexico: | 2.4% (18,406) |
6am:
| Santa Fe: | 1.4% (444) |
| New Mexico: | 3.7% (28,342) |
6:30am:
| Santa Fe: | 3.4% (1,082) |
| New Mexico: | 7.4% (56,047) |
7am:
| Santa Fe: | 6.5% (2,077) |
| New Mexico: | 10.5% (79,915) |
7:30am:
| Santa Fe: | 12.9% (4,111) |
| New Mexico: | 15.0% (113,891) |
8am:
| Santa Fe: | 22.5% (7,178) |
| New Mexico: | 18.4% (139,438) |
8:30am:
| Santa Fe: | 12.7% (4,045) |
| New Mexico: | 10.3% (78,335) |
9am:
| Santa Fe: | 7.2% (2,299) |
| New Mexico: | 4.5% (33,927) |
10am:
| Santa Fe: | 9.3% (2,976) |
| New Mexico: | 5.4% (40,980) |
11am:
| Santa Fe: | 3.5% (1,102) |
| New Mexico: | 2.3% (17,825) |
12pm:
| Santa Fe: | 1.2% (380) |
| New Mexico: | 1.2% (8,959) |
4pm:
| Santa Fe: | 5.2% (1,664) |
| New Mexico: | 5.7% (43,093) |
>4pm:
| Santa Fe: | 4.8% (1,546) |
| New Mexico: | 6.2% (47,115) |

12:00 a.m. to 4:59 a.m. - Males:
| Santa Fe: | 1.0% (183) |
| New Mexico: | 5.7% (25,356) |
5:00 a.m. to 5:29 a.m. - Males:
| Santa Fe: | 1.2% (216) |
| New Mexico: | 5.2% (23,201) |
5:30 a.m. to 5:59 a.m. - Males:
| Santa Fe: | 1.3% (245) |
| New Mexico: | 6.2% (27,894) |
6:00 a.m. to 6:29 a.m. - Males:
| Santa Fe: | 10.4% (1,928) |
| New Mexico: | 10.8% (48,334) |
6:30 a.m. to 6:59 a.m. - Males:
| Santa Fe: | 7.1% (1,318) |
| New Mexico: | 11.1% (49,662) |
7:00 a.m. to 7:29 a.m. - Males:
| Santa Fe: | 14.7% (2,707) |
| New Mexico: | 14.3% (64,129) |
7:30 a.m. to 7:59 a.m. - Males:
| Santa Fe: | 16.0% (2,958) |
| New Mexico: | 12.1% (54,167) |
8:00 a.m. to 8:29 a.m. - Males:
| Santa Fe: | 13.8% (2,546) |
| New Mexico: | 10.6% (47,522) |
8:30 a.m. to 8:59 a.m. - Males:
| Santa Fe: | 12.5% (2,313) |
| New Mexico: | 3.7% (16,701) |
9:00 a.m. to 9:59 a.m. - Males:
| Santa Fe: | 5.6% (1,032) |
| New Mexico: | 4.4% (19,843) |
10:00 a.m. to 10:59 a.m. - Males:
| Santa Fe: | 4.9% (897) |
| New Mexico: | 3.3% (14,683) |
11:00 a.m. to 11:59 a.m. - Males:
| Santa Fe: | 1.1% (197) |
| New Mexico: | 1.2% (5,506) |
12:00 p.m. to 3:59 p.m. - Males:
| Santa Fe: | 5.9% (1,085) |
| New Mexico: | 5.4% (24,361) |
4:00 p.m. to 11:59 p.m. - Males:
| Santa Fe: | 4.6% (841) |
| New Mexico: | 5.8% (26,034) |

12:00 a.m. to 4:59 a.m. - Females:
| Santa Fe: | 0.3% (59) |
| New Mexico: | 3.4% (12,854) |
5:00 a.m. to 5:29 a.m. - Females:
| Santa Fe: | 0.3% (63) |
| New Mexico: | 1.8% (6,893) |
5:30 a.m. to 5:59 a.m. - Females:
| Santa Fe: | 2.6% (503) |
| New Mexico: | 3.7% (13,917) |
6:00 a.m. to 6:29 a.m. - Females:
| Santa Fe: | 4.6% (880) |
| New Mexico: | 7.1% (26,658) |
6:30 a.m. to 6:59 a.m. - Females:
| Santa Fe: | 5.3% (1,011) |
| New Mexico: | 8.5% (32,272) |
7:00 a.m. to 7:29 a.m. - Females:
| Santa Fe: | 9.4% (1,790) |
| New Mexico: | 17.2% (64,929) |
7:30 a.m. to 7:59 a.m. - Females:
| Santa Fe: | 24.5% (4,660) |
| New Mexico: | 17.9% (67,619) |
8:00 a.m. to 8:29 a.m. - Females:
| Santa Fe: | 11.6% (2,210) |
| New Mexico: | 11.0% (41,561) |
8:30 a.m. to 8:59 a.m. - Females:
| Santa Fe: | 14.3% (2,725) |
| New Mexico: | 5.9% (22,363) |
9:00 a.m. to 9:59 a.m. - Females:
| Santa Fe: | 9.9% (1,878) |
| New Mexico: | 6.9% (26,158) |
10:00 a.m. to 10:59 a.m. - Females:
| Santa Fe: | 5.7% (1,079) |
| New Mexico: | 3.3% (12,289) |
11:00 a.m. to 11:59 a.m. - Females:
| Santa Fe: | 0.6% (111) |
| New Mexico: | 1.6% (6,034) |
12:00 p.m. to 3:59 p.m. - Females:
| Santa Fe: | 8.1% (1,544) |
| New Mexico: | 7.0% (26,566) |
4:00 p.m. to 11:59 p.m. - Females:
| Santa Fe: | 2.8% (524) |
| New Mexico: | 4.7% (17,911) |
Travel time to work
Percentage of workers working in this county: 93.0%
Number of people working at home: 7,013 (15.8% of all workers)
Daytime population change due to commuting: +20,508 (+33.0%)
Workers who live and work in this city: 27,211 (85.3%)
Number of people working at home: 7,013 (15.8% of all workers)
Daytime population change due to commuting: +20,508 (+33.0%)
Workers who live and work in this city: 27,211 (85.3%)

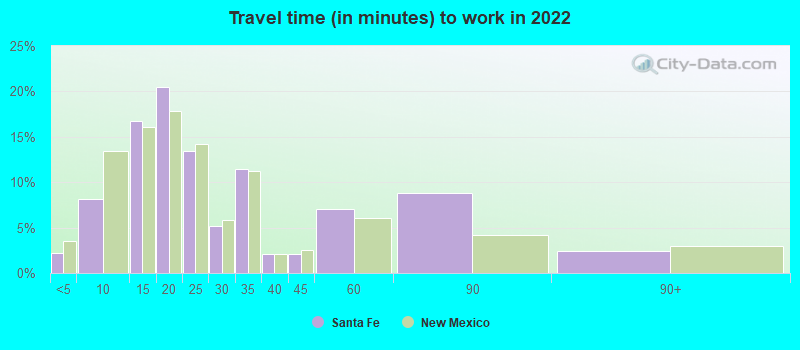

Less than 5 minutes:
| Santa Fe: | 2.2% (1,145) |
| New Mexico: | 3.5% (28,492) |
5 to 9 minutes:
| Santa Fe: | 8.2% (4,260) |
| New Mexico: | 13.5% (110,340) |
10 to 14 minutes:
| Santa Fe: | 16.7% (8,709) |
| New Mexico: | 16.1% (131,475) |
15 to 19 minutes:
| Santa Fe: | 20.5% (10,671) |
| New Mexico: | 17.9% (146,375) |
20 to 24 minutes:
| Santa Fe: | 13.4% (6,978) |
| New Mexico: | 14.2% (116,550) |
25 to 29 minutes:
| Santa Fe: | 5.2% (2,704) |
| New Mexico: | 5.8% (47,440) |
30 to 34 minutes:
| Santa Fe: | 11.5% (5,968) |
| New Mexico: | 11.3% (92,333) |
35 to 39 minutes:
| Santa Fe: | 2.0% (1,066) |
| New Mexico: | 2.0% (16,677) |
40 to 44 minutes:
| Santa Fe: | 2.1% (1,096) |
| New Mexico: | 2.5% (20,787) |
45 to 59 minutes:
| Santa Fe: | 7.1% (3,693) |
| New Mexico: | 6.1% (49,894) |
60 to 89 minutes:
| Santa Fe: | 8.8% (4,575) |
| New Mexico: | 4.2% (34,415) |
90 or more minutes:
| Santa Fe: | 2.4% (1,251) |
| New Mexico: | 3.0% (24,291) |


Less than 5 minutes:
| Santa Fe: | 4.3% (1,385) |
| New Mexico: | 4.6% (34,755) |
5 to 9 minutes:
| Santa Fe: | 18.0% (5,728) |
| New Mexico: | 13.9% (105,613) |
10 to 14 minutes:
| Santa Fe: | 24.6% (7,834) |
| New Mexico: | 16.9% (128,524) |
15 to 19 minutes:
| Santa Fe: | 18.6% (5,932) |
| New Mexico: | 16.8% (127,292) |
20 to 24 minutes:
| Santa Fe: | 10.2% (3,257) |
| New Mexico: | 13.9% (105,552) |
25 to 29 minutes:
| Santa Fe: | 1.9% (604) |
| New Mexico: | 4.6% (35,179) |
30 to 34 minutes:
| Santa Fe: | 5.5% (1,750) |
| New Mexico: | 10.9% (83,054) |
35 to 39 minutes:
| Santa Fe: | 0.8% (246) |
| New Mexico: | 1.6% (12,256) |
40 to 44 minutes:
| Santa Fe: | 1.7% (540) |
| New Mexico: | 2.2% (16,472) |
45 to 59 minutes:
| Santa Fe: | 3.9% (1,244) |
| New Mexico: | 5.1% (38,963) |
60 to 89 minutes:
| Santa Fe: | 2.4% (754) |
| New Mexico: | 3.2% (24,038) |
90 or more minutes:
| Santa Fe: | 0.9% (288) |
| New Mexico: | 2.0% (15,506) |

Less than 5 minutes - Males:
| Santa Fe: | 0.3% (82) |
| New Mexico: | 3.4% (15,163) |
5 to 9 minutes - Males:
| Santa Fe: | 7.8% (2,049) |
| New Mexico: | 12.0% (53,808) |
10 to 14 minutes - Males:
| Santa Fe: | 15.4% (4,023) |
| New Mexico: | 14.8% (66,475) |
15 to 19 minutes - Males:
| Santa Fe: | 20.7% (5,420) |
| New Mexico: | 18.5% (82,724) |
20 to 24 minutes - Males:
| Santa Fe: | 13.6% (3,553) |
| New Mexico: | 14.4% (64,598) |
25 to 29 minutes - Males:
| Santa Fe: | 5.9% (1,551) |
| New Mexico: | 5.5% (24,436) |
30 to 34 minutes - Males:
| Santa Fe: | 12.8% (3,354) |
| New Mexico: | 11.5% (51,646) |
35 to 39 minutes - Males:
| Santa Fe: | 3.1% (823) |
| New Mexico: | 2.2% (9,905) |
40 to 44 minutes - Males:
| Santa Fe: | 1.9% (494) |
| New Mexico: | 2.8% (12,382) |
45 to 59 minutes - Males:
| Santa Fe: | 8.8% (2,291) |
| New Mexico: | 6.6% (29,386) |
60 to 89 minutes - Males:
| Santa Fe: | 6.6% (1,723) |
| New Mexico: | 4.7% (21,062) |
90 or more minutes - Males:
| Santa Fe: | 3.1% (798) |
| New Mexico: | 3.7% (16,633) |

Less than 5 minutes - Females:
| Santa Fe: | 4.1% (1,063) |
| New Mexico: | 3.6% (13,329) |
5 to 9 minutes - Females:
| Santa Fe: | 8.5% (2,211) |
| New Mexico: | 15.2% (56,532) |
10 to 14 minutes - Females:
| Santa Fe: | 18.1% (4,686) |
| New Mexico: | 17.5% (65,000) |
15 to 19 minutes - Females:
| Santa Fe: | 20.2% (5,251) |
| New Mexico: | 17.2% (63,651) |
20 to 24 minutes - Females:
| Santa Fe: | 13.2% (3,425) |
| New Mexico: | 14.0% (51,952) |
25 to 29 minutes - Females:
| Santa Fe: | 4.4% (1,153) |
| New Mexico: | 6.2% (23,004) |
30 to 34 minutes - Females:
| Santa Fe: | 10.1% (2,614) |
| New Mexico: | 11.0% (40,687) |
35 to 39 minutes - Females:
| Santa Fe: | 0.9% (243) |
| New Mexico: | 1.8% (6,772) |
40 to 44 minutes - Females:
| Santa Fe: | 2.3% (602) |
| New Mexico: | 2.3% (8,405) |
45 to 59 minutes - Females:
| Santa Fe: | 5.4% (1,402) |
| New Mexico: | 5.5% (20,508) |
60 to 89 minutes - Females:
| Santa Fe: | 11.0% (2,852) |
| New Mexico: | 3.6% (13,353) |
90 or more minutes - Females:
| Santa Fe: | 1.7% (453) |
| New Mexico: | 2.1% (7,658) |
Means of transportation to work
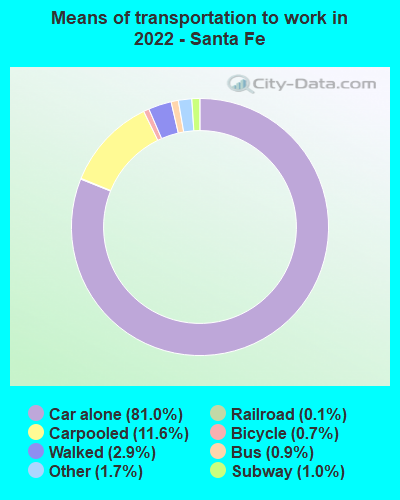
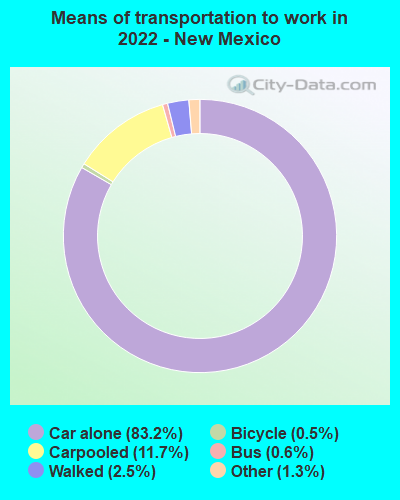
Drove car alone:
| Santa Fe: | 81.0% (42,197) |
| New Mexico: | 83.2% (306,388) |
Carpooled:
| Santa Fe: | 11.6% (6,046) |
| New Mexico: | 11.7% (48,679) |
Bus:
| Santa Fe: | 0.9% (482) |
| New Mexico: | 0.6% (2,496) |
Long-distance train or commuter rail:
| Santa Fe: | 1.0% (524) |
| New Mexico: | 0.1% (388) |
Light rail, streetcar or trolley:
| Santa Fe: | 0.1% (67) |
| New Mexico: | 0.0% (178) |
Bicycle:
| Santa Fe: | 0.7% (389) |
| New Mexico: | 0.5% (975) |
Walked:
| Santa Fe: | 2.9% (1,525) |
| New Mexico: | 2.5% (7,580) |
Other means:
| Santa Fe: | 1.7% (886) |
| New Mexico: | 1.3% (4,104) |

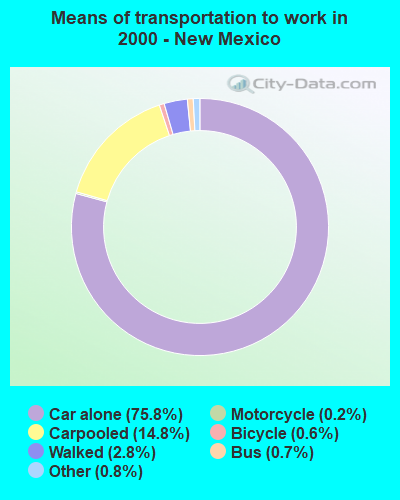
Drove car alone:
| Santa Fe: | 72.4% (23,099) |
| New Mexico: | 75.8% (575,187) |
Carpooled:
| Santa Fe: | 13.3% (4,227) |
| New Mexico: | 14.8% (112,489) |
Bus or trolley bus:
| Santa Fe: | 1.1% (338) |
| New Mexico: | 0.7% (5,465) |
Streetcar or trolley car:
| Santa Fe: | 0.2% (68) |
| New Mexico: | 0.0% (138) |
Subway or elevated:
| Santa Fe: | 0.0% (9) |
| New Mexico: | 0.0% (163) |
Railroad:
| Santa Fe: | 0.0% (6) |
| New Mexico: | 0.0% (58) |
Taxicab:
| Santa Fe: | 0.2% (52) |
| New Mexico: | 0.0% (207) |
Motorcycle:
| Santa Fe: | 0.1% (25) |
| New Mexico: | 0.2% (1,530) |
Bicycle:
| Santa Fe: | 0.8% (254) |
| New Mexico: | 0.6% (4,287) |
Walked:
| Santa Fe: | 4.1% (1,312) |
| New Mexico: | 2.8% (21,435) |
Other means:
| Santa Fe: | 0.5% (172) |
| New Mexico: | 0.8% (6,202) |

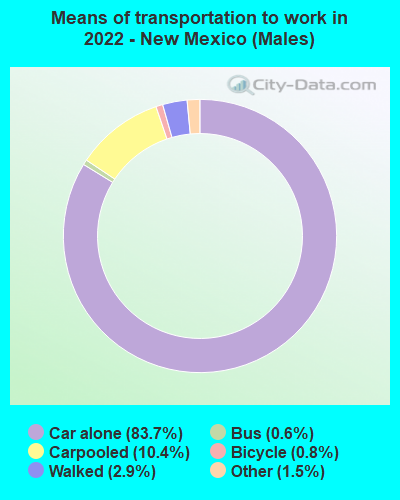
Drove car alone - Males:
| Santa Fe: | 80.1% (20,951) |
| New Mexico: | 83.7% (306,388) |
Carpooled - Males:
| Santa Fe: | 11.5% (2,999) |
| New Mexico: | 10.4% (48,679) |
Bus - Males:
| Santa Fe: | 1.6% (411) |
| New Mexico: | 0.6% (2,496) |
Long-distance train or commuter rail - Males:
| Santa Fe: | 0.8% (202) |
| New Mexico: | 0.1% (388) |
Bicycle - Males:
| Santa Fe: | 0.9% (225) |
| New Mexico: | 0.8% (975) |
Walked - Males:
| Santa Fe: | 2.8% (741) |
| New Mexico: | 2.9% (7,580) |
Other means - Males:
| Santa Fe: | 2.4% (632) |
| New Mexico: | 1.5% (4,104) |

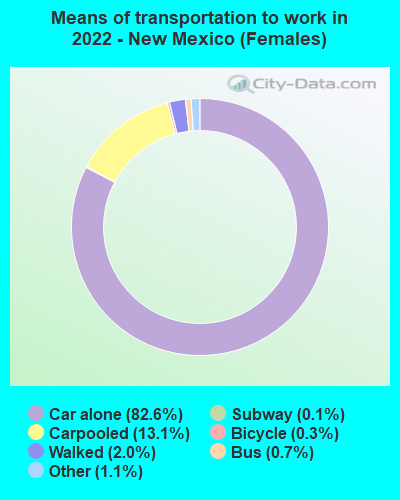
Drove car alone - Females:
| Santa Fe: | 81.9% (21,246) |
| New Mexico: | 82.6% (306,388) |
Carpooled - Females:
| Santa Fe: | 11.7% (3,047) |
| New Mexico: | 13.1% (48,679) |
Bus - Females:
| Santa Fe: | 0.3% (71) |
| New Mexico: | 0.7% (2,496) |
Long-distance train or commuter rail - Females:
| Santa Fe: | 1.2% (322) |
| New Mexico: | 0.1% (388) |
Light rail, streetcar or trolley - Females:
| Santa Fe: | 0.3% (67) |
| New Mexico: | 0.0% (178) |
Bicycle - Females:
| Santa Fe: | 0.6% (164) |
| New Mexico: | 0.3% (975) |
Walked - Females:
| Santa Fe: | 3.0% (784) |
| New Mexico: | 2.0% (7,580) |
Other means - Females:
| Santa Fe: | 1.0% (254) |
| New Mexico: | 1.1% (4,104) |
Private vehicle occupancy

Drove alone:
| Santa Fe: | 88.0% (30,155) |
| New Mexico: | 87.9% (687,338) |
In 2 person carpool:
| Santa Fe: | 8.0% (2,743) |
| New Mexico: | 8.7% (68,297) |
In 3 person carpool:
| Santa Fe: | 3.4% (1,155) |
| New Mexico: | 2.3% (17,742) |
In 4 person carpool:
| Santa Fe: | 0.5% (175) |
| New Mexico: | 0.7% (5,179) |
In 5-6 person carpool:
| Santa Fe: | 0.1% (42) |
| New Mexico: | 0.4% (2,922) |
In 7+ person carpool:
| Santa Fe: | 0.0% (14) |
| New Mexico: | 0.0% (298) |

Drove alone:
| Santa Fe: | 84.5% (23,099) |
| New Mexico: | 83.6% (575,187) |
In 2 person carpool:
| Santa Fe: | 11.6% (3,173) |
| New Mexico: | 12.3% (84,314) |
In 3 person carpool:
| Santa Fe: | 2.7% (748) |
| New Mexico: | 2.5% (17,109) |
In 4 person carpool:
| Santa Fe: | 0.6% (177) |
| New Mexico: | 1.0% (6,993) |
In 5-6 person carpool:
| Santa Fe: | 0.2% (43) |
| New Mexico: | 0.4% (2,603) |
In 7+ person carpool:
| Santa Fe: | 0.3% (86) |
| New Mexico: | 0.2% (1,470) |
Class of workers
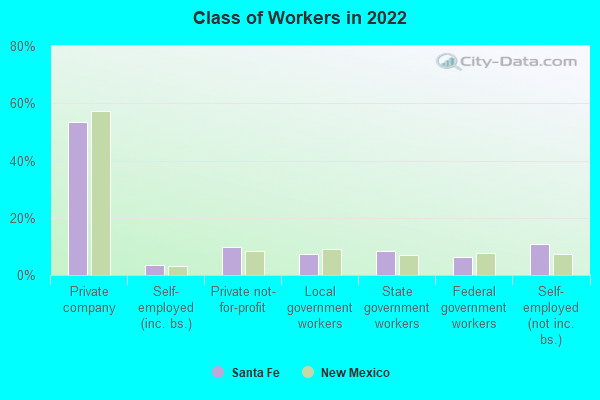
Employee of private company:
| Santa Fe: | 53.4% (23,890) |
| New Mexico: | 57.1% (535,323) |
Self-employed in own incorporated business:
| Santa Fe: | 3.6% (1,620) |
| New Mexico: | 3.2% (30,246) |
Private not-for-profit wage and salary workers:
| Santa Fe: | 9.9% (4,406) |
| New Mexico: | 8.2% (77,259) |
Local government workers:
| Santa Fe: | 7.3% (3,279) |
| New Mexico: | 9.1% (85,345) |
State government workers:
| Santa Fe: | 8.4% (3,778) |
| New Mexico: | 7.1% (66,149) |
Federal government workers:
| Santa Fe: | 6.1% (2,737) |
| New Mexico: | 7.6% (71,182) |
Self-employed workers in own not incorporated business:
| Santa Fe: | 10.8% (4,838) |
| New Mexico: | 7.3% (68,193) |
Unpaid family workers:
| Santa Fe: | 0.4% (171) |
| New Mexico: | 0.4% (3,330) |

Employee of private company:
| Santa Fe: | 51.6% (16,763) |
| New Mexico: | 58.3% (444,948) |
Self-employed in own incorporated business:
| Santa Fe: | 4.3% (1,406) |
| New Mexico: | 3.4% (25,839) |
Private not-for-profit wage and salary workers:
| Santa Fe: | 9.1% (2,956) |
| New Mexico: | 6.8% (51,679) |
Local government workers:
| Santa Fe: | 6.1% (1,964) |
| New Mexico: | 7.6% (58,106) |
State government workers:
| Santa Fe: | 11.6% (3,769) |
| New Mexico: | 8.5% (64,737) |
Federal government workers:
| Santa Fe: | 4.2% (1,368) |
| New Mexico: | 6.6% (50,346) |
Self-employed workers in own not incorporated business:
| Santa Fe: | 12.6% (4,084) |
| New Mexico: | 8.4% (64,108) |
Unpaid family workers:
| Santa Fe: | 0.5% (151) |
| New Mexico: | 0.4% (3,353) |

Employee of private company - Males:
| Santa Fe: | 57.7% (12,535) |
| New Mexico: | 60.1% (293,772) |
Self-employed in own incorporated business - Males:
| Santa Fe: | 2.4% (527) |
| New Mexico: | 4.0% (19,526) |
Private not-for-profit wage and salary workers - Males:
| Santa Fe: | 5.4% (1,172) |
| New Mexico: | 5.4% (26,442) |
Local government workers - Males:
| Santa Fe: | 7.5% (1,633) |
| New Mexico: | 7.5% (36,775) |
State government workers - Males:
| Santa Fe: | 5.9% (1,287) |
| New Mexico: | 5.6% (27,614) |
Federal government workers - Males:
| Santa Fe: | 8.3% (1,806) |
| New Mexico: | 9.1% (44,462) |
Self-employed workers in own not incorporated business - Males:
| Santa Fe: | 12.5% (2,719) |
| New Mexico: | 7.9% (38,542) |
Unpaid family workers - Males:
| Santa Fe: | 0.2% (51) |
| New Mexico: | 0.4% (1,878) |

Employee of private company - Females:
| Santa Fe: | 49.4% (11,355) |
| New Mexico: | 53.9% (241,551) |
Self-employed in own incorporated business - Females:
| Santa Fe: | 4.8% (1,093) |
| New Mexico: | 2.4% (10,720) |
Private not-for-profit wage and salary workers - Females:
| Santa Fe: | 14.1% (3,234) |
| New Mexico: | 11.3% (50,817) |
Local government workers - Females:
| Santa Fe: | 7.2% (1,646) |
| New Mexico: | 10.8% (48,570) |
State government workers - Females:
| Santa Fe: | 10.8% (2,491) |
| New Mexico: | 8.6% (38,535) |
Federal government workers - Females:
| Santa Fe: | 4.0% (931) |
| New Mexico: | 6.0% (26,720) |
Self-employed workers in own not incorporated business - Females:
| Santa Fe: | 9.2% (2,119) |
| New Mexico: | 6.6% (29,651) |
Unpaid family workers - Females:
| Santa Fe: | 0.5% (120) |
| New Mexico: | 0.3% (1,452) |