San Diego, CA (California) Houses and Residents
| San Diego: | $905,300 |
| California: | $715,900 |
Mean price in 2022:
Detached houses: $1,227,596
Here: $1,227,596 State: $988,808 Townhouses or other attached units: $822,615
Here: $822,615 State: $838,546 In 2-unit structures: $967,724
Here: $967,724 State: $1,138,100 In 3-to-4-unit structures: $1,250,281
Here: $1,250,281 State: $824,253 In 5-or-more-unit structures: $704,051
Here: $704,051 State: $730,996 Mobile homes: $134,985
Here: $134,985 State: $184,506
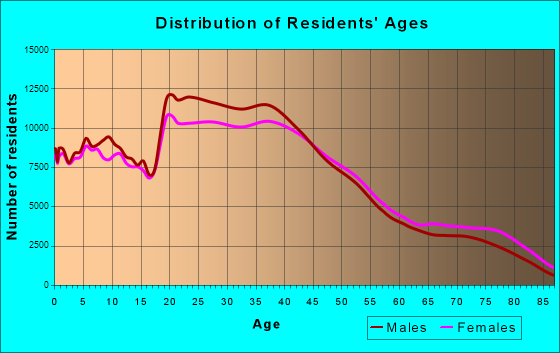
Total population: 1,381,069 (Urban population: 1,218,536, Rural population: 4,805 (53 farm, 4,752 nonfarm))
Houses: 565,401 (528,530 occupied: 248,119 owner occupied, 280,411 renter occupied)
| % of renters here: | 53% |
| State: | 44% |
Housing density: 1,743 houses/condos per square mile
Median price asked for vacant for-sale houses and condos in 2022: $1,186,739.
Median contract rent in 2022: $1,971 (lower quartile is $1,521, upper quartile is over $2,000)
Median rent asked for vacant for-rent units in 2022: $2,436
Median gross rent in San Diego, CA in 2022: over $2,000
Housing units in San Diego with a mortgage: 171,794 (14,249 second mortgage, 428 home equity loan, 12,430 both second mortgage and home equity loan)
Houses without a mortgage: 2,148
Median household income for houses/condos with a mortgage: $150,164
Median household income for apartments without a mortgage: $94,792
Median monthly housing costs: $2,191
Compare current foreclosures in San Diego, CA:
| Photo | Address | Area | Beds / Baths | Price | Details |
|---|---|---|---|---|---|

|
#1
Akins Ave Unit 404
San Diego, CA 92114
|
740 sq. feet
|
1 baths 2 beds |
show details | |

|
#2
Dodson St
San Diego, CA 92102
|
748 sq. feet
|
1 baths 2 beds |
show details | |

|
#3
Surfcliff Pt
San Diego, CA 92154
|
2,685 sq. feet
|
3 baths 5 beds |
show details | |

|
#4
Run Of The Knls
San Diego, CA 92127
|
2,596 sq. feet
|
3 baths 2 beds |
show details | |

|
#5
Chauncey Dr
San Diego, CA 92123
|
1,497 sq. feet
|
2 baths 4 beds |
show details | |

|
#6
Badger Lake Ave
San Diego, CA 92119
|
1,098 sq. feet
|
2 baths 3 beds |
show details | |

|
#7
Kika Ct
San Diego, CA 92129
|
1,436 sq. feet
|
3 baths 3 beds |
show details | |

|
#8
Alvin St
San Diego, CA 92114
|
1,376 sq. feet
|
2 baths 3 beds |
show details | |

|
#9
Dalby Pl
San Diego, CA 92126
|
1,134 sq. feet
|
2 baths 3 beds |
show details | |

|
#10
Vinley Pl
San Diego, CA 92120
|
1,692 sq. feet
|
2 baths 4 beds |
show details |
| Photo | Address | Area | Beds / Baths | Price | Details |
|---|---|---|---|---|---|

|
#11
Florence St
San Diego, CA 92113
|
1,261 sq. feet
|
2 baths 2 beds |
show details | |

|
#12
Nobel Dr Unit 104
San Diego, CA 92122
|
1,203 sq. feet
|
2 baths 2 beds |
show details | |

|
#13
Walker Dr
San Diego, CA 92123
|
1,524 sq. feet
|
3 baths 4 beds |
show details | |

|
#14
Olivewood Ter
San Diego, CA 92113
|
796 sq. feet
|
1 baths 2 beds |
show details | |

|
#15
Dandridge Ln # 98
San Diego, CA 92115
|
1,069 sq. feet
|
2 baths 2 beds |
show details | |

|
#16
Aderman Ave Apt 139
San Diego, CA 92126
|
920 sq. feet
|
2 baths 2 beds |
show details | |

|
#17
Boston Ave
San Diego, CA 92113
|
1,096 sq. feet
|
1 baths 3 beds |
show details | |

|
#18
Surfside Dr
San Diego, CA 92154
|
2,872 sq. feet
|
3 baths 5 beds |
show details | |

|
#19
E Mountain View Dr
San Diego, CA 92116
|
1,080 sq. feet
|
1 baths 4 beds |
show details | |

|
#20
55th St Unit 16
San Diego, CA 92115
|
761 sq. feet
|
2 baths 2 beds |
show details |
| Photo | Address | Area | Beds / Baths | Price | Details |
|---|---|---|---|---|---|

|
#21
Dafter Pl
San Diego, CA 92102
|
1,204 sq. feet
|
2 baths 3 beds |
show details | |

|
#22
Wilson Ave
San Diego, CA 92104
|
1,484 sq. feet
|
2 baths 3 beds |
show details | |

|
#23
Catoctin Dr
San Diego, CA 92115
|
1,773 sq. feet
|
3 baths 3 beds |
show details | |

|
#24
S 46th St
San Diego, CA 92113
|
1,176 sq. feet
|
2 baths 3 beds |
show details | |

|
#25
Baja Dr
San Diego, CA 92115
|
1,058 sq. feet
|
2 baths 3 beds |
show details | |

|
#26
Lightwave Ave
San Diego, CA 92123
|
1,277 sq. feet
|
2 baths 2 beds |
show details | |

|
#27
Balboa Arms Dr Unit 314
San Diego, CA 92117
|
825 sq. feet
|
2 baths 2 beds |
show details | |

|
#28
Westover Pl
San Diego, CA 92102
|
1,062 sq. feet
|
1 baths 3 beds |
show details | |

|
#29
Margerum Ave Unit 163
San Diego, CA 92120
|
643 sq. feet
|
1 baths 1 beds |
show details | |

|
#30
Auburndale St
San Diego, CA 92111
|
1,056 sq. feet
|
2 baths 3 beds |
show details |
| Photo | Address | Area | Beds / Baths | Price | Details |
|---|---|---|---|---|---|

|
#31
Balboa Arms Dr Unit 178
San Diego, CA 92117
|
582 sq. feet
|
1 baths 1 beds |
show details | |

|
#32
Vietta Ter
San Diego, CA 92126
|
2,110 sq. feet
|
3 baths 4 beds |
show details | |

|
#33
Balboa Ter Unit A
San Diego, CA 92117
|
984 sq. feet
|
2 baths 2 beds |
show details | |

|
#34
Camino Kiosco
San Diego, CA 92122
|
1,472 sq. feet
|
2 baths 3 beds |
show details | |

|
#35
Caroline Dr
San Diego, CA 92115
|
1,824 sq. feet
|
2 baths 3 beds |
show details | |

|
#36
Capricorn Way
San Diego, CA 92126
|
1,600 sq. feet
|
2 baths 4 beds |
show details | |

|
#37
Hawk St
San Diego, CA 92103
|
2,264 sq. feet
|
2 baths 3 beds |
show details | |

|
#38
Afton Rd
San Diego, CA 92123
|
1,161 sq. feet
|
2 baths 3 beds |
show details | |

|
#39
Caminito Ciera Unit 118
San Diego, CA 92129
|
572 sq. feet
|
1 baths 1 beds |
show details | |

|
#40
Trebol St
San Diego, CA 92126
|
2,107 sq. feet
|
3 baths 4 beds |
show details |
| Photo | Address | Area | Beds / Baths | Price | Details |
|---|---|---|---|---|---|

|
#41
W Canyon Ave
San Diego, CA 92123
|
1,679 sq. feet
|
3 baths 3 beds |
show details | |

|
#42
Marlborough Ave Unit 5
San Diego, CA 92116
|
702 sq. feet
|
2 baths 2 beds |
show details | |

|
#43
Park Blvd Unit 11
San Diego, CA 92103
|
548 sq. feet
|
1 baths 1 beds |
show details | |

|
#44
Drucella St
San Diego, CA 92154
|
1,260 sq. feet
|
2 baths 3 beds |
show details | |

|
#45
Tivoli Park Row Unit 2
San Diego, CA 92128
|
1,341 sq. feet
|
2 baths 2 beds |
show details | |

|
#46
Lancaster Dr
San Diego, CA 92120
|
1,614 sq. feet
|
2 baths 3 beds |
show details | |

|
#47
Balboa Arms Dr Unit 129
San Diego, CA 92117
|
782 sq. feet
|
2 baths 2 beds |
show details | |

|
#48
Shamrock St
San Diego, CA 92105
|
1,080 sq. feet
|
1 baths 3 beds |
show details | |

|
#49
Biltmore St
San Diego, CA 92117
|
1,903 sq. feet
|
2 baths 3 beds |
show details | |

|
Check over 1 million property listings on Foreclosure.com!
|
browse all offers | |||


Median year apartment built: 1981
Household type by relationship:
Households: 1,381,182- Male householders: 278,334 (73,747 living alone), Female householders: 250,196 (75,596 living alone)
226,514 spouses (222,409 opposite-sex spouses), 44,962 unmarried partners, (41,605 opposite-sex unmarried partners), 340,823 children (327,151 natural, 5,053 adopted, 8,619 stepchildren), 21,373 grandchildren, 20,866 brothers or sisters, 26,950 parents, 492 foster children, 29,597 other relatives, 82,312 non-relatives
- In group quarters: 58,763
Size of family households: 131,389 2-persons, 74,739 3-persons, 61,652 4-persons, 25,249 5-persons, 9,501 6-persons, 7,163 7-or-more-persons.
Size of nonfamily households: 149,343 1-person, 55,917 2-persons, 7,921 3-persons, 4,041 4-persons, 1,483 5-persons, 132 6-persons.
162,834 married couples with children.
61,604 single-parent households (15,449 men, 46,155 women).
60.5% of residents of San Diego speak English at home.
21.1% of residents speak Spanish at home (68% speak English very well, 16% speak English well, 11% speak English not well, 5% don't speak English at all).
5.5% of residents speak other Indo-European language at home (75% speak English very well, 19% speak English well, 5% speak English not well, 1% don't speak English at all).
11.5% of residents speak Asian or Pacific Island language at home (55% speak English very well, 28% speak English well, 14% speak English not well, 3% don't speak English at all).
1.3% of residents speak other language at home (71% speak English very well, 19% speak English well, 8% speak English not well, 2% don't speak English at all).
Foreign born population: 339,576 (24.6%)
(59.8% of them are naturalized citizens)
| Here: | 5.8 |
| State: | 6.0 |
| Here: | 3.7 |
| State: | 3.9 |

- Bedrooms in owner-occupied houses and condos in San Diego, California
- 2,476no bedroom
- 11,7681 bedroom
- 50,6142 bedrooms
- 92,8283 bedrooms
- 70,4904 bedrooms
- 19,9435+ bedrooms

- Bedrooms in renter-occupied apartments in San Diego, California
- 28,149no bedroom
- 79,3271 bedroom
- 109,6412 bedrooms
- 45,2353 bedrooms
- 14,4064 bedrooms
- 3,6535+ bedrooms

- Cars and other vehicles available in San Diego in owner-occupied houses/condos
- 6,393no vehicle
- 64,7571 vehicle
- 106,6802 vehicles
- 45,2833 vehicles
- 16,9884 vehicles
- 8,0185+ vehicles

- Cars and other vehicles available in San Diego in renter-occupied apartments
- 25,327no vehicle
- 123,5761 vehicle
- 94,9672 vehicles
- 24,3873 vehicles
- 7,1594 vehicles
- 4,9955+ vehicles

- Rooms in owner-occupied houses in San Diego, California
- 1,6971 room
- 4,0082 rooms
- 17,4413 rooms
- 34,7914 rooms
- 48,3965 rooms
- 51,6946 rooms
- 34,3727 rooms
- 28,4108 rooms
- 27,3109+ rooms

- Rooms in renter-occupied apartments in San Diego, California
- 23,9191 room
- 34,2872 rooms
- 68,2153 rooms
- 74,5574 rooms
- 38,9555 rooms
- 21,8236 rooms
- 8,9087 rooms
- 5,2868 rooms
- 4,4619+ rooms


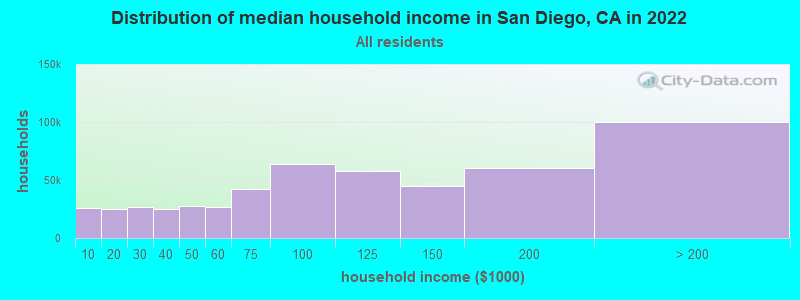
San Diego, CA household income distribution

- 26,049Less than $10,000
- 25,251$10,000 to $19,999
- 26,780$20,000 to $29,999
- 25,294$30,000 to $39,999
- 27,809$40,000 to $49,999
- 27,134$50,000 to $59,999
- 42,046$60,000 to $74,999
- 63,866$75,000 to $99,999
- 58,148$100,000 to $124,999
- 45,361$125,000 to $149,999
- 60,541$150,000 to $199,999
- 100,251$200,000 or more
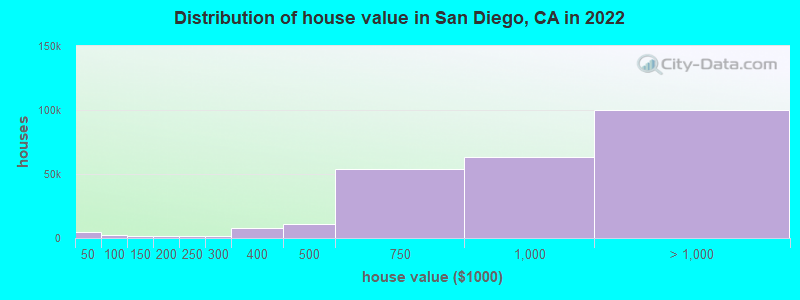
Home value of owner - occupied houses in 2022 in San Diego, CA
-
- 2,989Less than $10,000
- 218$10,000 to $14,999
- 514$15,000 to $19,999
- 126$20,000 to $24,999
- 178$25,000 to $29,999
- 82$30,000 to $34,999
- 356$40,000 to $49,999
- 315$50,000 to $59,999
- 284$60,000 to $69,999
- 530$70,000 to $79,999
- 436$80,000 to $89,999
- 277$90,000 to $99,999
- 1,220$100,000 to $124,999
- 378$125,000 to $149,999
- 1,584$150,000 to $174,999
- 305$175,000 to $199,999
- 1,589$200,000 to $249,999
- 1,234$250,000 to $299,999
- 7,486$300,000 to $399,999
- 11,040$400,000 to $499,999
- 53,770$500,000 to $749,999
- 63,038$750,000 to $999,999
- 53,865$1,000,000 to $1,499,999
- 19,830$1,500,000 to $1,999,999
- 26,475$2,000,000 or more
Rent paid by renters in 2022 in San Diego, CA
-
- 349Less than $100
- 347$100 to $149
- 263$150 to $199
- 919$200 to $249
- 2,052$250 to $299
- 2,495$300 to $349
- 311$350 to $399
- 1,560$400 to $449
- 527$450 to $499
- 1,055$500 to $549
- 303$550 to $599
- 469$600 to $649
- 650$650 to $699
- 1,060$700 to $749
- 1,440$750 to $799
- 3,650$800 to $899
- 4,770$900 to $999
- 19,727$1,000 to $1,249
- 23,306$1,250 to $1,499
- 75,958$1,500 to $1,999
- 58,109$2,000 to $2,499
- 32,022$2,500 to $2,999
- 21,489$3,000 to $3,499
- 20,891$3,500 or more
- 6,689No cash rent


Percentage of workers working in this county: 98.8%
Number of people working at home: 152,868 (20.8% of all workers)

Travel time to work (commute)
- Less than 5 minutes: 10,696
- 5 to 9 minutes: 37,276
- 10 to 14 minutes: 85,794
- 15 to 19 minutes: 114,153
- 20 to 24 minutes: 114,006
- 25 to 29 minutes: 47,541
- 30 to 34 minutes: 93,395
- 35 to 39 minutes: 16,927
- 40 to 44 minutes: 16,962
- 45 to 59 minutes: 23,612
- 60 to 89 minutes: 13,747
- 90 or more minutes: 8,309

Means of transportation to work:
- Drove a car alone: 607,529 (66.9%)
- Carpooled: 77,610 (8.6%)
- Bus: 18,951 (2.1%)
- Subway or elevated rail: 750 (0.1%)
- Long-distance train or commuter rail: 717 (0.1%)
- Light rail, streetcar or trolley: 4,433 (0.5%)
- Ferryboat: 82 (0.0%)
- Taxi: 12,698 (1.4%)
- Bicycle: 4,520 (0.5%)
- Walked: 27,559 (3.0%)
- Worked at home: 152,868 (16.8%)

- Unemployment by race in 2022
- Unemployment rate for White non-Hispanic residents
- 4.0%Males
- 4.7%Females
- Unemployment rate for Black residents
- 4.9%Males
- 5.7%Females
- Unemployment rate for American Indian and Alaska Native residents
- 1.5%Males
- 2.6%Females
- Unemployment rate for Asian residents
- 4.3%Males
- 4.2%Females
- Unemployment rate for other race residents
- 5.0%Males
- 4.7%Females
- Unemployment rate for two or more race residents
- 5.4%Males
- 7.0%Females
- Unemployment rate for Hispanic or Latino residents
- 4.7%Males
- 5.9%Females

- Year of entry for the foreign-born population in San Diego, California
- 94,4902010 or later
- 75,2272000 to 2009
- 61,2481990 to 1999
- 100,6291980 to 1989
- 54,3441970 to 1979
- 41,645Before 1970

First ancestries reported:
- German: 31,662 (4.0%)
- English: 28,715 (3.6%)
- Irish: 25,842 (3.3%)
- American: 23,769 (3.0%)
- Italian: 17,489 (2.2%)
- European: 14,670 (1.9%)
- Iranian: 9,700 (1.2%)
- Polish: 5,952 (0.8%)
- French: 5,859 (0.7%)
- Russian: 5,572 (0.7%)
- Scottish: 5,454 (0.7%)
- Eastern European: 4,857 (0.6%)
- Portuguese: 4,429 (0.6%)
- African: 4,250 (0.5%)
- Dutch: 4,174 (0.5%)
- Ukrainian: 3,844 (0.5%)
- British: 3,771 (0.5%)
- Norwegian: 3,441 (0.4%)
- Brazilian: 3,189 (0.4%)
- Ethiopian: 3,141 (0.4%)
- Swedish: 2,975 (0.4%)
- Jamaican: 2,626 (0.3%)
- Canadian: 2,573 (0.3%)
- Greek: 2,197 (0.3%)
- Romanian: 2,129 (0.3%)
- Hungarian: 2,004 (0.3%)
- Haitian: 1,845 (0.2%)
- Lebanese: 1,713 (0.2%)
- Israeli: 1,635 (0.2%)
- Scotch-Irish: 1,542 (0.2%)
- Scandinavian: 1,451 (0.2%)
- Swiss: 1,423 (0.2%)
- Danish: 1,345 (0.2%)
- Egyptian: 1,329 (0.2%)
- Arab: 1,224 (0.2%)
- Somali: 1,212 (0.2%)
- French Canadian: 1,080 (0.1%)
- Croatian: 1,045 (0.1%)
- Afghan: 1,011 (0.1%)
- Lithuanian: 978 (0.1%)
- Austrian: 952 (0.1%)
- Czech: 920 (0.1%)
- Serbian: 835 (0.1%)
- Northern European: 772 (0.10%)
- Nigerian: 765 (0.10%)
- Finnish: 765 (0.10%)
- Welsh: 747 (0.09%)
- Belgian: 646 (0.08%)
- Turkish: 626 (0.08%)
- Syrian: 586 (0.07%)
- Iraqi: 548 (0.07%)
- Albanian: 532 (0.07%)
- Sudanese: 510 (0.06%)
- Cypriot: 474 (0.06%)
- Macedonian: 464 (0.06%)
- Armenian: 434 (0.05%)
- Assyrian: 374 (0.05%)
- Basque: 371 (0.05%)
- Palestinian: 346 (0.04%)
- Yugoslavian: 338 (0.04%)
- Slovak: 315 (0.04%)
- Bulgarian: 279 (0.04%)
- Zimbabwean: 272 (0.03%)
- Kenyan: 263 (0.03%)
- Jordanian: 238 (0.03%)
- South African: 232 (0.03%)
- Ugandan: 214 (0.03%)
- Icelander: 207 (0.03%)
- Guyanese: 153 (0.02%)
- Cape Verdean: 115 (0.01%)
- Ghanaian: 103 (0.01%)
- Celtic: 99 (0.01%)
- Slavic: 96 (0.01%)
- West Indian: 92 (0.01%)
- Estonian: 83 (0.01%)
- Belizean: 74 (0.01%)
- Latvian: 70 (0.01%)
- Australian: 54 (0.01%)
- Luxembourger: 54 (0.01%)
- Pennsylvania German: 49 (0.01%)
- Maltese: 49 (0.01%)
- Moroccan: 47 (0.01%)
- Slovene: 44 (0.01%)
Most common places of birth for foreign-born residents (%):
| San Diego: | 29.8% (101,093) |
| California: | 36.6% (3,820,641) |
| San Diego: | 13.1% (44,345) |
| California: | 7.7% (800,706) |
| San Diego: | 7.7% (26,196) |
| California: | 5.0% (517,945) |
| San Diego: | 6.4% (21,877) |
| California: | 6.6% (684,205) |
| San Diego: | 5.7% (19,440) |
| California: | 5.6% (579,387) |
| San Diego: | 2.6% (8,995) |
| California: | 3.1% (320,162) |
| San Diego: | 2.3% (7,943) |
| California: | 2.1% (216,689) |
| San Diego: | 2.0% (6,813) |
| California: | 0.9% (95,485) |
| San Diego: | 1.8% (6,032) |
| California: | 1.2% (128,811) |
| San Diego: | 1.6% (5,512) |
| California: | 1.7% (174,181) |
Place of birth for U.S.-born residents:
- This state: 663,940
- Other state: 344,426
- Northeast: 88,877
- Midwest: 99,015
- South: 93,918
- West: 62,616
85.8% of San Diego residents lived in the same house 1 years ago.
Out of people who lived in different houses, 36.3% lived in this county.
Out of people who lived in different counties, 43.7% lived in California.
| San Diego: | 85.8% |
| State average: | 88.9% |
Education attainment for males 25 years and older:
- No schooling: 10,670
- Nursery to 4th grade: 3,165
- 5th and 6th grade: 3,317
- 7th and 8th grade: 2,510
- 9th grade: 2,930
- 10th grade: 2,867
- 11th grade: 3,781
- 12th grade, no diploma: 11,107
- High school graduate (or equivalency): 73,245
- Less than 1 year of college: 27,296
- Some college more than 1 year, no degree: 68,556
- Associate degree: 35,130
- Bachelor's degree: 141,531
- Master's degree: 65,738
- Professional school degree: 19,244
- Doctorate degree: 21,103

Education attainment for females 25 years and older:
- No schooling: 12,959
- Nursery to 4th grade: 3,929
- 5th and 6th grade: 5,296
- 7th and 8th grade: 3,877
- 9th grade: 5,017
- 10th grade: 4,384
- 11th grade: 4,125
- 12th grade, no diploma: 9,894
- High school graduate (or equivalency): 64,998
- Less than 1 year of college: 24,034
- Some college more than 1 year, no degree: 54,232
- Associate degree: 37,310
- Bachelor's degree: 145,173
- Master's degree: 69,134
- Professional school degree: 17,776
- Doctorate degree: 17,478


Housing units in structures:
- One, detached: 249,668
- One, attached: 51,941
- Two: 14,248
- 3 or 4: 30,740
- 5 to 9: 51,607
- 10 to 19: 40,542
- 20 to 49: 34,836
- 50 or more: 85,579
- Mobile homes: 5,832
- Boats, RVs, vans, etc.: 408
Median worth of mobile homes: $149,100
Housing units lacking complete kitchen facilities in 2022: 1.1%
House/condo owner moved in on average 12 years ago
Renter moved in on average 2 years ago

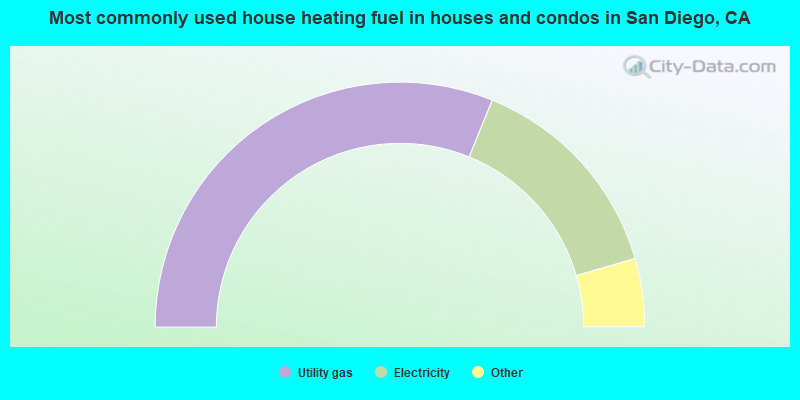
- 64.2%Utility gas
- 25.8%Electricity
- 4.9%No fuel used
- 3.5%Solar energy
- 1.1%Bottled, tank, or LP gas
- 0.3%Wood
- 0.2%Other fuel

- 51.0%Electricity
- 37.6%Utility gas
- 9.2%No fuel used
- 1.3%Bottled, tank, or LP gas
- 0.5%Solar energy
- 0.1%Other fuel
- 0.1%Wood
Private vs. public school enrollment:
| Here: | 13.6% |
| California: | 10.5% |
| Here: | 11.8% |
| California: | 8.5% |
| Here: | 25.1% |
| California: | 15.9% |


