Work and Jobs in San Diego, California (CA) Detailed Stats
Occupations, Industries, Unemployment, Workers, Commute
Settings
X


Recent posts about work in San Diego, California on our local forum with over 2,400,000 registered users:

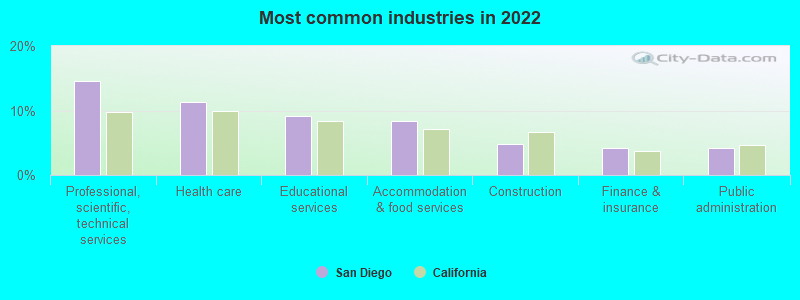
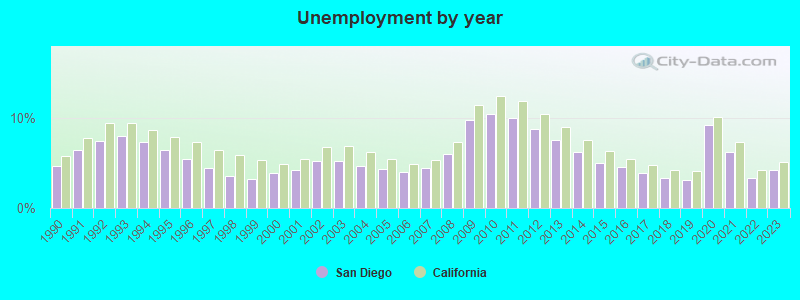
The unemployment rate in 2023 in San Diego, CA was 4.2%, which was 21.4% less than the unemployment rate of 5.1% across the entire state of California. Compared to the unemployment rate of 7.6% in 2013, this represents a decrease of 81.0%. According to 2022 data, the most common industries in San Diego are: Professional, scientific, technical services (14.5% of civilian employees), Health care (11.3% of civilian employees), Educational services (9.2% of civilian employees). 98.8% of workers work in San Diego County and 20.8% of all workers work at home. 65.6% of workers are employees of private companies, which is about the same as the rate of 66.5% across the entire state of California.
Whole page based on the data from 2000 / 2022 when the population of San Diego, California was 1,223,400 / 1,381,182
Whole page based on the data from 2000 / 2022 when the population of San Diego, California was 1,223,400 / 1,381,182
Most common industries


Most common industries | Most common industries | |||||
|---|---|---|---|---|---|---|
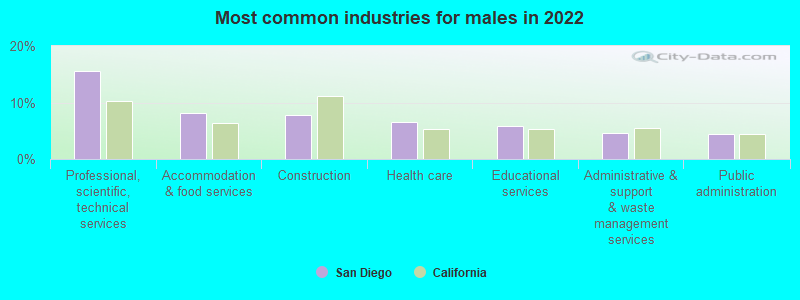
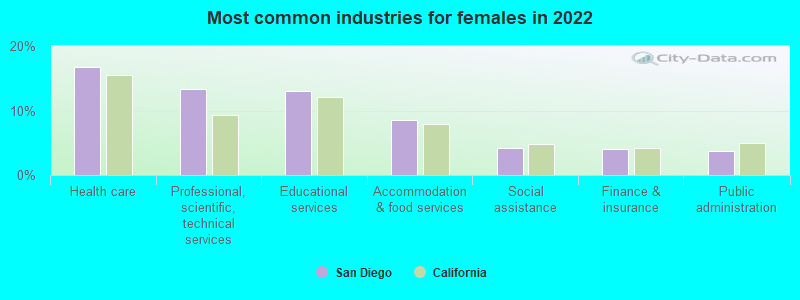
Industry | All | Males | Females | All | Males | Females |
| Professional, scientific, and technical services | 14.5% (103,618) | 15.6% (59,324) | 13.3% (44,294) | 10.6% (58,944) | 11.2% (33,510) | 9.9% (25,434) |
| Health care | 11.3% (80,821) | 6.6% (25,199) | 16.7% (55,622) | 8.8% (48,815) | 4.8% (14,466) | 13.3% (34,349) |
| Educational services | 9.2% (65,724) | 5.9% (22,334) | 13.0% (43,390) | 9.8% (54,854) | 6.6% (19,651) | 13.7% (35,203) |
| Accommodation and food services | 8.4% (59,739) | 8.2% (31,174) | 8.6% (28,565) | 8.1% (44,983) | 8.3% (24,837) | 7.8% (20,146) |
| Construction | 4.8% (34,381) | 7.8% (29,655) | 1.4% (4,726) | 4.8% (26,795) | 7.9% (23,694) | 1.2% (3,101) |
| Finance and insurance | 4.2% (29,599) | 4.3% (16,446) | 4.0% (13,153) | 4.8% (26,596) | 3.9% (11,584) | 5.8% (15,012) |
| Public administration | 4.1% (29,405) | 4.5% (17,155) | 3.7% (12,250) | 5.3% (29,341) | 5.8% (17,331) | 4.7% (12,010) |
| Administrative and support and waste management services | 4.0% (28,687) | 4.5% (17,289) | 3.4% (11,398) | 4.4% (24,385) | 5.0% (14,935) | 3.7% (9,450) |
| Arts, entertainment, and recreation | 2.7% (18,922) | 2.6% (9,912) | 2.7% (9,010) | 2.4% (13,583) | 2.6% (7,802) | 2.2% (5,781) |
| Computer and electronic products | 2.7% (18,921) | 4.0% (15,272) | 1.1% (3,649) | 3.6% (20,154) | 4.4% (13,253) | 2.7% (6,901) |
| Social assistance | 2.4% (17,338) | 1.0% (3,642) | 4.1% (13,696) | 1.9% (10,738) | 0.6% (1,702) | 3.5% (9,036) |
| Real estate and rental and leasing | 2.2% (15,485) | 2.1% (7,930) | 2.3% (7,555) | 2.6% (14,219) | 2.5% (7,616) | 2.6% (6,603) |
| Personal and laundry services | 2.0% (14,470) | 1.5% (5,661) | 2.6% (8,809) | 1.6% (8,758) | 1.0% (3,016) | 2.2% (5,742) |
| Other transportation, and support activities, and couriers | 2.0% (14,266) | 3.2% (12,246) | 0.6% (2,020) | 1.3% (6,985) | 1.8% (5,506) | 0.6% (1,479) |
| Food and beverage stores | 1.9% (13,457) | 2.1% (7,995) | 1.6% (5,462) | 1.5% (8,262) | 1.6% (4,793) | 1.3% (3,469) |
| Miscellaneous manufacturing | 1.7% (11,947) | 1.8% (6,978) | 1.5% (4,969) | 1.7% (9,501) | 1.9% (5,746) | 1.5% (3,755) |
| Transportation equipment | 1.7% (11,911) | 2.3% (8,646) | 1.0% (3,265) | 1.3% (7,026) | 2.0% (6,051) | 0.4% (975) |
| Chemicals | 1.3% (9,172) | 1.2% (4,469) | 1.4% (4,703) | 0.8% (4,276) | 0.7% (2,186) | 0.8% (2,090) |
| Religious, grantmaking, civic, professional, and similar organizations | 1.3% (9,107) | 1.1% (4,066) | 1.5% (5,041) | 1.3% (7,240) | 1.0% (2,864) | 1.7% (4,376) |
| Clothing and accessories, including shoe, stores | 1.0% (7,276) | 0.6% (2,271) | 1.5% (5,005) | 0.7% (3,950) | 0.5% (1,401) | 1.0% (2,549) |
| Department and other general merchandise stores | 1.0% (7,121) | 0.8% (3,105) | 1.2% (4,016) | 1.5% (8,088) | 1.0% (2,893) | 2.0% (5,195) |
| Broadcasting and telecommunications | 1.0% (7,067) | 1.4% (5,221) | 0.6% (1,846) | 2.0% (11,081) | 2.3% (6,755) | 1.7% (4,326) |
| Publishing, and motion picture and sound recording industries | 0.9% (6,762) | 1.2% (4,534) | 0.7% (2,228) | 1.2% (6,446) | 1.2% (3,676) | 1.1% (2,770) |
| Electronic shopping and mail-order houses | 0.8% (5,869) | 0.8% (2,862) | 0.9% (3,007) | 0.3% (1,624) | 0.3% (954) | 0.3% (670) |
| Repair and maintenance | 0.7% (5,322) | 1.2% (4,708) | 0.2% (614) | 1.3% (7,458) | 2.2% (6,547) | 0.4% (911) |
| Motor vehicle and parts dealers | 0.7% (4,986) | 1.1% (4,172) | 0.2% (814) | 1.0% (5,748) | 1.5% (4,649) | 0.4% (1,099) |
| Utilities | 0.7% (4,861) | 0.8% (2,901) | 0.6% (1,960) | 0.5% (3,003) | 0.7% (2,094) | 0.4% (909) |
| Private households | 0.7% (4,785) | 0.1% (252) | 1.4% (4,533) | 0.8% (4,333) | 0.1% (341) | 1.6% (3,992) |
| Other direct selling establishments | 0.6% (4,540) | 0.6% (2,443) | 0.6% (2,097) | 0.5% (2,835) | 0.5% (1,350) | 0.6% (1,485) |
| Machinery | 0.6% (3,964) | 0.9% (3,363) | 0.2% (601) | 0.6% (3,507) | 0.9% (2,671) | 0.3% (836) |
| Truck transportation | 0.5% (3,833) | 0.9% (3,537) | 0.1% (296) | 0.6% (3,138) | 0.9% (2,682) | 0.2% (456) |
| Used merchandise, gift, novelty, and souvenir, and other miscellaneous stores | 0.5% (3,498) | 0.4% (1,700) | 0.5% (1,798) | 0.7% (4,158) | 0.6% (1,858) | 0.9% (2,300) |
| Air transportation | 0.5% (3,481) | 0.5% (1,732) | 0.5% (1,749) | 0.6% (3,072) | 0.6% (1,676) | 0.5% (1,396) |
| Building material and garden equipment and supplies dealers | 0.5% (3,452) | 0.6% (2,433) | 0.3% (1,019) | 0.5% (2,892) | 0.7% (2,023) | 0.3% (869) |
| Beverage and tobacco products | 0.4% (3,183) | 0.5% (2,060) | 0.3% (1,123) | 0.1% (343) | 0.1% (275) | 0.0% (68) |
| Pharmacies and drug stores | 0.4% (2,977) | 0.3% (1,086) | 0.6% (1,891) | 0.5% (2,660) | 0.4% (1,109) | 0.6% (1,551) |
| Groceries and related products merchant wholesalers | 0.4% (2,893) | 0.5% (2,037) | 0.3% (856) | 0.4% (2,296) | 0.6% (1,684) | 0.2% (612) |
| Health and personal care, except drug, stores | 0.4% (2,722) | 0.3% (1,041) | 0.5% (1,681) | 0.2% (1,330) | 0.1% (447) | 0.3% (883) |
| Radio, TV, and computer stores | 0.4% (2,547) | 0.5% (1,790) | 0.2% (757) | 1.0% (5,398) | 1.2% (3,532) | 0.7% (1,866) |
| Data processing, libraries, and other information services | 0.4% (2,540) | 0.3% (1,220) | 0.4% (1,320) | 0.9% (4,832) | 1.0% (2,901) | 0.8% (1,931) |
| Metal and metal products | 0.3% (2,281) | 0.5% (1,875) | 0.1% (406) | 0.4% (2,503) | 0.7% (2,162) | 0.1% (341) |
| Furniture and home furnishings, and household appliance stores | 0.3% (2,243) | 0.4% (1,591) | 0.2% (652) | 0.5% (2,763) | 0.5% (1,601) | 0.5% (1,162) |
| Food | 0.3% (2,036) | 0.2% (917) | 0.3% (1,119) | 0.3% (1,750) | 0.3% (955) | 0.3% (795) |
| U. S. Postal service | 0.3% (1,824) | 0.3% (961) | 0.3% (863) | 0.6% (3,524) | 0.8% (2,354) | 0.5% (1,170) |
| Electrical equipment, appliances, and components | 0.2% (1,611) | 0.4% (1,543) | 0.0% (68) | 0.2% (1,335) | 0.3% (875) | 0.2% (460) |
| Agriculture, forestry, fishing and hunting | 0.2% (1,539) | 0.2% (927) | 0.2% (612) | 0.3% (1,508) | 0.4% (1,105) | 0.2% (403) |
| Sporting goods, camera, and hobby and toy stores | 0.2% (1,518) | 0.2% (877) | 0.2% (641) | 0.4% (2,197) | 0.5% (1,555) | 0.2% (642) |
| Management of companies and enterprises | 0.2% (1,427) | 0.2% (938) | 0.1% (489) | 0.0% (198) | 0.0% (43) | 0.1% (155) |
| Warehousing and storage | 0.2% (1,412) | 0.2% (773) | 0.2% (639) | 0.1% (666) | 0.2% (512) | 0.1% (154) |
| Miscellaneous nondurable goods merchant wholesalers | 0.1% (1,023) | 0.1% (484) | 0.2% (539) | 0.4% (2,149) | 0.4% (1,214) | 0.4% (935) |
| Professional and commercial equipment and supplies merchant wholesalers | 0.1% (870) | 0.1% (368) | 0.2% (502) | 0.3% (1,897) | 0.4% (1,268) | 0.2% (629) |
| Printing and related support activities | 0.1% (822) | 0.2% (705) | 0.0% (117) | 0.5% (2,959) | 0.6% (1,945) | 0.4% (1,014) |
| Drugs, sundries, and chemical and allied products merchant wholesalers | 0.1% (760) | 0.1% (336) | 0.1% (424) | 0.2% (859) | 0.1% (336) | 0.2% (523) |
| Book stores and news dealers | 0.1% (710) | 0.1% (259) | 0.1% (451) | 0.2% (1,160) | 0.2% (499) | 0.3% (661) |
| Apparel, fabrics, and notions merchant wholesalers | 0.1% (706) | 0.1% (428) | 0.1% (278) | 0.0% (262) | 0.0% (77) | 0.1% (185) |
| Alcoholic beverages merchant wholesalers | 0.1% (699) | 0.1% (553) | 0.0% (146) | 0.1% (479) | 0.1% (428) | 0.0% (51) |
| Jewelry, luggage, and leather goods stores | 0.1% (688) | 0.1% (278) | 0.1% (410) | 0.1% (826) | 0.1% (357) | 0.2% (469) |
| Furniture and related product manufacturing | 0.1% (627) | 0.1% (479) | 0.0% (148) | 0.3% (1,515) | 0.4% (1,136) | 0.1% (379) |
| Textile mills and textile products | 0.1% (593) | 0.0% (180) | 0.1% (413) | 0.1% (593) | 0.1% (306) | 0.1% (287) |
| Wood products | 0.1% (584) | 0.1% (450) | 0.0% (134) | 0.1% (344) | 0.1% (278) | 0.0% (66) |
| Electrical and electronic goods merchant wholesalers | 0.1% (584) | 0.1% (536) | 0.0% (48) | 0.3% (1,677) | 0.4% (1,193) | 0.2% (484) |
| Machinery, equipment, and supplies merchant wholesalers | 0.1% (576) | 0.1% (469) | 0.0% (107) | 0.2% (1,040) | 0.3% (783) | 0.1% (257) |
| Hardware, plumbing and heating equipment, and supplies merchant wholesalers | 0.1% (568) | 0.1% (409) | 0.0% (159) | 0.1% (759) | 0.2% (590) | 0.1% (169) |
| Nonmetallic mineral products | 0.1% (562) | 0.1% (492) | 0.0% (70) | 0.1% (560) | 0.1% (372) | 0.1% (188) |
| Apparel | 0.1% (540) | 0.1% (269) | 0.1% (271) | 0.2% (1,351) | 0.2% (452) | 0.3% (899) |
| Gasoline stations | 0.1% (511) | 0.1% (277) | 0.1% (234) | 0.2% (1,006) | 0.2% (646) | 0.1% (360) |
| Petroleum and petroleum products merchant wholesalers | 0.1% (462) | 0.1% (462) | 0.0% (0) | 0.0% (147) | 0.0% (130) | 0.0% (17) |
| Motor vehicles, parts and supplies merchant wholesalers | 0.1% (447) | 0.1% (340) | 0.0% (107) | 0.1% (705) | 0.2% (559) | 0.1% (146) |
| Miscellaneous durable goods merchant wholesalers | 0.1% (423) | 0.1% (223) | 0.1% (200) | 0.2% (1,150) | 0.2% (647) | 0.2% (503) |
| Plastics and rubber products | 0.1% (422) | 0.0% (59) | 0.1% (363) | 0.2% (988) | 0.2% (639) | 0.1% (349) |
| Office supplies and stationery stores | 0.1% (418) | 0.1% (319) | 0.0% (99) | 0.1% (792) | 0.1% (413) | 0.1% (379) |
| Furniture and home furnishing merchant wholesalers | 0.0% (328) | 0.1% (328) | 0.0% (0) | 0.1% (541) | 0.1% (306) | 0.1% (235) |
| Music stores | 0.0% (161) | 0.0% (161) | 0.0% (0) | 0.1% (705) | 0.1% (379) | 0.1% (326) |
Unemployment in San Diego
- Unemployment by race in 2022
- Unemployment rate for White non-Hispanic residents
- 4.0%Males
- 4.7%Females
- Unemployment rate for Black residents
- 4.9%Males
- 5.7%Females
- Unemployment rate for American Indian and Alaska Native residents
- 1.5%Males
- 2.6%Females
- Unemployment rate for Asian residents
- 4.3%Males
- 4.2%Females
- Unemployment rate for other race residents
- 5.0%Males
- 4.7%Females
- Unemployment rate for two or more race residents
- 5.4%Males
- 7.0%Females
- Unemployment rate for Hispanic or Latino residents
- 4.7%Males
- 5.9%Females
- Unemployment by race in 2000
- Unemployment rate for White non-Hispanic residents
- 4.5%Males
- 4.8%Females
- Unemployment rate for Black residents
- 10.0%Males
- 9.7%Females
- Unemployment rate for American Indian and Alaska Native residents
- 6.7%Males
- 11.7%Females
- Unemployment rate for Asian residents
- 5.7%Males
- 5.6%Females
- Unemployment rate for other race residents
- 8.4%Males
- 10.0%Females
- Unemployment rate for two or more race residents
- 7.8%Males
- 8.2%Females
- Unemployment rate for Hispanic or Latino residents
- 8.2%Males
- 9.9%Females
Unemployment in 2023:
| San Diego: | 4.2% |
| California: | 5.1% |
Unemployment in 2022:
| San Diego: | 3.3% |
| California: | 4.2% |
Unemployment in 2021:
| San Diego: | 6.2% |
| California: | 7.3% |
Unemployment in 2020:
| San Diego: | 9.2% |
| California: | 10.1% |
Unemployment in 2019:
| San Diego: | 3.1% |
| California: | 4.1% |
Unemployment in 2018:
| San Diego: | 3.3% |
| California: | 4.2% |
Unemployment in 2017:
| San Diego: | 3.9% |
| California: | 4.8% |
Unemployment in 2016:
| San Diego: | 4.6% |
| California: | 5.5% |
Unemployment in 2015:
| San Diego: | 5.0% |
| California: | 6.3% |
Unemployment in 2014:
| San Diego: | 6.2% |
| California: | 7.6% |
Unemployment in 2013:
| San Diego: | 7.6% |
| California: | 9.0% |
Unemployment in 2012:
| San Diego: | 8.8% |
| California: | 10.5% |
Unemployment in 2011:
| San Diego: | 10.0% |
| California: | 11.9% |
Unemployment in 2010:
| San Diego: | 10.5% |
| California: | 12.5% |
Unemployment in 2009:
| San Diego: | 9.8% |
| California: | 11.5% |
Unemployment in 2008:
| San Diego: | 6.0% |
| California: | 7.3% |
Unemployment in 2007:
| San Diego: | 4.5% |
| California: | 5.3% |
Unemployment in 2006:
| San Diego: | 4.0% |
| California: | 4.9% |
Unemployment in 2005:
| San Diego: | 4.3% |
| California: | 5.4% |
Unemployment in 2004:
| San Diego: | 4.7% |
| California: | 6.2% |
Unemployment in 2003:
| San Diego: | 5.2% |
| California: | 6.9% |
Unemployment in 2002:
| San Diego: | 5.2% |
| California: | 6.8% |
Unemployment in 2001:
| San Diego: | 4.2% |
| California: | 5.5% |
Unemployment in 2000:
| San Diego: | 3.9% |
| California: | 4.9% |
Unemployment in 1999:
| San Diego: | 3.2% |
| California: | 5.3% |
Unemployment in 1998:
| San Diego: | 3.6% |
| California: | 5.9% |
Unemployment in 1997:
| San Diego: | 4.4% |
| California: | 6.4% |
Unemployment in 1996:
| San Diego: | 5.5% |
| California: | 7.3% |
Unemployment in 1995:
| San Diego: | 6.4% |
| California: | 7.9% |
Unemployment in 1994:
| San Diego: | 7.3% |
| California: | 8.7% |
Unemployment in 1993:
| San Diego: | 8.0% |
| California: | 9.5% |
Unemployment in 1992:
| San Diego: | 7.4% |
| California: | 9.4% |
Unemployment in 1991:
| San Diego: | 6.5% |
| California: | 7.8% |
Unemployment in 1990:
| San Diego: | 4.7% |
| California: | 5.8% |
Time leaving home to go to work

12:00 a.m. to 4:59 a.m.:
| San Diego: | 4.1% (23,662) |
| California: | 6.8% (1,050,902) |
5:00 a.m. to 5:29 a.m.:
| San Diego: | 3.0% (17,352) |
| California: | 4.5% (692,772) |
5:30 a.m. to 5:59 a.m.:
| San Diego: | 3.5% (20,647) |
| California: | 4.3% (665,475) |
6:00 a.m. to 6:29 a.m.:
| San Diego: | 7.8% (45,202) |
| California: | 8.3% (1,273,588) |
6:30 a.m. to 6:59 a.m.:
| San Diego: | 7.3% (42,759) |
| California: | 7.5% (1,156,338) |
7:00 a.m. to 7:29 a.m.:
| San Diego: | 11.8% (68,671) |
| California: | 13.2% (2,027,702) |
7:30 a.m. to 7:59 a.m.:
| San Diego: | 10.1% (58,816) |
| California: | 10.1% (1,550,402) |
8:00 a.m. to 8:29 a.m.:
| San Diego: | 18.0% (104,666) |
| California: | 12.7% (1,953,986) |
8:30 a.m. to 8:59 a.m.:
| San Diego: | 6.5% (37,576) |
| California: | 5.8% (890,950) |
9:00 a.m. to 9:59 a.m.:
| San Diego: | 9.3% (53,962) |
| California: | 8.4% (1,288,499) |
10:00 a.m. to 10:59 a.m.:
| San Diego: | 4.2% (24,449) |
| California: | 4.0% (613,193) |
11:00 a.m. to 11:59 a.m.:
| San Diego: | 1.9% (10,989) |
| California: | 1.8% (280,975) |
12:00 p.m. to 3:59 p.m.:
| San Diego: | 7.2% (42,138) |
| California: | 7.0% (1,075,505) |
4:00 p.m. to 11:59 p.m.:
| San Diego: | 5.4% (31,529) |
| California: | 5.8% (891,240) |

<5am:
| San Diego: | 2.9% (16,682) |
| California: | 4.2% (606,086) |
5:30am:
| San Diego: | 2.8% (16,206) |
| California: | 3.6% (523,209) |
6am:
| San Diego: | 4.7% (27,347) |
| California: | 4.8% (692,256) |
6:30am:
| San Diego: | 8.5% (49,570) |
| California: | 8.4% (1,216,867) |
7am:
| San Diego: | 10.4% (60,529) |
| California: | 9.4% (1,362,830) |
7:30am:
| San Diego: | 14.2% (82,172) |
| California: | 13.8% (2,006,950) |
8am:
| San Diego: | 12.9% (75,028) |
| California: | 13.7% (1,986,831) |
8:30am:
| San Diego: | 11.0% (63,576) |
| California: | 10.9% (1,577,815) |
9am:
| San Diego: | 6.0% (34,687) |
| California: | 5.4% (778,152) |
10am:
| San Diego: | 6.7% (38,772) |
| California: | 6.7% (972,355) |
11am:
| San Diego: | 2.9% (16,663) |
| California: | 2.9% (414,479) |
12pm:
| San Diego: | 1.3% (7,668) |
| California: | 1.3% (189,005) |
4pm:
| San Diego: | 6.0% (35,050) |
| California: | 6.0% (865,284) |
>4pm:
| San Diego: | 5.7% (33,040) |
| California: | 5.3% (776,167) |

12:00 a.m. to 4:59 a.m. - Males:
| San Diego: | 5.2% (16,941) |
| California: | 8.7% (747,612) |
5:00 a.m. to 5:29 a.m. - Males:
| San Diego: | 4.2% (13,556) |
| California: | 6.0% (509,420) |
5:30 a.m. to 5:59 a.m. - Males:
| San Diego: | 4.6% (15,080) |
| California: | 5.2% (448,269) |
6:00 a.m. to 6:29 a.m. - Males:
| San Diego: | 9.0% (29,464) |
| California: | 9.8% (842,941) |
6:30 a.m. to 6:59 a.m. - Males:
| San Diego: | 7.3% (23,901) |
| California: | 7.7% (657,557) |
7:00 a.m. to 7:29 a.m. - Males:
| San Diego: | 10.9% (35,616) |
| California: | 12.4% (1,058,532) |
7:30 a.m. to 7:59 a.m. - Males:
| San Diego: | 9.0% (29,313) |
| California: | 8.2% (702,727) |
8:00 a.m. to 8:29 a.m. - Males:
| San Diego: | 16.9% (55,002) |
| California: | 11.5% (984,538) |
8:30 a.m. to 8:59 a.m. - Males:
| San Diego: | 6.1% (20,025) |
| California: | 4.8% (414,815) |
9:00 a.m. to 9:59 a.m. - Males:
| San Diego: | 9.2% (29,878) |
| California: | 7.7% (655,038) |
10:00 a.m. to 10:59 a.m. - Males:
| San Diego: | 3.6% (11,649) |
| California: | 3.5% (301,425) |
11:00 a.m. to 11:59 a.m. - Males:
| San Diego: | 1.9% (6,112) |
| California: | 1.7% (141,620) |
12:00 p.m. to 3:59 p.m. - Males:
| San Diego: | 7.2% (23,396) |
| California: | 7.0% (594,847) |
4:00 p.m. to 11:59 p.m. - Males:
| San Diego: | 4.8% (15,789) |
| California: | 5.8% (499,471) |

12:00 a.m. to 4:59 a.m. - Females:
| San Diego: | 2.6% (6,721) |
| California: | 4.4% (303,290) |
5:00 a.m. to 5:29 a.m. - Females:
| San Diego: | 1.5% (3,796) |
| California: | 2.7% (183,352) |
5:30 a.m. to 5:59 a.m. - Females:
| San Diego: | 2.2% (5,567) |
| California: | 3.2% (217,206) |
6:00 a.m. to 6:29 a.m. - Females:
| San Diego: | 6.1% (15,738) |
| California: | 6.3% (430,647) |
6:30 a.m. to 6:59 a.m. - Females:
| San Diego: | 7.3% (18,858) |
| California: | 7.3% (498,781) |
7:00 a.m. to 7:29 a.m. - Females:
| San Diego: | 12.9% (33,055) |
| California: | 14.1% (969,170) |
7:30 a.m. to 7:59 a.m. - Females:
| San Diego: | 11.5% (29,503) |
| California: | 12.4% (847,675) |
8:00 a.m. to 8:29 a.m. - Females:
| San Diego: | 19.3% (49,664) |
| California: | 14.1% (969,448) |
8:30 a.m. to 8:59 a.m. - Females:
| San Diego: | 6.8% (17,551) |
| California: | 6.9% (476,135) |
9:00 a.m. to 9:59 a.m. - Females:
| San Diego: | 9.4% (24,084) |
| California: | 9.2% (633,461) |
10:00 a.m. to 10:59 a.m. - Females:
| San Diego: | 5.0% (12,800) |
| California: | 4.5% (311,768) |
11:00 a.m. to 11:59 a.m. - Females:
| San Diego: | 1.9% (4,877) |
| California: | 2.0% (139,355) |
12:00 p.m. to 3:59 p.m. - Females:
| San Diego: | 7.3% (18,742) |
| California: | 7.0% (480,658) |
4:00 p.m. to 11:59 p.m. - Females:
| San Diego: | 6.1% (15,740) |
| California: | 5.7% (391,769) |
Travel time to work
Percentage of workers working in this county: 98.8%
Number of people working at home: 152,868 (20.8% of all workers)
Daytime population change due to commuting: +141,927 (+11.6%)
Workers who live and work in this city: 450,898 (77.7%)
Number of people working at home: 152,868 (20.8% of all workers)
Daytime population change due to commuting: +141,927 (+11.6%)
Workers who live and work in this city: 450,898 (77.7%)


Less than 5 minutes:
| San Diego: | 1.5% (11,267) |
| California: | 2.1% (323,064) |
5 to 9 minutes:
| San Diego: | 5.3% (39,835) |
| California: | 7.8% (1,208,682) |
10 to 14 minutes:
| San Diego: | 11.1% (84,104) |
| California: | 12.4% (1,917,610) |
15 to 19 minutes:
| San Diego: | 16.3% (123,321) |
| California: | 15.3% (2,367,483) |
20 to 24 minutes:
| San Diego: | 17.8% (134,582) |
| California: | 14.8% (2,279,693) |
25 to 29 minutes:
| San Diego: | 8.0% (60,359) |
| California: | 6.4% (981,997) |
30 to 34 minutes:
| San Diego: | 17.4% (131,160) |
| California: | 15.2% (2,339,223) |
35 to 39 minutes:
| San Diego: | 3.4% (25,649) |
| California: | 2.9% (453,226) |
40 to 44 minutes:
| San Diego: | 4.2% (31,368) |
| California: | 4.1% (637,781) |
45 to 59 minutes:
| San Diego: | 6.7% (50,516) |
| California: | 8.2% (1,259,482) |
60 to 89 minutes:
| San Diego: | 5.5% (41,615) |
| California: | 7.2% (1,111,698) |
90 or more minutes:
| San Diego: | 2.8% (21,073) |
| California: | 3.6% (552,805) |


Less than 5 minutes:
| San Diego: | 2.0% (11,681) |
| California: | 2.2% (324,703) |
5 to 9 minutes:
| San Diego: | 8.0% (46,561) |
| California: | 8.8% (1,280,443) |
10 to 14 minutes:
| San Diego: | 14.0% (81,475) |
| California: | 13.3% (1,930,263) |
15 to 19 minutes:
| San Diego: | 19.0% (110,517) |
| California: | 14.9% (2,157,970) |
20 to 24 minutes:
| San Diego: | 18.2% (105,349) |
| California: | 13.8% (2,004,060) |
25 to 29 minutes:
| San Diego: | 7.1% (41,364) |
| California: | 5.4% (782,241) |
30 to 34 minutes:
| San Diego: | 14.2% (82,496) |
| California: | 13.9% (2,025,657) |
35 to 39 minutes:
| San Diego: | 2.2% (13,042) |
| California: | 2.5% (366,487) |
40 to 44 minutes:
| San Diego: | 2.5% (14,789) |
| California: | 3.6% (528,043) |
45 to 59 minutes:
| San Diego: | 4.2% (24,308) |
| California: | 7.9% (1,151,598) |
60 to 89 minutes:
| San Diego: | 2.5% (14,468) |
| California: | 6.4% (933,123) |
90 or more minutes:
| San Diego: | 1.9% (10,940) |
| California: | 3.3% (483,698) |

Less than 5 minutes - Males:
| San Diego: | 1.4% (5,828) |
| California: | 2.0% (173,603) |
5 to 9 minutes - Males:
| San Diego: | 4.9% (21,082) |
| California: | 6.8% (580,822) |
10 to 14 minutes - Males:
| San Diego: | 11.1% (47,534) |
| California: | 11.4% (974,497) |
15 to 19 minutes - Males:
| San Diego: | 15.9% (68,057) |
| California: | 14.5% (1,239,386) |
20 to 24 minutes - Males:
| San Diego: | 17.6% (75,073) |
| California: | 14.3% (1,223,429) |
25 to 29 minutes - Males:
| San Diego: | 8.6% (36,490) |
| California: | 6.4% (545,844) |
30 to 34 minutes - Males:
| San Diego: | 17.1% (72,795) |
| California: | 15.8% (1,352,210) |
35 to 39 minutes - Males:
| San Diego: | 3.3% (14,155) |
| California: | 3.0% (253,732) |
40 to 44 minutes - Males:
| San Diego: | 3.9% (16,827) |
| California: | 4.4% (376,144) |
45 to 59 minutes - Males:
| San Diego: | 7.1% (30,310) |
| California: | 8.9% (762,659) |
60 to 89 minutes - Males:
| San Diego: | 5.9% (25,089) |
| California: | 8.3% (711,394) |
90 or more minutes - Males:
| San Diego: | 3.2% (13,529) |
| California: | 4.4% (378,954) |

Less than 5 minutes - Females:
| San Diego: | 1.7% (5,439) |
| California: | 2.2% (149,461) |
5 to 9 minutes - Females:
| San Diego: | 5.7% (18,753) |
| California: | 9.2% (627,860) |
10 to 14 minutes - Females:
| San Diego: | 11.1% (36,570) |
| California: | 13.7% (943,113) |
15 to 19 minutes - Females:
| San Diego: | 16.8% (55,264) |
| California: | 16.4% (1,128,097) |
20 to 24 minutes - Females:
| San Diego: | 18.1% (59,509) |
| California: | 15.4% (1,056,264) |
25 to 29 minutes - Females:
| San Diego: | 7.3% (23,869) |
| California: | 6.4% (436,153) |
30 to 34 minutes - Females:
| San Diego: | 17.8% (58,365) |
| California: | 14.4% (987,013) |
35 to 39 minutes - Females:
| San Diego: | 3.5% (11,494) |
| California: | 2.9% (199,494) |
40 to 44 minutes - Females:
| San Diego: | 4.4% (14,541) |
| California: | 3.8% (261,637) |
45 to 59 minutes - Females:
| San Diego: | 6.2% (20,206) |
| California: | 7.2% (496,823) |
60 to 89 minutes - Females:
| San Diego: | 5.0% (16,526) |
| California: | 5.8% (400,304) |
90 or more minutes - Females:
| San Diego: | 2.3% (7,544) |
| California: | 2.5% (173,851) |
Means of transportation to work


Drove car alone:
| San Diego: | 80.5% (607,529) |
| California: | 79.1% (5,345,368) |
Carpooled:
| San Diego: | 10.3% (77,610) |
| California: | 11.9% (878,699) |
Bus:
| San Diego: | 2.5% (18,951) |
| California: | 2.2% (170,574) |
Subway or elevated rail:
| San Diego: | 0.1% (750) |
| California: | 0.6% (40,665) |
Long-distance train or commuter rail:
| San Diego: | 0.1% (717) |
| California: | 0.2% (16,750) |
Light rail, streetcar or trolley:
| San Diego: | 0.6% (4,433) |
| California: | 0.1% (8,965) |
Ferryboat:
| San Diego: | 0.0% (82) |
| California: | 0.1% (3,989) |
Bicycle:
| San Diego: | 0.6% (4,520) |
| California: | 0.9% (39,197) |
Walked:
| San Diego: | 3.7% (27,559) |
| California: | 2.9% (218,374) |
Other means:
| San Diego: | 1.7% (12,698) |
| California: | 2.1% (137,489) |


Drove car alone:
| San Diego: | 74.0% (429,311) |
| California: | 71.8% (10,432,462) |
Carpooled:
| San Diego: | 12.2% (70,745) |
| California: | 14.5% (2,113,313) |
Bus or trolley bus:
| San Diego: | 3.8% (22,342) |
| California: | 3.8% (549,425) |
Streetcar or trolley car:
| San Diego: | 0.2% (881) |
| California: | 0.1% (21,158) |
Subway or elevated:
| San Diego: | 0.0% (162) |
| California: | 0.7% (107,711) |
Railroad:
| San Diego: | 0.0% (268) |
| California: | 0.3% (41,022) |
Ferryboat:
| San Diego: | 0.0% (83) |
| California: | 0.0% (6,831) |
Taxicab:
| San Diego: | 0.1% (500) |
| California: | 0.1% (9,890) |
Motorcycle:
| San Diego: | 0.3% (1,669) |
| California: | 0.2% (36,262) |
Bicycle:
| San Diego: | 0.7% (4,214) |
| California: | 0.8% (120,567) |
Walked:
| San Diego: | 3.6% (21,172) |
| California: | 2.9% (414,581) |
Other means:
| San Diego: | 1.0% (5,643) |
| California: | 0.8% (115,064) |


Drove car alone - Males:
| San Diego: | 81.4% (347,350) |
| California: | 80.0% (5,345,368) |
Carpooled - Males:
| San Diego: | 9.5% (40,506) |
| California: | 11.1% (878,699) |
Bus - Males:
| San Diego: | 2.3% (9,915) |
| California: | 2.0% (170,574) |
Subway or elevated rail - Males:
| San Diego: | 0.1% (540) |
| California: | 0.5% (40,665) |
Long-distance train or commuter rail - Males:
| San Diego: | 0.1% (623) |
| California: | 0.2% (16,750) |
Light rail, streetcar or trolley - Males:
| San Diego: | 0.4% (1,823) |
| California: | 0.1% (8,965) |
Bicycle - Males:
| San Diego: | 0.8% (3,219) |
| California: | 1.1% (39,197) |
Walked - Males:
| San Diego: | 3.4% (14,459) |
| California: | 2.7% (218,374) |
Other means - Males:
| San Diego: | 2.0% (8,334) |
| California: | 2.1% (137,489) |


Drove car alone - Females:
| San Diego: | 79.3% (260,179) |
| California: | 77.9% (5,345,368) |
Carpooled - Females:
| San Diego: | 11.3% (37,104) |
| California: | 12.8% (878,699) |
Bus - Females:
| San Diego: | 2.8% (9,036) |
| California: | 2.5% (170,574) |
Subway or elevated rail - Females:
| San Diego: | 0.1% (210) |
| California: | 0.6% (40,665) |
Long-distance train or commuter rail - Females:
| San Diego: | 0.0% (94) |
| California: | 0.2% (16,750) |
Light rail, streetcar or trolley - Females:
| San Diego: | 0.8% (2,610) |
| California: | 0.1% (8,965) |
Ferryboat - Females:
| San Diego: | 0.0% (82) |
| California: | 0.1% (3,989) |
Bicycle - Females:
| San Diego: | 0.4% (1,301) |
| California: | 0.6% (39,197) |
Walked - Females:
| San Diego: | 4.0% (13,100) |
| California: | 3.2% (218,374) |
Other means - Females:
| San Diego: | 1.3% (4,364) |
| California: | 2.0% (137,489) |
Private vehicle occupancy

Drove alone:
| San Diego: | 89.2% (462,550) |
| California: | 86.9% (12,187,486) |
In 2 person carpool:
| San Diego: | 7.0% (36,249) |
| California: | 9.2% (1,295,561) |
In 3 person carpool:
| San Diego: | 1.9% (9,743) |
| California: | 2.2% (309,969) |
In 4 person carpool:
| San Diego: | 0.8% (4,186) |
| California: | 0.9% (126,987) |
In 5-6 person carpool:
| San Diego: | 0.6% (2,935) |
| California: | 0.5% (70,825) |
In 7+ person carpool:
| San Diego: | 0.6% (2,971) |
| California: | 0.2% (28,258) |

Drove alone:
| San Diego: | 85.9% (429,311) |
| California: | 83.2% (10,432,462) |
In 2 person carpool:
| San Diego: | 11.2% (56,253) |
| California: | 12.5% (1,564,905) |
In 3 person carpool:
| San Diego: | 1.9% (9,361) |
| California: | 2.6% (330,732) |
In 4 person carpool:
| San Diego: | 0.6% (2,995) |
| California: | 1.0% (119,364) |
In 5-6 person carpool:
| San Diego: | 0.2% (1,224) |
| California: | 0.5% (57,036) |
In 7+ person carpool:
| San Diego: | 0.2% (912) |
| California: | 0.3% (41,276) |
Class of workers

Employee of private company:
| San Diego: | 65.6% (468,087) |
| California: | 66.5% (12,596,030) |
Self-employed in own incorporated business:
| San Diego: | 4.5% (32,436) |
| California: | 4.1% (784,709) |
Private not-for-profit wage and salary workers:
| San Diego: | 9.6% (68,289) |
| California: | 7.5% (1,417,407) |
Local government workers:
| San Diego: | 5.6% (40,200) |
| California: | 8.2% (1,547,056) |
State government workers:
| San Diego: | 4.4% (31,702) |
| California: | 4.1% (780,915) |
Federal government workers:
| San Diego: | 3.7% (26,545) |
| California: | 2.0% (369,858) |
Self-employed workers in own not incorporated business:
| San Diego: | 6.2% (44,370) |
| California: | 7.4% (1,410,735) |
Unpaid family workers:
| San Diego: | 0.2% (1,530) |
| California: | 0.2% (36,267) |

Employee of private company:
| San Diego: | 65.8% (366,767) |
| California: | 68.0% (10,009,465) |
Self-employed in own incorporated business:
| San Diego: | 2.4% (13,543) |
| California: | 2.7% (402,392) |
Private not-for-profit wage and salary workers:
| San Diego: | 7.0% (39,098) |
| California: | 5.7% (845,536) |
Local government workers:
| San Diego: | 7.1% (39,505) |
| California: | 8.3% (1,218,764) |
State government workers:
| San Diego: | 4.6% (25,411) |
| California: | 4.0% (594,953) |
Federal government workers:
| San Diego: | 4.9% (27,328) |
| California: | 2.3% (344,354) |
Self-employed workers in own not incorporated business:
| San Diego: | 7.9% (43,960) |
| California: | 8.5% (1,249,530) |
Unpaid family workers:
| San Diego: | 0.3% (1,770) |
| California: | 0.4% (53,934) |

Employee of private company - Males:
| San Diego: | 69.4% (264,066) |
| California: | 70.3% (7,191,252) |
Self-employed in own incorporated business - Males:
| San Diego: | 5.2% (19,775) |
| California: | 4.9% (504,764) |
Private not-for-profit wage and salary workers - Males:
| San Diego: | 6.6% (25,215) |
| California: | 5.2% (529,122) |
Local government workers - Males:
| San Diego: | 4.2% (15,845) |
| California: | 6.0% (610,331) |
State government workers - Males:
| San Diego: | 3.9% (14,938) |
| California: | 3.4% (343,636) |
Federal government workers - Males:
| San Diego: | 4.0% (15,194) |
| California: | 2.1% (209,874) |
Self-employed workers in own not incorporated business - Males:
| San Diego: | 6.5% (24,600) |
| California: | 8.1% (824,359) |
Unpaid family workers - Males:
| San Diego: | 0.2% (904) |
| California: | 0.2% (17,922) |

Employee of private company - Females:
| San Diego: | 61.3% (204,021) |
| California: | 62.0% (5,404,778) |
Self-employed in own incorporated business - Females:
| San Diego: | 3.8% (12,661) |
| California: | 3.2% (279,945) |
Private not-for-profit wage and salary workers - Females:
| San Diego: | 12.9% (43,074) |
| California: | 10.2% (888,285) |
Local government workers - Females:
| San Diego: | 7.3% (24,355) |
| California: | 10.8% (936,725) |
State government workers - Females:
| San Diego: | 5.0% (16,764) |
| California: | 5.0% (437,279) |
Federal government workers - Females:
| San Diego: | 3.4% (11,351) |
| California: | 1.8% (159,984) |
Self-employed workers in own not incorporated business - Females:
| San Diego: | 5.9% (19,770) |
| California: | 6.7% (586,376) |
Unpaid family workers - Females:
| San Diego: | 0.2% (626) |
| California: | 0.2% (18,345) |