Frisco, TX (Texas) Houses and Residents
| Frisco: | $669,900 |
| Texas: | $275,400 |
Mean price in 2022:
Detached houses: $553,737
Here: $553,737 State: $369,058 Townhouses or other attached units: $424,244
Here: $424,244 State: $327,631 Mobile homes: $135,130
Here: $135,130 State: $124,413
Total population: 145,035 (Urban population: 31,463, Rural population: 2,038 (all nonfarm))
Houses: 79,879 (77,063 occupied: 50,599 owner occupied, 26,464 renter occupied)
| % of renters here: | 34% |
| State: | 38% |
Housing density: 1,143 houses/condos per square mile
Median price asked for vacant for-sale houses and condos in 2022: $572,992.
Median contract rent in 2022: $1,678 (lower quartile is $1,349, upper quartile is over $2,000)
Median rent asked for vacant for-rent units in 2022: $1,920
Median gross rent in Frisco, TX in 2022: $1,851
Housing units in Frisco with a mortgage: 37,562 (3,685 second mortgage, 0 home equity loan, 2,419 both second mortgage and home equity loan)
Houses without a mortgage: 774
Median household income for houses/condos with a mortgage: $200,818
Median household income for apartments without a mortgage: $141,563
Median monthly housing costs: $2,326
Compare current foreclosures in Frisco, TX:
| Photo | Address | Area | Beds / Baths | Price | Details |
|---|---|---|---|---|---|

|
#1
Avalon Dr
Frisco, TX 75035
|
2,701 sq. feet
|
2 baths 4 beds |
show details | |

|
#2
Shamrock Dr
Frisco, TX 75034
|
2,967 sq. feet
|
2 baths 4 beds |
show details | |

|
#3
Santa Rosa Dr
Frisco, TX 75033
|
1,240 sq. feet
|
1 baths 3 beds |
show details | |

|
#4
Danbridge Ln
Frisco, TX 75035
|
1,290 sq. feet
|
1 baths 3 beds |
show details | |

|
#5
Kings Ridge Rd
Frisco, TX 75035
|
1,568 sq. feet
|
2 baths 3 beds |
show details | |

|
#6
Sandy Creek Dr
Frisco, TX 75033
|
3,136 sq. feet
|
3 baths 4 beds |
show details | |

|
#7
Saint Augustine Dr
Frisco, TX 75033
|
1,995 sq. feet
|
2 baths 4 beds |
show details | |

|
#8
Wyndbrook Dr
Frisco, TX 75035
|
3,685 sq. feet
|
3 baths 5 beds |
show details | |

|
#9
Kings Ridge Rd
Frisco, TX 75035
|
2,262 sq. feet
|
2 baths 4 beds |
show details | |

|
#10
Orchard Park Dr
Frisco, TX 75034
|
4,316 sq. feet
|
4 baths 5 beds |
show details |
| Photo | Address | Area | Beds / Baths | Price | Details |
|---|---|---|---|---|---|

|
#11
Princess Ln
Frisco, TX 75034
|
3,655 sq. feet
|
2 baths 3 beds |
show details | |

|
#12
Wingfield Ln
Frisco, TX 75035
|
2,206 sq. feet
|
3 baths 4 beds |
show details | |

|
#13
Robincreek Ln
Frisco, TX 75035
|
2,140 sq. feet
|
2 baths 4 beds |
show details | |

|
#14
Fountainbridge Dr
Frisco, TX 75035
|
2,148 sq. feet
|
2 baths 3 beds |
show details | |

|
#15
Spanish Oaks
Frisco, TX 75034
|
10,046 sq. feet
|
6 baths 6 beds |
show details | |

|
#16
Brookview Dr
Frisco, TX 75034
|
2,168 sq. feet
|
2 baths 4 beds |
show details | |

|
#17
Firenze Ln
Frisco, TX 75034
|
1,670 sq. feet
|
2 baths 2 beds |
show details | |

|
#18
Baton Rouge Blvd
Frisco, TX 75035
|
1,889 sq. feet
|
2 baths 3 beds |
show details | |

|
#19
Broadhurst Dr
Frisco, TX 75033
|
3,380 sq. feet
|
3 baths 5 beds |
show details | |

|
#20
Barbarosa Dr
Frisco, TX 75035
|
2,038 sq. feet
|
2 baths 3 beds |
show details |
| Photo | Address | Area | Beds / Baths | Price | Details |
|---|---|---|---|---|---|

|
#21
Carriage Hill Ln
Frisco, TX 75035
|
4,041 sq. feet
|
4 baths 5 beds |
show details | |

|
#22
Creekmere Dr
Frisco, TX 75035
|
3,642 sq. feet
|
3 baths 4 beds |
show details | |

|
#23
Monticello Dr
Frisco, TX 75035
|
1,417 sq. feet
|
2 baths 3 beds |
show details | |

|
#24
Bay St
Frisco, TX 75035
|
1,411 sq. feet
|
2 baths 3 beds |
show details | |

|
#25
Amberdale Ln
Frisco, TX 75034
|
4,139 sq. feet
|
4 baths 5 beds |
show details | |

|
#26
Corsicana Dr
Frisco, TX 75035
|
3,439 sq. feet
|
3 baths 4 beds |
show details | |

|
#27
Bloomfield Ln
Frisco, TX 75033
|
5,050 sq. feet
|
3 baths 5 beds |
show details | |

|
#28
Prescott Dr
Frisco, TX 75033
|
2,832 sq. feet
|
3 baths 4 beds |
show details | |

|
#29
Republic Dr
Frisco, TX 75034
|
1,638 sq. feet
|
2 baths 3 beds |
show details | |

|
#30
Malibu St
Frisco, TX 75033
|
1,485 sq. feet
|
2 baths 3 beds |
show details |
| Photo | Address | Area | Beds / Baths | Price | Details |
|---|---|---|---|---|---|

|
#31
Coach House Ln
Frisco, TX 75035
|
2,775 sq. feet
|
2 baths 4 beds |
show details | |

|
#32
Continental Dr
Frisco, TX 75034
|
3,573 sq. feet
|
2 baths 4 beds |
show details | |

|
#33
Continental Dr
Frisco, TX 75034
|
3,573 sq. feet
|
2 baths 4 beds |
show details | |

|
#34
Seneca Dr
Frisco, TX 75034
|
4,779 sq. feet
|
5 baths 5 beds |
show details | |

|
#35
Talbot Dr
Frisco, TX 75033
|
4,982 sq. feet
|
3 baths 4 beds |
show details | |

|
#36
Lincoln Dr
Frisco, TX 75034
|
1,638 sq. feet
|
2 baths 3 beds |
show details | |

|
#37
Cain River Dr
Frisco, TX 75035
|
1,835 sq. feet
|
2 baths 2 beds |
show details | |

|
#38
Short St
Frisco, TX 75034
|
2,238 sq. feet
|
3 baths 3 beds |
show details | |

|
#39
Crampton Ln
Frisco, TX 75035
|
2,110 sq. feet
|
3 baths 3 beds |
show details | |

|
#40
Crampton Ln
Frisco, TX 75035
|
1,785 sq. feet
|
2 baths 3 beds |
show details |
| Photo | Address | Area | Beds / Baths | Price | Details |
|---|---|---|---|---|---|

|
#41
Veranda Ct
Frisco, TX 75035
|
3,030 sq. feet
|
3 baths 4 beds |
show details | |

|
#42
Brandywine Ln
Frisco, TX 75034
|
7,287 sq. feet
|
5 baths 5 beds |
show details | |

|
#43
Glasshouse Walk
Frisco, TX 75035
|
2,182 sq. feet
|
3 baths 3 beds |
show details | |

|
#44
Lancaster Gate
Frisco, TX 75035
|
1,713 sq. feet
|
2 baths 3 beds |
show details | |

|
#45
Migratory Ln
Frisco, TX 75033
|
2,671 sq. feet
|
2 baths 4 beds |
show details | |

|
#46
Superior Dr
Frisco, TX 75033
|
4,380 sq. feet
|
3 baths 4 beds |
show details | |

|
#47
Mackinac Dr
Frisco, TX 75033
|
3,800 sq. feet
|
3 baths 5 beds |
show details | |

|
#48
Chaucer Dr
Frisco, TX 75035
|
2,063 sq. feet
|
2 baths 3 beds |
show details | |

|
#49
Plainsman Ln
Frisco, TX 75035
|
4,309 sq. feet
|
4 baths 5 beds |
show details | |

|
Check over 1 million property listings on Foreclosure.com!
|
browse all offers | |||

Latest news about housing in Frisco, TX collected exclusively by city-data.com from local newspapers, TV, and radio stations


Median year apartment built: 2011
Household type by relationship:
Households: 219,571- Male householders: 47,042 (7,613 living alone), Female householders: 30,021 (8,387 living alone)
48,856 spouses (48,565 opposite-sex spouses), 3,537 unmarried partners, (3,388 opposite-sex unmarried partners), 74,618 children (70,928 natural, 855 adopted, 2,835 stepchildren), 1,991 grandchildren, 1,278 brothers or sisters, 5,621 parents, 0 foster children, 1,913 other relatives, 3,972 non-relatives
- In group quarters: 722
Size of family households: 17,762 2-persons, 13,981 3-persons, 16,758 4-persons, 6,776 5-persons, 1,518 6-persons, 676 7-or-more-persons.
Size of nonfamily households: 16,000 1-person, 2,917 2-persons, 407 3-persons, 56 4-persons, 212 5-persons.
52,216 married couples with children.
6,258 single-parent households (1,808 men, 4,450 women).
69.6% of residents of Frisco speak English at home.
7.0% of residents speak Spanish at home (72% speak English very well, 19% speak English well, 8% speak English not well, 1% don't speak English at all).
8.2% of residents speak other Indo-European language at home (81% speak English very well, 15% speak English well, 3% speak English not well, 1% don't speak English at all).
14.0% of residents speak Asian or Pacific Island language at home (80% speak English very well, 15% speak English well, 5% speak English not well).
1.1% of residents speak other language at home (79% speak English very well, 18% speak English well, 3% speak English not well).
Foreign born population: 54,644 (24.9%)
(54.7% of them are naturalized citizens)
| Here: | 8.4 |
| State: | 6.3 |
| Here: | 3.3 |
| State: | 4.0 |

- Bedrooms in owner-occupied houses and condos in Frisco, Texas
- 65no bedroom
- 01 bedroom
- 2,8732 bedrooms
- 9,4403 bedrooms
- 23,8774 bedrooms
- 14,3445+ bedrooms

- Bedrooms in renter-occupied apartments in Frisco, Texas
- 1,650no bedroom
- 11,1021 bedroom
- 7,5142 bedrooms
- 3,0913 bedrooms
- 2,3954 bedrooms
- 7125+ bedrooms

- Cars and other vehicles available in Frisco in owner-occupied houses/condos
- 819no vehicle
- 10,0941 vehicle
- 27,7122 vehicles
- 7,9513 vehicles
- 3,0244 vehicles
- 9995+ vehicles

- Cars and other vehicles available in Frisco in renter-occupied apartments
- 1,837no vehicle
- 13,9711 vehicle
- 8,5162 vehicles
- 1,6483 vehicles
- 3284 vehicles
- 1645+ vehicles

- Rooms in owner-occupied houses in Frisco, Texas
- 651 room
- 02 rooms
- 943 rooms
- 1,6374 rooms
- 2,8795 rooms
- 5,8556 rooms
- 8,2137 rooms
- 7,2048 rooms
- 24,6529+ rooms

- Rooms in renter-occupied apartments in Frisco, Texas
- 1,6021 room
- 5,1272 rooms
- 8,4113 rooms
- 4,0954 rooms
- 2,2375 rooms
- 1,4756 rooms
- 1,1217 rooms
- 9398 rooms
- 1,4579+ rooms


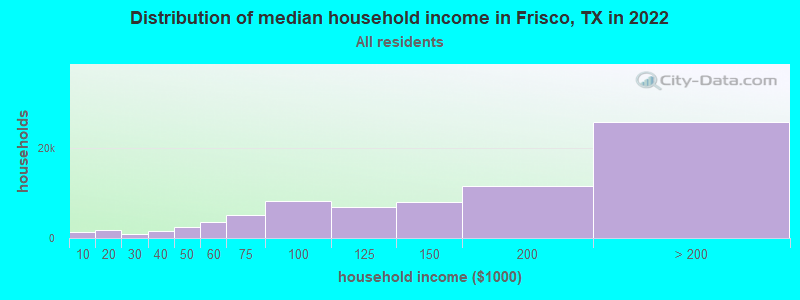
Frisco, TX household income distribution

- 1,233Less than $10,000
- 1,733$10,000 to $19,999
- 936$20,000 to $29,999
- 1,643$30,000 to $39,999
- 2,433$40,000 to $49,999
- 3,456$50,000 to $59,999
- 5,099$60,000 to $74,999
- 8,158$75,000 to $99,999
- 6,992$100,000 to $124,999
- 7,994$125,000 to $149,999
- 11,618$150,000 to $199,999
- 25,768$200,000 or more
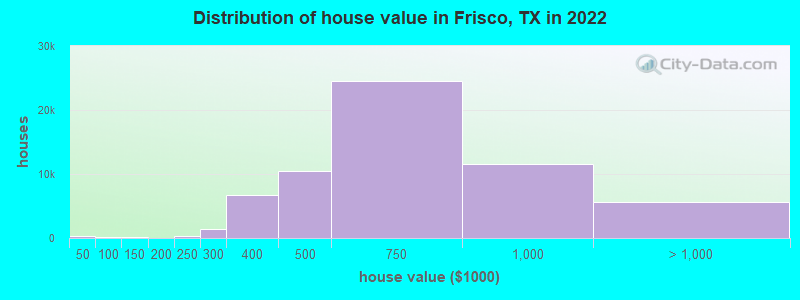
Home value of owner - occupied houses in 2022 in Frisco, TX
-
- 320Less than $10,000
- 16$10,000 to $14,999
- 3$15,000 to $19,999
- 7$30,000 to $34,999
- 27$35,000 to $39,999
- 12$50,000 to $59,999
- 77$60,000 to $69,999
- 26$80,000 to $89,999
- 19$90,000 to $99,999
- 193$100,000 to $124,999
- 21$125,000 to $149,999
- 30$150,000 to $174,999
- 27$175,000 to $199,999
- 278$200,000 to $249,999
- 1,443$250,000 to $299,999
- 6,651$300,000 to $399,999
- 10,398$400,000 to $499,999
- 24,514$500,000 to $749,999
- 11,611$750,000 to $999,999
- 4,165$1,000,000 to $1,499,999
- 623$1,500,000 to $1,999,999
- 908$2,000,000 or more
Rent paid by renters in 2022 in Frisco, TX
-
- 16Less than $100
- 12$200 to $249
- 55$500 to $549
- 11$550 to $599
- 41$600 to $649
- 29$700 to $749
- 26$750 to $799
- 85$800 to $899
- 717$900 to $999
- 3,620$1,000 to $1,249
- 5,222$1,250 to $1,499
- 6,923$1,500 to $1,999
- 4,993$2,000 to $2,499
- 1,723$2,500 to $2,999
- 1,617$3,000 to $3,499
- 559$3,500 or more
- 168No cash rent


Percentage of workers working in this county: 70.4%
Number of people working at home: 44,994 (39.2% of all workers)
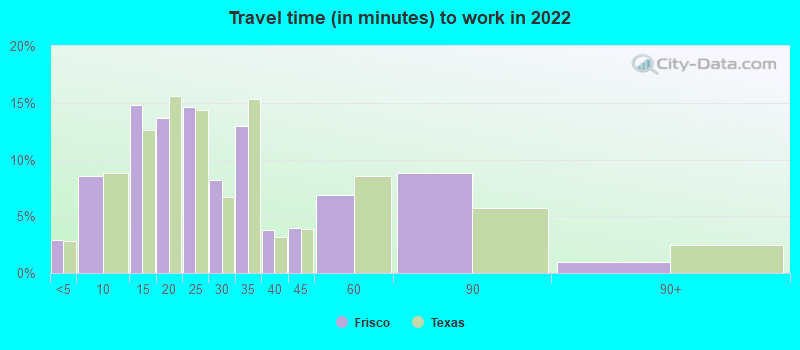
Travel time to work (commute)
- Less than 5 minutes: 1,994
- 5 to 9 minutes: 5,721
- 10 to 14 minutes: 8,631
- 15 to 19 minutes: 12,493
- 20 to 24 minutes: 6,879
- 25 to 29 minutes: 4,651
- 30 to 34 minutes: 11,019
- 35 to 39 minutes: 1,638
- 40 to 44 minutes: 5,258
- 45 to 59 minutes: 7,451
- 60 to 89 minutes: 3,281
- 90 or more minutes: 1,384
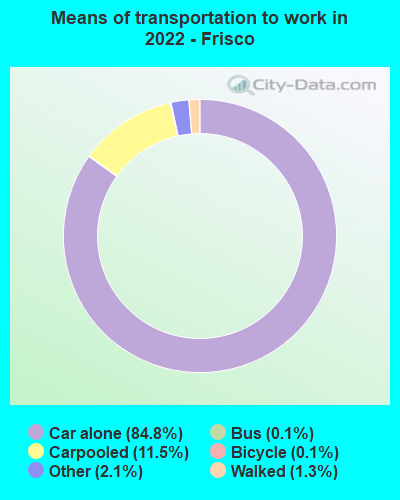
Means of transportation to work:
- Drove a car alone: 57,728 (52.5%)
- Carpooled: 8,383 (7.6%)
- Bus: 77 (0.1%)
- Long-distance train or commuter rail: 10 (0.0%)
- Light rail, streetcar or trolley: 8 (0.0%)
- Taxi: 1,481 (1.3%)
- Bicycle: 73 (0.1%)
- Walked: 1,244 (1.1%)
- Worked at home: 44,994 (40.9%)

- Unemployment by race in 2022
- Unemployment rate for White non-Hispanic residents
- 1.6%Males
- 3.6%Females
- Unemployment rate for Black residents
- 3.4%Males
- 2.4%Females
- Unemployment rate for American Indian and Alaska Native residents
- 7.6%Males
- 1.1%Females
- Unemployment rate for Asian residents
- 0.5%Males
- 3.8%Females
- Unemployment rate for other race residents
- 0.2%Males
- Unemployment rate for two or more race residents
- 6.4%Males
- 3.6%Females
- Unemployment rate for Hispanic or Latino residents
- 2.4%Males
- 3.3%Females

- Year of entry for the foreign-born population in Frisco, Texas
- 20,4942010 or later
- 15,8162000 to 2009
- 10,2931990 to 1999
- 6691980 to 1989
- 3291970 to 1979
- 221Before 1970

First ancestries reported:
- English: 8,355 (7.2%)
- American: 6,271 (5.4%)
- German: 5,955 (5.2%)
- Irish: 3,026 (2.6%)
- European: 2,707 (2.3%)
- Nigerian: 2,419 (2.1%)
- Italian: 1,924 (1.7%)
- Iranian: 1,053 (0.9%)
- Scottish: 698 (0.6%)
- Scotch-Irish: 575 (0.5%)
- Russian: 559 (0.5%)
- French: 546 (0.5%)
- Greek: 532 (0.5%)
- British: 505 (0.4%)
- Norwegian: 502 (0.4%)
- Polish: 462 (0.4%)
- Canadian: 440 (0.4%)
- Lebanese: 402 (0.3%)
- Danish: 386 (0.3%)
- African: 382 (0.3%)
- Portuguese: 331 (0.3%)
- Eastern European: 324 (0.3%)
- Ukrainian: 313 (0.3%)
- Dutch: 303 (0.3%)
- Czech: 292 (0.3%)
- Swedish: 289 (0.3%)
- Kenyan: 255 (0.2%)
- South African: 246 (0.2%)
- Welsh: 240 (0.2%)
- Brazilian: 219 (0.2%)
- Yugoslavian: 211 (0.2%)
- Jamaican: 198 (0.2%)
- Scandinavian: 190 (0.2%)
- Iraqi: 161 (0.1%)
- Jordanian: 158 (0.1%)
- Assyrian: 150 (0.1%)
- Czechoslovakian: 138 (0.1%)
- Cajun: 134 (0.1%)
- Romanian: 131 (0.1%)
- Northern European: 124 (0.1%)
- Armenian: 124 (0.1%)
- French Canadian: 111 (0.10%)
- Turkish: 100 (0.09%)
- Moroccan: 94 (0.08%)
- Lithuanian: 87 (0.08%)
- Hungarian: 81 (0.07%)
- Israeli: 75 (0.06%)
- Palestinian: 64 (0.06%)
- Haitian: 64 (0.06%)
- Egyptian: 63 (0.05%)
- Belgian: 62 (0.05%)
- Liberian: 52 (0.04%)
- Albanian: 48 (0.04%)
- Austrian: 39 (0.03%)
- Bulgarian: 35 (0.03%)
- Slovak: 34 (0.03%)
- Luxembourger: 28 (0.02%)
- Macedonian: 28 (0.02%)
- Syrian: 24 (0.02%)
- Serbian: 24 (0.02%)
- Zimbabwean: 21 (0.02%)
- Pennsylvania German: 20 (0.02%)
- Basque: 20 (0.02%)
- Finnish: 20 (0.02%)
- Australian: 19 (0.02%)
- Swiss: 18 (0.02%)
- Afghan: 14 (0.01%)
- Ethiopian: 12 (0.01%)
- Celtic: 11 (0.01%)
- West Indian: 8 (0.01%)
- Arab: 6 (0.01%)
Most common places of birth for foreign-born residents (%):
| Frisco: | 46.1% (24,413) |
| Texas: | 6.1% (306,347) |
| Frisco: | 7.5% (3,958) |
| Texas: | 48.4% (2,411,723) |
| Frisco: | 4.6% (2,452) |
| Texas: | 2.3% (115,558) |
| Frisco: | 4.4% (2,308) |
| Texas: | 1.2% (60,172) |
| Frisco: | 3.6% (1,900) |
| Texas: | 1.2% (62,159) |
| Frisco: | 2.7% (1,456) |
| Texas: | 3.7% (184,770) |
| Frisco: | 2.6% (1,395) |
| Texas: | 1.1% (55,371) |
| Frisco: | 2.6% (1,367) |
| Texas: | 1.5% (72,413) |
| Frisco: | 2.5% (1,342) |
| Texas: | 2.1% (103,148) |
| Frisco: | 2.0% (1,059) |
| Texas: | 1.9% (96,110) |
| Frisco: | 1.8% (972) |
| Texas: | 0.6% (28,963) |
| Frisco: | 1.7% (890) |
| Texas: | 0.5% (24,723) |
Place of birth for U.S.-born residents:
- This state: 75,364
- Other state: 84,289
- Northeast: 13,575
- Midwest: 23,527
- South: 26,421
- West: 20,766
86.2% of Frisco residents lived in the same house 1 years ago.
Out of people who lived in different houses, 27.5% lived in this county.
Out of people who lived in different counties, 37.0% lived in Texas.
| Frisco: | 86.2% |
| State average: | 85.7% |
Education attainment for males 25 years and older:
- No schooling: 116
- Nursery to 4th grade: 0
- 5th and 6th grade: 47
- 7th and 8th grade: 0
- 9th grade: 128
- 10th grade: 69
- 11th grade: 0
- 12th grade, no diploma: 462
- High school graduate (or equivalency): 6,708
- Less than 1 year of college: 2,087
- Some college more than 1 year, no degree: 7,042
- Associate degree: 3,620
- Bachelor's degree: 28,027
- Master's degree: 18,257
- Professional school degree: 2,362
- Doctorate degree: 1,314

Education attainment for females 25 years and older:
- No schooling: 295
- Nursery to 4th grade: 151
- 5th and 6th grade: 139
- 7th and 8th grade: 132
- 9th grade: 0
- 10th grade: 91
- 11th grade: 233
- 12th grade, no diploma: 956
- High school graduate (or equivalency): 8,731
- Less than 1 year of college: 3,471
- Some college more than 1 year, no degree: 6,450
- Associate degree: 6,756
- Bachelor's degree: 26,892
- Master's degree: 15,953
- Professional school degree: 1,673
- Doctorate degree: 847


Housing units in structures:
- One, detached: 55,300
- One, attached: 2,094
- Two: 639
- 3 or 4: 344
- 5 to 9: 1,665
- 10 to 19: 2,292
- 20 to 49: 2,093
- 50 or more: 14,803
- Mobile homes: 356
- Boats, RVs, vans, etc.: 293
Housing units lacking complete kitchen facilities in 2022: 1.5%
House/condo owner moved in on average 7 years ago
Renter moved in on average 0 years ago

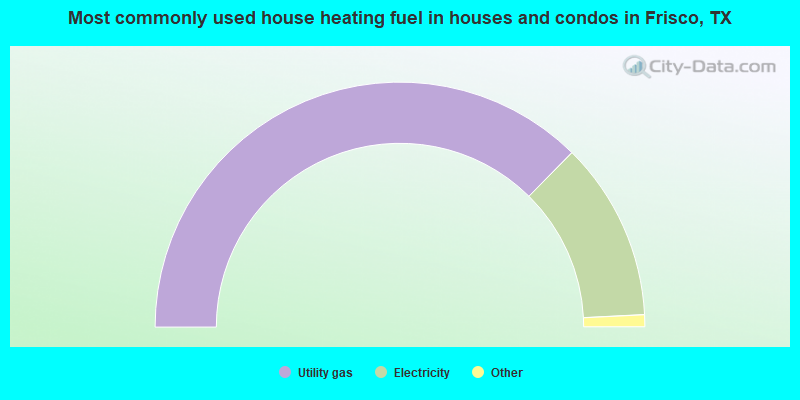
- 74.8%Utility gas
- 23.6%Electricity
- 1.2%Bottled, tank, or LP gas
- 0.2%No fuel used
- 0.2%Solar energy
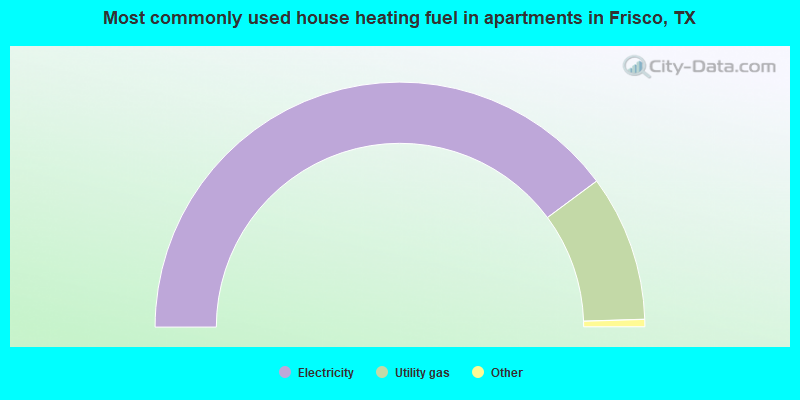
- 79.7%Electricity
- 19.3%Utility gas
- 0.5%Bottled, tank, or LP gas
- 0.3%No fuel used
- 0.2%Solar energy
Private vs. public school enrollment:
| Here: | 4.6% |
| Texas: | 8.8% |
| Here: | 10.9% |
| Texas: | 8.0% |
| Here: | 10.3% |
| Texas: | 16.2% |


