Work and Jobs in Frisco, Texas (TX) Detailed Stats
Occupations, Industries, Unemployment, Workers, Commute
Settings
X


Recent posts about work in Frisco, Texas on our local forum with over 2,400,000 registered users:

Latest news about work in Frisco, TX collected exclusively by city-data.com from local newspapers, TV, and radio stations
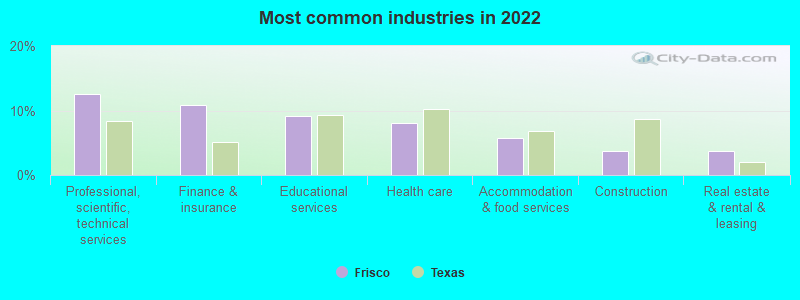
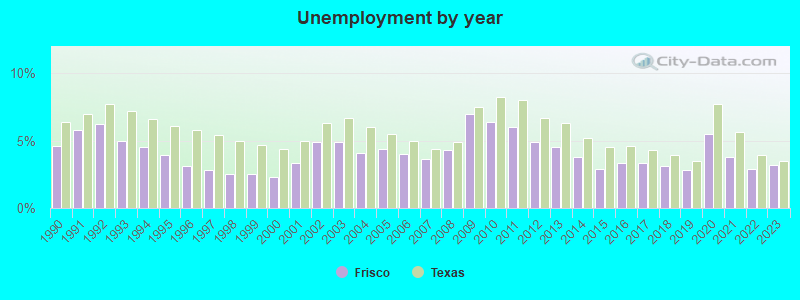
The unemployment rate in 2023 in Frisco, TX was 3.2%, which was 9.4% less than the unemployment rate of 3.5% across the entire state of Texas. Compared to the unemployment rate of 4.5% in 2013, this represents a decrease of 40.6%. According to 2022 data, the most common industries in Frisco are: Professional, scientific, technical services (12.6% of civilian employees), Finance & insurance (10.8% of civilian employees), Educational services (9.1% of civilian employees). 70.4% of workers work in Collin County and 29.5% of all workers work at home. 79.1% of workers are employees of private companies, which is 12.1% greater than the rate of 69.6% across the entire state of Texas.
Whole page based on the data from 2000 / 2022 when the population of Frisco, Texas was 33,714 / 219,571
Whole page based on the data from 2000 / 2022 when the population of Frisco, Texas was 33,714 / 219,571
Most common industries


Most common industries | Most common industries | |||||
|---|---|---|---|---|---|---|
Industry | All | Males | Females | All | Males | Females |
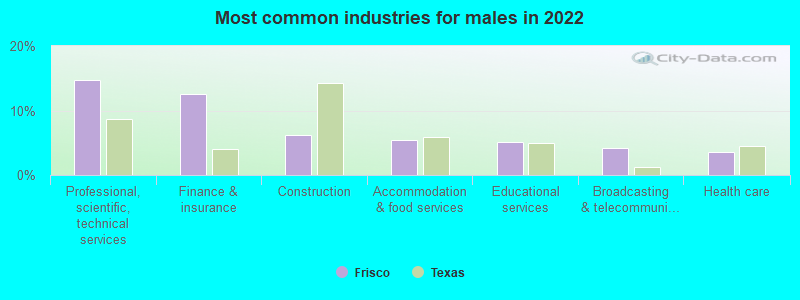
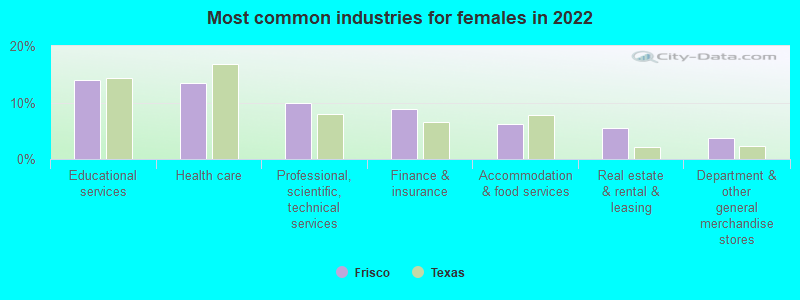
| Professional, scientific, and technical services | 12.6% (9,778) | 14.8% (6,204) | 10.0% (3,574) | 13.7% (2,502) | 15.8% (1,613) | 11.0% (889) |
| Finance and insurance | 10.8% (8,398) | 12.5% (5,259) | 8.8% (3,139) | 9.2% (1,686) | 9.0% (917) | 9.5% (769) |
| Educational services | 9.1% (7,109) | 5.1% (2,124) | 13.9% (4,985) | 7.3% (1,328) | 2.2% (227) | 13.6% (1,101) |
| Health care | 8.1% (6,302) | 3.6% (1,500) | 13.4% (4,802) | 5.2% (944) | 2.9% (293) | 8.0% (651) |
| Accommodation and food services | 5.8% (4,511) | 5.4% (2,270) | 6.3% (2,241) | 3.7% (678) | 4.0% (410) | 3.3% (268) |
| Construction | 3.8% (2,944) | 6.2% (2,594) | 1.0% (350) | 5.8% (1,060) | 8.5% (868) | 2.4% (192) |
| Real estate and rental and leasing | 3.7% (2,882) | 2.2% (936) | 5.4% (1,946) | 2.6% (483) | 1.5% (148) | 4.1% (335) |
| Administrative and support and waste management services | 3.4% (2,650) | 3.5% (1,476) | 3.3% (1,174) | 2.6% (474) | 2.3% (231) | 3.0% (243) |
| Broadcasting and telecommunications | 3.2% (2,480) | 4.2% (1,744) | 2.1% (736) | 4.8% (873) | 6.2% (634) | 3.0% (239) |
| Department and other general merchandise stores | 2.8% (2,186) | 2.0% (832) | 3.8% (1,354) | 3.7% (673) | 2.9% (293) | 4.7% (380) |
| Computer and electronic products | 2.6% (2,061) | 3.4% (1,438) | 1.7% (623) | 3.9% (722) | 5.6% (573) | 1.8% (149) |
| Public administration | 1.9% (1,457) | 2.2% (913) | 1.5% (544) | 1.9% (348) | 2.3% (232) | 1.4% (116) |
| Arts, entertainment, and recreation | 1.6% (1,259) | 1.6% (677) | 1.6% (582) | 1.4% (251) | 1.7% (173) | 1.0% (78) |
| Air transportation | 1.5% (1,169) | 1.8% (740) | 1.2% (429) | 1.7% (303) | 1.8% (179) | 1.5% (124) |
| Furniture and home furnishings, and household appliance stores | 1.4% (1,119) | 0.9% (371) | 2.1% (748) | 0.5% (88) | 0.5% (53) | 0.4% (35) |
| Personal and laundry services | 1.4% (1,118) | 0.6% (247) | 2.4% (871) | 1.1% (206) | 0.8% (85) | 1.5% (121) |
| Radio, TV, and computer stores | 1.4% (1,112) | 1.9% (782) | 0.9% (330) | 1.6% (295) | 1.5% (149) | 1.8% (146) |
| Miscellaneous manufacturing | 1.3% (992) | 2.0% (847) | 0.4% (145) | 0.7% (125) | 0.8% (82) | 0.5% (43) |
| Motor vehicle and parts dealers | 1.2% (953) | 2.1% (885) | 0.2% (68) | 1.0% (174) | 1.4% (144) | 0.4% (30) |
| Religious, grantmaking, civic, professional, and similar organizations | 1.2% (914) | 0.7% (305) | 1.7% (609) | 0.9% (171) | 0.5% (52) | 1.5% (119) |
| Social assistance | 1.2% (913) | 0.1% (57) | 2.4% (856) | 1.9% (342) | 0.3% (32) | 3.8% (310) |
| Food and beverage stores | 1.2% (909) | 1.7% (696) | 0.6% (213) | 1.5% (271) | 1.1% (109) | 2.0% (162) |
| Other transportation, and support activities, and couriers | 1.1% (894) | 1.4% (596) | 0.8% (298) | 0.8% (148) | 1.0% (98) | 0.6% (50) |
| Other direct selling establishments | 0.9% (716) | 1.2% (520) | 0.5% (196) | 0.6% (103) | 0.5% (52) | 0.6% (51) |
| Clothing and accessories, including shoe, stores | 0.8% (657) | 0.3% (123) | 1.5% (534) | 0.6% (109) | 0.4% (45) | 0.8% (64) |
| Private households | 0.8% (639) | 0.4% (187) | 1.3% (452) | 0.2% (34) | 0.0% (0) | 0.4% (34) |
| Publishing, and motion picture and sound recording industries | 0.8% (639) | 1.3% (562) | 0.2% (77) | 0.8% (138) | 0.6% (59) | 1.0% (79) |
| Chemicals | 0.8% (634) | 1.0% (420) | 0.6% (214) | 0.8% (144) | 1.2% (124) | 0.2% (20) |
| Professional and commercial equipment and supplies merchant wholesalers | 0.7% (569) | 1.1% (453) | 0.3% (116) | 0.9% (172) | 1.0% (100) | 0.9% (72) |
| Beverage and tobacco products | 0.7% (562) | 0.6% (258) | 0.8% (304) | 0.7% (137) | 0.4% (42) | 1.2% (95) |
| Repair and maintenance | 0.7% (553) | 1.2% (497) | 0.2% (56) | 0.8% (139) | 1.1% (109) | 0.4% (30) |
| Used merchandise, gift, novelty, and souvenir, and other miscellaneous stores | 0.7% (549) | 0.4% (167) | 1.1% (382) | 0.5% (88) | 0.5% (49) | 0.5% (39) |
| Drugs, sundries, and chemical and allied products merchant wholesalers | 0.7% (545) | 0.5% (196) | 1.0% (349) | 0.2% (38) | 0.3% (29) | 0.1% (9) |
| Mining, quarrying, and oil and gas extraction | 0.7% (544) | 0.8% (340) | 0.6% (204) | 0.6% (103) | 0.8% (85) | 0.2% (18) |
| Transportation equipment | 0.6% (484) | 1.0% (436) | 0.1% (48) | 0.7% (133) | 1.2% (118) | 0.2% (15) |
| Food | 0.6% (450) | 0.8% (327) | 0.3% (123) | 0.9% (164) | 0.9% (93) | 0.9% (71) |
| Truck transportation | 0.6% (448) | 1.1% (448) | 0.0% (0) | 0.5% (89) | 0.5% (47) | 0.5% (42) |
| Groceries and related products merchant wholesalers | 0.5% (426) | 0.7% (273) | 0.4% (153) | 1.0% (189) | 1.0% (105) | 1.0% (84) |
| Pharmacies and drug stores | 0.5% (408) | 0.5% (222) | 0.5% (186) | 0.5% (92) | 0.2% (17) | 0.9% (75) |
| Health and personal care, except drug, stores | 0.4% (344) | 0.6% (232) | 0.3% (112) | 0.2% (40) | 0.2% (17) | 0.3% (23) |
| Building material and garden equipment and supplies dealers | 0.4% (280) | 0.4% (159) | 0.3% (121) | 0.6% (101) | 0.6% (57) | 0.5% (44) |
| Machinery | 0.3% (270) | 0.5% (196) | 0.2% (74) | 0.9% (159) | 1.0% (101) | 0.7% (58) |
| Agriculture, forestry, fishing and hunting | 0.3% (214) | 0.5% (214) | 0.0% (0) | 0.5% (89) | 0.5% (55) | 0.4% (34) |
| Electronic shopping and mail-order houses | 0.3% (211) | 0.4% (160) | 0.1% (51) | 0.4% (81) | 0.5% (55) | 0.3% (26) |
| Machinery, equipment, and supplies merchant wholesalers | 0.3% (205) | 0.2% (86) | 0.3% (119) | 0.3% (52) | 0.4% (39) | 0.2% (13) |
| Utilities | 0.3% (205) | 0.3% (141) | 0.2% (64) | 0.4% (76) | 0.5% (54) | 0.3% (22) |
| Printing and related support activities | 0.3% (199) | 0.1% (51) | 0.4% (148) | 0.7% (127) | 1.0% (99) | 0.3% (28) |
| Furniture and related product manufacturing | 0.2% (192) | 0.2% (92) | 0.3% (100) | 0.2% (42) | 0.2% (19) | 0.3% (23) |
| Data processing, libraries, and other information services | 0.2% (176) | 0.4% (148) | 0.1% (28) | 2.1% (383) | 2.5% (257) | 1.6% (126) |
| Petroleum and coal products | 0.2% (151) | 0.1% (46) | 0.3% (105) | 0.1% (19) | 0.2% (19) | 0.0% (0) |
| Paper | 0.2% (149) | 0.2% (69) | 0.2% (80) | 0.2% (39) | 0.3% (28) | 0.1% (11) |
| Electrical equipment, appliances, and components | 0.2% (134) | 0.2% (87) | 0.1% (47) | 0.3% (64) | 0.4% (37) | 0.3% (27) |
| Miscellaneous nondurable goods merchant wholesalers | 0.2% (134) | 0.3% (109) | 0.1% (25) | 0.2% (36) | 0.2% (19) | 0.2% (17) |
| U. S. Postal service | 0.2% (130) | 0.1% (61) | 0.2% (69) | 0.4% (65) | 0.4% (39) | 0.3% (26) |
| Management of companies and enterprises | 0.2% (123) | 0.2% (68) | 0.2% (55) | 0.3% (58) | 0.2% (18) | 0.5% (40) |
| Furniture and home furnishing merchant wholesalers | 0.2% (121) | 0.1% (31) | 0.3% (90) | 0.0% (8) | 0.1% (6) | 0.0% (2) |
| Metal and metal products | 0.1% (114) | 0.3% (114) | 0.0% (0) | 0.6% (113) | 0.9% (87) | 0.3% (26) |
| Sporting goods, camera, and hobby and toy stores | 0.1% (110) | 0.2% (83) | 0.1% (27) | 0.2% (33) | 0.2% (23) | 0.1% (10) |
| Office supplies and stationery stores | 0.1% (100) | 0.1% (53) | 0.1% (47) | 0.2% (30) | 0.2% (22) | 0.1% (8) |
| Nonmetallic mineral products | 0.1% (93) | 0.1% (24) | 0.2% (69) | 0.2% (31) | 0.2% (23) | 0.1% (8) |
| Apparel | 0.1% (92) | 0.2% (92) | 0.0% (0) | 0.1% (10) | 0.0% (0) | 0.1% (10) |
| Electrical and electronic goods merchant wholesalers | 0.1% (86) | 0.2% (86) | 0.0% (0) | 0.8% (144) | 1.1% (113) | 0.4% (31) |
| Plastics and rubber products | 0.1% (85) | 0.1% (60) | 0.1% (25) | 0.4% (76) | 0.3% (35) | 0.5% (41) |
| Apparel, fabrics, and notions merchant wholesalers | 0.1% (84) | 0.1% (33) | 0.1% (51) | 0.2% (33) | 0.2% (25) | 0.1% (8) |
| Motor vehicles, parts and supplies merchant wholesalers | 0.1% (83) | 0.1% (47) | 0.1% (36) | 0.3% (55) | 0.4% (40) | 0.2% (15) |
| Petroleum and petroleum products merchant wholesalers | 0.1% (72) | 0.2% (72) | 0.0% (0) | 0.2% (29) | 0.2% (18) | 0.1% (11) |
| Gasoline stations | 0.1% (61) | 0.1% (50) | 0.0% (11) | 0.1% (10) | 0.1% (6) | 0.0% (4) |
| Jewelry, luggage, and leather goods stores | 0.1% (59) | 0.1% (59) | 0.0% (0) | 0.1% (18) | 0.1% (8) | 0.1% (10) |
| Warehousing and storage | 0.1% (51) | 0.1% (51) | 0.0% (0) | 0.0% (0) | 0.0% (0) | 0.0% (0) |
| Alcoholic beverages merchant wholesalers | 0.1% (50) | 0.1% (50) | 0.0% (0) | 0.1% (19) | 0.2% (19) | 0.0% (0) |
| Paper and paper products merchant wholesalers | 0.1% (45) | 0.0% (16) | 0.1% (29) | 0.1% (16) | 0.2% (16) | 0.0% (0) |
| Wood products | 0.0% (37) | 0.1% (25) | 0.0% (12) | 0.2% (32) | 0.3% (26) | 0.1% (6) |
| Miscellaneous durable goods merchant wholesalers | 0.0% (28) | 0.1% (28) | 0.0% (0) | 0.2% (35) | 0.1% (14) | 0.3% (21) |
| Music stores | 0.0% (20) | 0.0% (20) | 0.0% (0) | 0.1% (19) | 0.2% (19) | 0.0% (0) |
| Lumber and other construction materials merchant wholesalers | 0.0% (12) | 0.0% (12) | 0.0% (0) | 0.1% (17) | 0.1% (15) | 0.0% (2) |
| Textile mills and textile products | 0.0% (0) | 0.0% (0) | 0.0% (0) | 0.1% (11) | 0.1% (11) | 0.0% (0) |
| Hardware, plumbing and heating equipment, and supplies merchant wholesalers | 0.0% (0) | 0.0% (0) | 0.0% (0) | 0.4% (65) | 0.6% (65) | 0.0% (0) |
Unemployment in Frisco
- Unemployment by race in 2022
- Unemployment rate for White non-Hispanic residents
- 1.6%Males
- 3.6%Females
- Unemployment rate for Black residents
- 3.4%Males
- 2.4%Females
- Unemployment rate for American Indian and Alaska Native residents
- 7.6%Males
- 1.1%Females
- Unemployment rate for Asian residents
- 0.5%Males
- 3.8%Females
- Unemployment rate for other race residents
- 0.2%Males
- Unemployment rate for two or more race residents
- 6.4%Males
- 3.6%Females
- Unemployment rate for Hispanic or Latino residents
- 2.4%Males
- 3.3%Females
- Unemployment by race in 2000
- Unemployment rate for White non-Hispanic residents
- 1.8%Males
- 2.6%Females
- Unemployment rate for Black residents
- 8.3%Males
- 1.9%Females
- Unemployment rate for Asian residents
- 4.5%Females
- Unemployment rate for other race residents
- 0.5%Males
- 2.8%Females
- Unemployment rate for two or more race residents
- 2.6%Males
- 4.5%Females
- Unemployment rate for Hispanic or Latino residents
- 1.3%Males
- 4.0%Females
Unemployment in 2023:
| Frisco: | 3.2% |
| Texas: | 3.5% |
Unemployment in 2022:
| Frisco: | 2.9% |
| Texas: | 3.9% |
Unemployment in 2021:
| Frisco: | 3.8% |
| Texas: | 5.6% |
Unemployment in 2020:
| Frisco: | 5.5% |
| Texas: | 7.7% |
Unemployment in 2019:
| Frisco: | 2.8% |
| Texas: | 3.5% |
Unemployment in 2018:
| Frisco: | 3.1% |
| Texas: | 3.9% |
Unemployment in 2017:
| Frisco: | 3.3% |
| Texas: | 4.3% |
Unemployment in 2016:
| Frisco: | 3.3% |
| Texas: | 4.6% |
Unemployment in 2015:
| Frisco: | 2.9% |
| Texas: | 4.5% |
Unemployment in 2014:
| Frisco: | 3.8% |
| Texas: | 5.2% |
Unemployment in 2013:
| Frisco: | 4.5% |
| Texas: | 6.3% |
Unemployment in 2012:
| Frisco: | 4.9% |
| Texas: | 6.7% |
Unemployment in 2011:
| Frisco: | 6.0% |
| Texas: | 8.0% |
Unemployment in 2010:
| Frisco: | 6.4% |
| Texas: | 8.2% |
Unemployment in 2009:
| Frisco: | 7.0% |
| Texas: | 7.5% |
Unemployment in 2008:
| Frisco: | 4.3% |
| Texas: | 4.9% |
Unemployment in 2007:
| Frisco: | 3.6% |
| Texas: | 4.4% |
Unemployment in 2006:
| Frisco: | 4.0% |
| Texas: | 5.0% |
Unemployment in 2005:
| Frisco: | 4.4% |
| Texas: | 5.5% |
Unemployment in 2004:
| Frisco: | 4.1% |
| Texas: | 6.0% |
Unemployment in 2003:
| Frisco: | 4.9% |
| Texas: | 6.7% |
Unemployment in 2002:
| Frisco: | 4.9% |
| Texas: | 6.3% |
Unemployment in 2001:
| Frisco: | 3.3% |
| Texas: | 5.0% |
Unemployment in 2000:
| Frisco: | 2.3% |
| Texas: | 4.4% |
Unemployment in 1999:
| Frisco: | 2.5% |
| Texas: | 4.7% |
Unemployment in 1998:
| Frisco: | 2.5% |
| Texas: | 5.0% |
Unemployment in 1997:
| Frisco: | 2.8% |
| Texas: | 5.4% |
Unemployment in 1996:
| Frisco: | 3.1% |
| Texas: | 5.8% |
Unemployment in 1995:
| Frisco: | 3.9% |
| Texas: | 6.1% |
Unemployment in 1994:
| Frisco: | 4.5% |
| Texas: | 6.6% |
Unemployment in 1993:
| Frisco: | 5.0% |
| Texas: | 7.2% |
Unemployment in 1992:
| Frisco: | 6.2% |
| Texas: | 7.7% |
Unemployment in 1991:
| Frisco: | 5.8% |
| Texas: | 7.0% |
Unemployment in 1990:
| Frisco: | 4.6% |
| Texas: | 6.4% |
Time leaving home to go to work

12:00 a.m. to 4:59 a.m.:
| Frisco: | 2.0% (1,381) |
| Texas: | 5.5% (678,264) |
5:00 a.m. to 5:29 a.m.:
| Frisco: | 0.4% (316) |
| Texas: | 4.3% (525,841) |
5:30 a.m. to 5:59 a.m.:
| Frisco: | 2.3% (1,634) |
| Texas: | 4.9% (603,953) |
6:00 a.m. to 6:29 a.m.:
| Frisco: | 6.0% (4,229) |
| Texas: | 9.4% (1,155,020) |
6:30 a.m. to 6:59 a.m.:
| Frisco: | 8.1% (5,669) |
| Texas: | 9.3% (1,152,822) |
7:00 a.m. to 7:29 a.m.:
| Frisco: | 14.8% (10,406) |
| Texas: | 15.3% (1,885,477) |
7:30 a.m. to 7:59 a.m.:
| Frisco: | 12.8% (9,014) |
| Texas: | 11.9% (1,469,628) |
8:00 a.m. to 8:29 a.m.:
| Frisco: | 17.5% (12,347) |
| Texas: | 11.3% (1,400,175) |
8:30 a.m. to 8:59 a.m.:
| Frisco: | 4.8% (3,355) |
| Texas: | 4.9% (599,574) |
9:00 a.m. to 9:59 a.m.:
| Frisco: | 11.5% (8,070) |
| Texas: | 6.7% (829,367) |
10:00 a.m. to 10:59 a.m.:
| Frisco: | 2.9% (2,075) |
| Texas: | 3.2% (390,354) |
11:00 a.m. to 11:59 a.m.:
| Frisco: | 1.4% (1,020) |
| Texas: | 1.3% (162,330) |
12:00 p.m. to 3:59 p.m.:
| Frisco: | 6.3% (4,431) |
| Texas: | 5.8% (720,594) |
4:00 p.m. to 11:59 p.m.:
| Frisco: | 9.2% (6,453) |
| Texas: | 6.3% (777,072) |

<5am:
| Frisco: | 1.4% (251) |
| Texas: | 3.1% (281,361) |
5:30am:
| Frisco: | 1.2% (222) |
| Texas: | 2.9% (262,060) |
6am:
| Frisco: | 3.3% (591) |
| Texas: | 4.4% (403,423) |
6:30am:
| Frisco: | 9.7% (1,757) |
| Texas: | 8.8% (808,876) |
7am:
| Frisco: | 14.3% (2,581) |
| Texas: | 10.7% (976,557) |
7:30am:
| Frisco: | 19.8% (3,579) |
| Texas: | 16.4% (1,500,904) |
8am:
| Frisco: | 16.3% (2,937) |
| Texas: | 16.8% (1,536,308) |
8:30am:
| Frisco: | 12.5% (2,258) |
| Texas: | 10.0% (913,601) |
9am:
| Frisco: | 5.4% (978) |
| Texas: | 4.4% (398,656) |
10am:
| Frisco: | 4.8% (859) |
| Texas: | 5.2% (472,592) |
11am:
| Frisco: | 1.2% (213) |
| Texas: | 2.2% (197,844) |
12pm:
| Frisco: | 0.5% (86) |
| Texas: | 0.9% (86,997) |
4pm:
| Frisco: | 2.6% (471) |
| Texas: | 5.5% (503,565) |
>4pm:
| Frisco: | 2.8% (503) |
| Texas: | 6.1% (563,107) |

12:00 a.m. to 4:59 a.m. - Males:
| Frisco: | 3.2% (1,230) |
| Texas: | 7.0% (477,284) |
5:30 a.m. to 5:59 a.m. - Males:
| Frisco: | 2.3% (902) |
| Texas: | 5.9% (402,788) |
6:00 a.m. to 6:29 a.m. - Males:
| Frisco: | 8.2% (3,189) |
| Texas: | 10.9% (751,118) |
6:30 a.m. to 6:59 a.m. - Males:
| Frisco: | 8.8% (3,451) |
| Texas: | 9.5% (652,306) |
7:00 a.m. to 7:29 a.m. - Males:
| Frisco: | 15.0% (5,871) |
| Texas: | 14.1% (970,598) |
7:30 a.m. to 7:59 a.m. - Males:
| Frisco: | 13.5% (5,279) |
| Texas: | 10.2% (696,429) |
8:00 a.m. to 8:29 a.m. - Males:
| Frisco: | 15.5% (6,058) |
| Texas: | 10.6% (729,041) |
8:30 a.m. to 8:59 a.m. - Males:
| Frisco: | 4.8% (1,866) |
| Texas: | 4.1% (281,762) |
9:00 a.m. to 9:59 a.m. - Males:
| Frisco: | 11.5% (4,486) |
| Texas: | 5.8% (401,071) |
10:00 a.m. to 10:59 a.m. - Males:
| Frisco: | 1.9% (731) |
| Texas: | 2.7% (186,469) |
11:00 a.m. to 11:59 a.m. - Males:
| Frisco: | 2.4% (953) |
| Texas: | 1.2% (82,242) |
12:00 p.m. to 3:59 p.m. - Males:
| Frisco: | 4.5% (1,748) |
| Texas: | 5.8% (397,795) |
4:00 p.m. to 11:59 p.m. - Males:
| Frisco: | 8.4% (3,277) |
| Texas: | 6.4% (435,950) |

12:00 a.m. to 4:59 a.m. - Females:
| Frisco: | 0.5% (151) |
| Texas: | 3.7% (200,980) |
5:00 a.m. to 5:29 a.m. - Females:
| Frisco: | 1.0% (316) |
| Texas: | 2.4% (130,965) |
5:30 a.m. to 5:59 a.m. - Females:
| Frisco: | 2.3% (732) |
| Texas: | 3.7% (201,165) |
6:00 a.m. to 6:29 a.m. - Females:
| Frisco: | 3.3% (1,040) |
| Texas: | 7.4% (403,902) |
6:30 a.m. to 6:59 a.m. - Females:
| Frisco: | 7.1% (2,218) |
| Texas: | 9.1% (500,516) |
7:00 a.m. to 7:29 a.m. - Females:
| Frisco: | 14.5% (4,535) |
| Texas: | 16.7% (914,879) |
7:30 a.m. to 7:59 a.m. - Females:
| Frisco: | 11.9% (3,735) |
| Texas: | 14.1% (773,199) |
8:00 a.m. to 8:29 a.m. - Females:
| Frisco: | 20.1% (6,289) |
| Texas: | 12.2% (671,134) |
8:30 a.m. to 8:59 a.m. - Females:
| Frisco: | 4.7% (1,489) |
| Texas: | 5.8% (317,812) |
9:00 a.m. to 9:59 a.m. - Females:
| Frisco: | 11.4% (3,584) |
| Texas: | 7.8% (428,296) |
10:00 a.m. to 10:59 a.m. - Females:
| Frisco: | 4.3% (1,344) |
| Texas: | 3.7% (203,885) |
11:00 a.m. to 11:59 a.m. - Females:
| Frisco: | 0.2% (67) |
| Texas: | 1.5% (80,088) |
12:00 p.m. to 3:59 p.m. - Females:
| Frisco: | 8.6% (2,683) |
| Texas: | 5.9% (322,799) |
4:00 p.m. to 11:59 p.m. - Females:
| Frisco: | 10.1% (3,176) |
| Texas: | 6.2% (341,122) |
Travel time to work
Percentage of workers working in this county: 70.4%
Number of people working at home: 33,913 (29.5% of all workers)
Daytime population change due to commuting: -9,076 (-26.9%)
Workers who live and work in this city: 3,284 (18.2%)
Number of people working at home: 33,913 (29.5% of all workers)
Daytime population change due to commuting: -9,076 (-26.9%)
Workers who live and work in this city: 3,284 (18.2%)

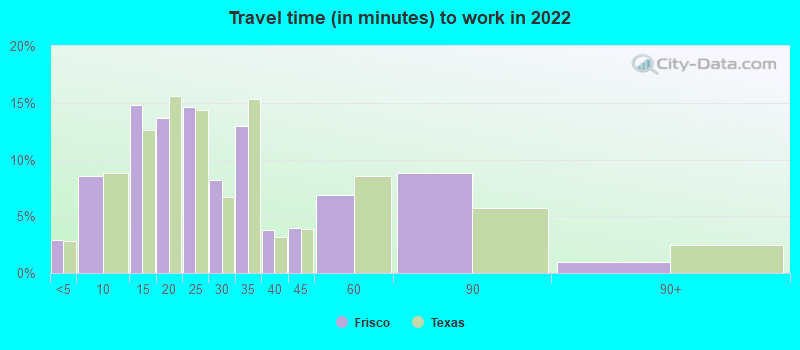

Less than 5 minutes:
| Frisco: | 2.9% (2,178) |
| Texas: | 2.8% (350,462) |
5 to 9 minutes:
| Frisco: | 8.5% (6,406) |
| Texas: | 8.8% (1,087,762) |
10 to 14 minutes:
| Frisco: | 14.8% (11,126) |
| Texas: | 12.6% (1,550,271) |
15 to 19 minutes:
| Frisco: | 13.6% (10,240) |
| Texas: | 15.6% (1,918,353) |
20 to 24 minutes:
| Frisco: | 14.6% (10,986) |
| Texas: | 14.4% (1,772,079) |
25 to 29 minutes:
| Frisco: | 8.2% (6,178) |
| Texas: | 6.7% (827,833) |
30 to 34 minutes:
| Frisco: | 13.0% (9,761) |
| Texas: | 15.3% (1,887,878) |
35 to 39 minutes:
| Frisco: | 3.8% (2,838) |
| Texas: | 3.2% (394,170) |
40 to 44 minutes:
| Frisco: | 4.0% (2,989) |
| Texas: | 3.9% (476,118) |
45 to 59 minutes:
| Frisco: | 6.8% (5,137) |
| Texas: | 8.6% (1,058,376) |
60 to 89 minutes:
| Frisco: | 8.8% (6,610) |
| Texas: | 5.7% (706,002) |
90 or more minutes:
| Frisco: | 0.9% (705) |
| Texas: | 2.4% (299,884) |


Less than 5 minutes:
| Frisco: | 1.6% (297) |
| Texas: | 3.0% (277,642) |
5 to 9 minutes:
| Frisco: | 6.1% (1,100) |
| Texas: | 10.3% (942,891) |
10 to 14 minutes:
| Frisco: | 8.3% (1,493) |
| Texas: | 14.4% (1,317,555) |
15 to 19 minutes:
| Frisco: | 10.4% (1,885) |
| Texas: | 16.0% (1,467,945) |
20 to 24 minutes:
| Frisco: | 11.0% (1,986) |
| Texas: | 13.9% (1,276,781) |
25 to 29 minutes:
| Frisco: | 5.2% (934) |
| Texas: | 5.3% (482,838) |
30 to 34 minutes:
| Frisco: | 15.7% (2,842) |
| Texas: | 14.3% (1,309,699) |
35 to 39 minutes:
| Frisco: | 5.7% (1,037) |
| Texas: | 2.4% (219,873) |
40 to 44 minutes:
| Frisco: | 6.1% (1,110) |
| Texas: | 3.1% (280,916) |
45 to 59 minutes:
| Frisco: | 16.9% (3,058) |
| Texas: | 7.6% (692,006) |
60 to 89 minutes:
| Frisco: | 7.3% (1,313) |
| Texas: | 4.6% (418,905) |
90 or more minutes:
| Frisco: | 1.3% (231) |
| Texas: | 2.4% (218,800) |

Less than 5 minutes - Males:
| Frisco: | 3.0% (1,078) |
| Texas: | 2.7% (181,937) |
5 to 9 minutes - Males:
| Frisco: | 9.2% (3,280) |
| Texas: | 7.6% (522,166) |
10 to 14 minutes - Males:
| Frisco: | 14.3% (5,116) |
| Texas: | 11.5% (785,572) |
15 to 19 minutes - Males:
| Frisco: | 10.1% (3,609) |
| Texas: | 14.6% (1,001,179) |
20 to 24 minutes - Males:
| Frisco: | 15.4% (5,481) |
| Texas: | 13.9% (950,043) |
25 to 29 minutes - Males:
| Frisco: | 6.9% (2,463) |
| Texas: | 6.7% (457,259) |
30 to 34 minutes - Males:
| Frisco: | 10.3% (3,685) |
| Texas: | 16.2% (1,110,357) |
35 to 39 minutes - Males:
| Frisco: | 4.3% (1,538) |
| Texas: | 3.3% (223,512) |
40 to 44 minutes - Males:
| Frisco: | 3.9% (1,384) |
| Texas: | 4.2% (289,434) |
45 to 59 minutes - Males:
| Frisco: | 9.3% (3,321) |
| Texas: | 9.3% (639,122) |
60 to 89 minutes - Males:
| Frisco: | 11.8% (4,210) |
| Texas: | 6.8% (467,154) |
90 or more minutes - Males:
| Frisco: | 1.5% (520) |
| Texas: | 3.1% (211,313) |

Less than 5 minutes - Females:
| Frisco: | 2.8% (1,100) |
| Texas: | 3.1% (168,525) |
5 to 9 minutes - Females:
| Frisco: | 7.9% (3,126) |
| Texas: | 10.3% (565,596) |
10 to 14 minutes - Females:
| Frisco: | 15.2% (6,010) |
| Texas: | 13.9% (764,699) |
15 to 19 minutes - Females:
| Frisco: | 16.8% (6,631) |
| Texas: | 16.7% (917,174) |
20 to 24 minutes - Females:
| Frisco: | 13.9% (5,505) |
| Texas: | 15.0% (822,036) |
25 to 29 minutes - Females:
| Frisco: | 9.4% (3,715) |
| Texas: | 6.7% (370,574) |
30 to 34 minutes - Females:
| Frisco: | 15.4% (6,076) |
| Texas: | 14.2% (777,521) |
35 to 39 minutes - Females:
| Frisco: | 3.3% (1,300) |
| Texas: | 3.1% (170,658) |
40 to 44 minutes - Females:
| Frisco: | 4.1% (1,605) |
| Texas: | 3.4% (186,684) |
45 to 59 minutes - Females:
| Frisco: | 4.6% (1,816) |
| Texas: | 7.6% (419,254) |
60 to 89 minutes - Females:
| Frisco: | 6.1% (2,400) |
| Texas: | 4.4% (238,848) |
90 or more minutes - Females:
| Frisco: | 0.5% (185) |
| Texas: | 1.6% (88,571) |
Means of transportation to work
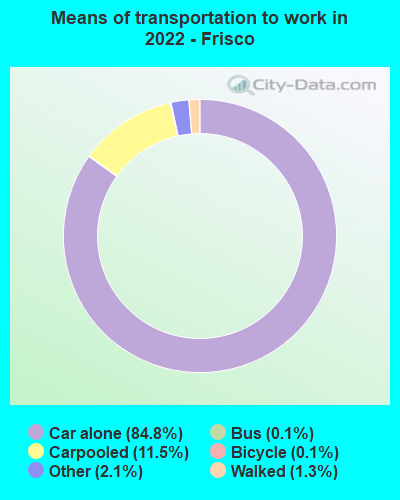

Drove car alone:
| Frisco: | 84.8% (65,177) |
| Texas: | 83.3% (4,557,023) |
Carpooled:
| Frisco: | 11.5% (8,838) |
| Texas: | 11.7% (674,818) |
Bus:
| Frisco: | 0.1% (83) |
| Texas: | 0.9% (50,435) |
Long-distance train or commuter rail:
| Frisco: | 0.0% (11) |
| Texas: | 0.0% (551) |
Light rail, streetcar or trolley:
| Frisco: | 0.0% (9) |
| Texas: | 0.1% (2,519) |
Bicycle:
| Frisco: | 0.1% (106) |
| Texas: | 0.2% (7,954) |
Walked:
| Frisco: | 1.3% (967) |
| Texas: | 1.7% (99,911) |
Other means:
| Frisco: | 2.1% (1,639) |
| Texas: | 2.0% (95,481) |


Drove car alone:
| Frisco: | 85.0% (15,354) |
| Texas: | 77.7% (7,115,590) |
Carpooled:
| Frisco: | 8.9% (1,616) |
| Texas: | 14.5% (1,326,012) |
Bus or trolley bus:
| Frisco: | 0.1% (25) |
| Texas: | 1.7% (157,014) |
Ferryboat:
| Frisco: | 0.1% (14) |
| Texas: | 0.0% (738) |
Taxicab:
| Frisco: | 0.1% (19) |
| Texas: | 0.1% (6,102) |
Bicycle:
| Frisco: | 0.1% (21) |
| Texas: | 0.2% (21,551) |
Walked:
| Frisco: | 0.6% (108) |
| Texas: | 1.9% (173,670) |
Other means:
| Frisco: | 0.7% (129) |
| Texas: | 0.9% (86,692) |


Drove car alone - Males:
| Frisco: | 83.9% (33,795) |
| Texas: | 83.6% (4,557,023) |
Carpooled - Males:
| Frisco: | 12.5% (5,028) |
| Texas: | 11.2% (674,818) |
Bus - Males:
| Frisco: | 0.0% (14) |
| Texas: | 0.8% (50,435) |
Light rail, streetcar or trolley - Males:
| Frisco: | 0.0% (9) |
| Texas: | 0.1% (2,519) |
Bicycle - Males:
| Frisco: | 0.2% (69) |
| Texas: | 0.3% (7,954) |
Walked - Males:
| Frisco: | 1.6% (630) |
| Texas: | 1.7% (99,911) |
Other means - Males:
| Frisco: | 1.8% (725) |
| Texas: | 2.2% (95,481) |


Drove car alone - Females:
| Frisco: | 85.8% (31,356) |
| Texas: | 83.0% (4,557,023) |
Carpooled - Females:
| Frisco: | 10.4% (3,814) |
| Texas: | 12.3% (674,818) |
Bus - Females:
| Frisco: | 0.2% (69) |
| Texas: | 0.9% (50,435) |
Long-distance train or commuter rail - Females:
| Frisco: | 0.0% (11) |
| Texas: | 0.0% (551) |
Bicycle - Females:
| Frisco: | 0.1% (38) |
| Texas: | 0.1% (7,954) |
Walked - Females:
| Frisco: | 0.9% (339) |
| Texas: | 1.8% (99,911) |
Other means - Females:
| Frisco: | 2.5% (912) |
| Texas: | 1.7% (95,481) |
Private vehicle occupancy

Drove alone:
| Frisco: | 90.2% (59,946) |
| Texas: | 87.6% (10,283,021) |
In 2 person carpool:
| Frisco: | 8.5% (5,637) |
| Texas: | 9.0% (1,052,595) |
In 3 person carpool:
| Frisco: | 0.8% (550) |
| Texas: | 2.1% (244,139) |
In 4 person carpool:
| Frisco: | 0.3% (177) |
| Texas: | 0.8% (92,732) |
In 5-6 person carpool:
| Frisco: | 0.2% (151) |
| Texas: | 0.4% (44,947) |

Drove alone:
| Frisco: | 90.5% (15,354) |
| Texas: | 84.3% (7,115,590) |
In 2 person carpool:
| Frisco: | 7.5% (1,266) |
| Texas: | 11.6% (982,994) |
In 3 person carpool:
| Frisco: | 1.4% (235) |
| Texas: | 2.4% (201,602) |
In 4 person carpool:
| Frisco: | 0.4% (62) |
| Texas: | 1.0% (83,518) |
In 5-6 person carpool:
| Frisco: | 0.3% (53) |
| Texas: | 0.5% (40,662) |
Class of workers

Employee of private company:
| Frisco: | 79.1% (93,869) |
| Texas: | 69.6% (10,139,666) |
Self-employed in own incorporated business:
| Frisco: | 4.4% (5,262) |
| Texas: | 3.5% (516,446) |
Private not-for-profit wage and salary workers:
| Frisco: | 4.2% (5,016) |
| Texas: | 6.0% (870,454) |
Local government workers:
| Frisco: | 4.7% (5,587) |
| Texas: | 7.6% (1,109,799) |
State government workers:
| Frisco: | 1.1% (1,291) |
| Texas: | 3.8% (558,618) |
Federal government workers:
| Frisco: | 1.3% (1,492) |
| Texas: | 2.5% (357,298) |
Self-employed workers in own not incorporated business:
| Frisco: | 5.0% (5,974) |
| Texas: | 6.8% (998,270) |
Unpaid family workers:
| Frisco: | 0.1% (139) |
| Texas: | 0.2% (27,882) |

Employee of private company:
| Frisco: | 79.3% (14,506) |
| Texas: | 69.6% (6,425,274) |
Self-employed in own incorporated business:
| Frisco: | 3.0% (545) |
| Texas: | 2.7% (250,864) |
Private not-for-profit wage and salary workers:
| Frisco: | 3.6% (665) |
| Texas: | 5.7% (526,631) |
Local government workers:
| Frisco: | 5.8% (1,052) |
| Texas: | 6.6% (608,479) |
State government workers:
| Frisco: | 1.8% (334) |
| Texas: | 5.4% (501,082) |
Federal government workers:
| Frisco: | 1.4% (250) |
| Texas: | 2.6% (237,177) |
Self-employed workers in own not incorporated business:
| Frisco: | 4.9% (895) |
| Texas: | 7.1% (653,527) |
Unpaid family workers:
| Frisco: | 0.2% (45) |
| Texas: | 0.3% (31,338) |

Employee of private company - Males:
| Frisco: | 82.0% (52,460) |
| Texas: | 73.1% (5,788,450) |
Self-employed in own incorporated business - Males:
| Frisco: | 5.7% (3,651) |
| Texas: | 4.2% (332,655) |
Private not-for-profit wage and salary workers - Males:
| Frisco: | 1.7% (1,109) |
| Texas: | 4.1% (323,476) |
Local government workers - Males:
| Frisco: | 2.8% (1,785) |
| Texas: | 5.1% (405,467) |
State government workers - Males:
| Frisco: | 0.6% (392) |
| Texas: | 3.0% (236,706) |
Federal government workers - Males:
| Frisco: | 1.8% (1,182) |
| Texas: | 2.7% (211,629) |
Self-employed workers in own not incorporated business - Males:
| Frisco: | 5.1% (3,273) |
| Texas: | 7.7% (609,246) |
Unpaid family workers - Males:
| Frisco: | 0.2% (139) |
| Texas: | 0.2% (12,606) |

Employee of private company - Females:
| Frisco: | 75.8% (41,409) |
| Texas: | 65.4% (4,351,216) |
Self-employed in own incorporated business - Females:
| Frisco: | 2.9% (1,611) |
| Texas: | 2.8% (183,791) |
Private not-for-profit wage and salary workers - Females:
| Frisco: | 7.2% (3,907) |
| Texas: | 8.2% (546,978) |
Local government workers - Females:
| Frisco: | 7.0% (3,802) |
| Texas: | 10.6% (704,332) |
State government workers - Females:
| Frisco: | 1.6% (899) |
| Texas: | 4.8% (321,912) |
Federal government workers - Females:
| Frisco: | 0.6% (310) |
| Texas: | 2.2% (145,669) |
Self-employed workers in own not incorporated business - Females:
| Frisco: | 4.9% (2,701) |
| Texas: | 5.8% (389,024) |