Franklin, MA (Massachusetts) Houses and Residents
| Franklin: | $631,186 |
| Massachusetts: | $534,700 |
Total population: 32,079 (Urban population: 30,433, Rural population: 1,646 (all nonfarm))
Houses: 10,327 (10,152 occupied: 8,261 owner occupied, 1,891 renter occupied)
| % of renters here: | 19% |
| State: | 38% |
Housing density: 386 houses/condos per square mile
Median price asked for vacant for-sale houses and condos in 2022 in this county: $751,928.
Median contract rent in 2022: $1,443 (lower quartile is $907, upper quartile is $1,785)
Median rent asked for vacant for-rent units in 2022: $1,366
Median gross rent in Franklin, MA in 2022: $1,553
Housing units in Franklin with a mortgage: 6,166 (534 second mortgage, 992 home equity loan, 10 both second mortgage and home equity loan)
Houses without a mortgage: 1,034
Compare current foreclosures near Franklin, MA:
| Photo | Address | Area | Beds / Baths | Price | Details |
|---|---|---|---|---|---|

|
#1
Brandywine Rd
Franklin, MA 02038
|
2,652 sq. feet
|
3 baths 4 beds |
show details | |

|
#2
Briarwood Rd
Franklin, MA 02038
|
1,664 sq. feet
|
2 baths 2 beds |
show details | |

|
#3
Riverside Rd
Franklin, MA 02038
|
3,093 sq. feet
|
2 baths 4 beds |
show details | |

|
#4
Riverside Rd
Franklin, MA 02038
|
3,093 sq. feet
|
2 baths 4 beds |
show details | |

|
#5
Old Grove St
Franklin, MA 02038
|
1,728 sq. feet
|
1 baths 4 beds |
show details | |

|
#6
Pine St
Franklin, MA 02038
|
2,059 sq. feet
|
2 baths 5 beds |
show details | |

|
#7
Stonehedge Rd
Franklin, MA 02038
|
2,250 sq. feet
|
2 baths 4 beds |
show details | |

|
#8
Oakland Pkwy
Franklin, MA 02038
|
2,184 sq. feet
|
1 baths 5 beds |
show details | |

|
#9
Alpine Pl
Franklin, MA 02038
|
1,360 sq. feet
|
1 baths 3 beds |
show details | |

|
#10
Highland St
Franklin, MA 02038
|
1,504 sq. feet
|
2 baths 3 beds |
show details |
| Photo | Address | Area | Beds / Baths | Price | Details |
|---|---|---|---|---|---|

|
#11
Union St
Franklin, MA 02038
|
2,508 sq. feet
|
3 baths 5 beds |
show details | |

|
#12
Riverside Drive
Franklin, MA Array
|
3,050 sq. feet
|
2 baths 4 beds |
show details | |

|
#13
Lockewood Dr
Franklin, MA 02038
|
2,384 sq. feet
|
2 baths 4 beds |
show details | |

|
#14
Pond St
Franklin, MA 02038
|
1,100 sq. feet
|
1 baths 2 beds |
show details | |

|
#15
Miller St
Franklin, MA 02038
|
2,030 sq. feet
|
2 baths 2 beds |
show details | |

|
#16
Glen Meadow Rd # 7
Franklin, MA 02038
|
- sq. feet
|
- baths - beds |
show details | |

|
#17
Independence Way Apt 109
Franklin, MA 02038
|
- sq. feet
|
- baths - beds |
show details | |

|
#18
E Central St # 5
Franklin, MA 02038
|
- sq. feet
|
- baths - beds |
show details | |

|
#19
Stillman St
Framingham, MA 01702
|
1,122 sq. feet
|
1 baths 2 beds |
$290,000
|
show details |

|
#20
Cook Rd
Cumberland, RI 02864
|
2,050 sq. feet
|
2 baths 4 beds |
$699,900
|
show details |
| Photo | Address | Area | Beds / Baths | Price | Details |
|---|---|---|---|---|---|

|
#21
Loomis St
North Attleboro, MA 02760
|
2,294 sq. feet
|
2 baths 4 beds |
$700,000
|
show details |

|
#22
Steere Farm Rd
Harrisville, RI 02830
|
960 sq. feet
|
1 baths 2 beds |
$412,000
|
show details |

|
#23
Cedar St
Foxboro, MA 02035
|
972 sq. feet
|
2 baths 2 beds |
show details | |

|
#24
Livingston Cir
Needham, MA 02492
|
2,199 sq. feet
|
3 baths 3 beds |
show details | |

|
#25
Fiske St
Holliston, MA 01746
|
1,182 sq. feet
|
2 baths 4 beds |
show details | |

|
#26
Lowther Rd
Framingham, MA 01701
|
1,808 sq. feet
|
2 baths 4 beds |
show details | |

|
#27
Walnut St Unit 111
Canton, MA 02021
|
830 sq. feet
|
1 baths 2 beds |
show details | |

|
#28
Norfolk St
Bellingham, MA 02019
|
2,768 sq. feet
|
3 baths 6 beds |
show details | |

|
#29
Robinette Rd
Stoughton, MA 02072
|
2,252 sq. feet
|
2 baths 4 beds |
show details | |

|
#30
Webster Rd
Ashland, MA 01721
|
768 sq. feet
|
1 baths 3 beds |
show details |
| Photo | Address | Area | Beds / Baths | Price | Details |
|---|---|---|---|---|---|

|
#31
Jackson St
Canton, MA 02021
|
1,330 sq. feet
|
3 baths 4 beds |
show details | |

|
#32
East St
Foxboro, MA 02035
|
1,136 sq. feet
|
2 baths 2 beds |
show details | |

|
#33
Franklin St
Milford, MA 01757
|
2,060 sq. feet
|
2 baths 5 beds |
show details | |

|
#34
Linda Ave
Framingham, MA 01701
|
1,670 sq. feet
|
3 baths 4 beds |
show details | |

|
#35
Revere St
Pawtucket, RI 02861
|
1,072 sq. feet
|
2 baths 3 beds |
show details | |

|
#36
Ridgehill Rd
Canton, MA 02021
|
1,196 sq. feet
|
1 baths 3 beds |
show details | |

|
#37
Juniper Rd Unit A10
North Attleboro, MA 02760
|
693 sq. feet
|
1 baths 1 beds |
show details | |

|
#38
Lincoln St
Stoughton, MA 02072
|
1,310 sq. feet
|
1 baths 3 beds |
show details | |

|
#39
Western Ave
Natick, MA 01760
|
1,508 sq. feet
|
2 baths 3 beds |
show details | |

|
#40
Rome Blvd
Attleboro, MA 02703
|
1,791 sq. feet
|
3 baths 4 beds |
show details |
| Photo | Address | Area | Beds / Baths | Price | Details |
|---|---|---|---|---|---|

|
#41
Robin Cir Apt 5
Norton, MA 02766
|
1,284 sq. feet
|
2 baths 2 beds |
show details | |

|
#42
Middlesex Ave
Norton, MA 02766
|
1,080 sq. feet
|
2 baths 3 beds |
show details | |

|
#43
Cherry St
Framingham, MA 01701
|
1,380 sq. feet
|
1 baths 4 beds |
show details | |

|
#44
Union St
Foxboro, MA 02035
|
1,278 sq. feet
|
2 baths 3 beds |
show details | |

|
#45
Valley Green Court
Providence, RI 02904
|
1,440 sq. feet
|
3 baths 2 beds |
show details | |

|
#46
Ruth St
Pawtucket, RI 02861
|
1,176 sq. feet
|
1 baths 2 beds |
show details | |

|
#47
Juniper Rd # C9
North Attleboro, MA 02760
|
697 sq. feet
|
1 baths 1 beds |
show details | |

|
#48
Mount Hope St
North Attleboro, MA 02760
|
2,977 sq. feet
|
2 baths 5 beds |
show details | |

|
#49
Parkerville Rd
Southborough, MA 01772
|
2,060 sq. feet
|
3 baths 4 beds |
show details | |

|
Check over 1 million property listings on Foreclosure.com!
|
browse all offers | |||
Latest news about housing in Franklin, MA collected exclusively by city-data.com from local newspapers, TV, and radio stations

 | How Much Massachusetts Households Make Per Year: Census Data (37 replies) |
| 2024 Real Estate Observations (1055 replies) |
| 2023 Real Estate Observations (5278 replies) |
| House opinions - Franklin! (20 replies) |
| 2021 Real Estate Observations (1729 replies) |
| Under $250k any Massachusetts single family house with yard (117 replies) |

Household type by relationship:
Households: 653,239- In family households: 540,608 (116,996 male householders, 51,907 female householders)
134,066 spouses, 197,825 children (189,784 natural, 4,588 adopted, 3,453 stepchildren), 7,406 grandchildren, 6,062 brothers or sisters, 7,064 parents, foster children, 5,893 other relatives, 9,006 non-relatives
- In nonfamily households: 112,631 (36,559 male householders (27,334 living alone)), 52,452 female householders (43,798 living alone)), 23,620 nonrelatives
- In group quarters: 17,611 (8,991 institutionalized population)
123,500 married couples with children.
20,654 single-parent households (3,498 men, 17,156 women).
91.9% of residents of Franklin speak English at home.
1.7% of residents speak Spanish at home (80% speak English very well, 3% speak English well, 13% speak English not well, 3% don't speak English at all).
4.7% of residents speak other Indo-European language at home (70% speak English very well, 21% speak English well, 8% speak English not well, 2% don't speak English at all).
1.4% of residents speak Asian or Pacific Island language at home (43% speak English very well, 25% speak English well, 21% speak English not well, 11% don't speak English at all).
0.4% of residents speak other language at home (94% speak English very well, 6% speak English not well).
Foreign born population: 2,923 (8.9%)
(64.6% of them are naturalized citizens)
| Here: | 8.1 |
| State: | 6.5 |
| Here: | 3.8 |
| State: | 4.0 |

- Bedrooms in owner-occupied houses and condos in Franklin, Massachusetts
- 16no bedroom
- 1451 bedroom
- 1,0922 bedrooms
- 3,6273 bedrooms
- 2,9934 bedrooms
- 3885+ bedrooms

- Bedrooms in renter-occupied apartments in Franklin, Massachusetts
- 42no bedroom
- 6601 bedroom
- 9542 bedrooms
- 1813 bedrooms
- 544 bedrooms
- 05+ bedrooms

- Cars and other vehicles available in Franklin in owner-occupied houses/condos
- 205no vehicle
- 1,5521 vehicle
- 4,9652 vehicles
- 1,1603 vehicles
- 3074 vehicles
- 725+ vehicles

- Cars and other vehicles available in Franklin in renter-occupied apartments
- 317no vehicle
- 9621 vehicle
- 5062 vehicles
- 923 vehicles
- 144 vehicles
- 05+ vehicles

- Rooms in owner-occupied houses in Franklin, Massachusetts
- 161 room
- 172 rooms
- 1233 rooms
- 3694 rooms
- 8475 rooms
- 1,3976 rooms
- 1,7967 rooms
- 2,0688 rooms
- 1,6289+ rooms

- Rooms in renter-occupied apartments in Franklin, Massachusetts
- 221 room
- 1612 rooms
- 4683 rooms
- 6744 rooms
- 3665 rooms
- 1126 rooms
- 627 rooms
- 198 rooms
- 79+ rooms


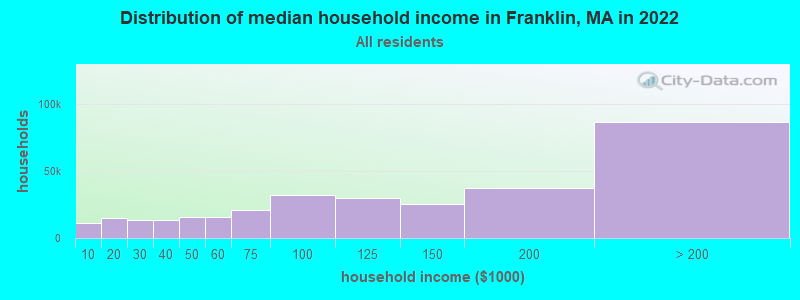
Franklin, MA household income distribution

- 11,246Less than $10,000
- 15,109$10,000 to $19,999
- 13,628$20,000 to $29,999
- 13,341$30,000 to $39,999
- 15,859$40,000 to $49,999
- 15,746$50,000 to $59,999
- 20,787$60,000 to $74,999
- 31,934$75,000 to $99,999
- 30,095$100,000 to $124,999
- 25,030$125,000 to $149,999
- 37,094$150,000 to $199,999
- 86,370$200,000 or more
Percentage of workers working in this county: 63.1%
Number of people working at home: 3,866 (22.3% of all workers)
Travel time to work (commute)
- Less than 5 minutes: 337
- 5 to 9 minutes: 1,420
- 10 to 14 minutes: 1,845
- 15 to 19 minutes: 1,462
- 20 to 24 minutes: 1,311
- 25 to 29 minutes: 583
- 30 to 34 minutes: 1,602
- 35 to 39 minutes: 682
- 40 to 44 minutes: 868
- 45 to 59 minutes: 1,711
- 60 to 89 minutes: 1,882
- 90 or more minutes: 457
Means of transportation to work:
- Drove a car alone: 12,121 (81.9%)
- Carpooled: 769 (5.2%)
- Bus or trolley bus: 35 (0.2%)
- Subway or elevated: 26 (0.2%)
- Railroad: 930 (6.3%)
- Ferryboat: 6 (0.0%)
- Taxi: 18 (0.1%)
- Motorcycle: 18 (0.1%)
- Walked: 202 (1.4%)
- Other means: 35 (0.2%)
- Worked at home: 647 (4.4%)


- Year of entry for the foreign-born population in Franklin, Massachusetts
- 3241995 to March 2000
- 1681990 to 1994
- 1781985 to 1989
- 1481980 to 1984
- 641975 to 1979
- 1091970 to 1974
- 1471965 to 1969
- 424Before 1965

First ancestries reported:
- Irish: 9,522 (25.2%)
- Italian: 7,320 (19.3%)
- English: 4,303 (11.4%)
- Other: 3,186 (8.4%)
- German: 2,677 (7.1%)
- French: 1,938 (5.1%)
- French Canadian: 1,363 (3.6%)
- Polish: 1,298 (3.4%)
- United States: 1,045 (2.8%)
- Scottish: 905 (2.4%)
- Swedish: 704 (1.9%)
- Scotch-Irish: 614 (1.6%)
- Russian: 394 (1.0%)
- Portuguese: 368 (1.0%)
- Dutch: 302 (0.8%)
- Greek: 258 (0.7%)
- Norwegian: 223 (0.6%)
- Lithuanian: 220 (0.6%)
- Ukrainian: 220 (0.6%)
- Arab: 216 (0.6%)
- Czech: 193 (0.5%)
- Danish: 139 (0.4%)
- Welsh: 129 (0.3%)
- Hungarian: 90 (0.2%)
- Slovak: 77 (0.2%)
- Subsaharan African: 72 (0.2%)
- Swiss: 54 (0.1%)
- West Indian: 24 (0.06%)
Most common places of birth for foreign-born residents (%):
| Franklin: | 13.8% (216) |
| Massachusetts: | 5.2% (40,247) |
| Franklin: | 11.5% (180) |
| Massachusetts: | 3.7% (28,319) |
| Franklin: | 10.3% (161) |
| Massachusetts: | 5.1% (39,255) |
| Franklin: | 9.7% (152) |
| Massachusetts: | 3.3% (25,403) |
| Franklin: | 4.3% (67) |
| Massachusetts: | 1.9% (14,883) |
| Franklin: | 3.8% (60) |
| Massachusetts: | 0.5% (3,525) |
| Franklin: | 3.5% (55) |
| Massachusetts: | 3.6% (28,086) |
| Franklin: | 3.3% (52) |
| Massachusetts: | 1.6% (12,350) |
| Franklin: | 3.3% (51) |
| Massachusetts: | 0.9% (7,258) |
| Franklin: | 2.5% (39) |
| Massachusetts: | 1.1% (8,754) |
| Franklin: | 2.0% (32) |
| Massachusetts: | 2.3% (17,987) |
| Franklin: | 1.9% (29) |
| Massachusetts: | 1.0% (7,937) |
| Franklin: | 1.7% (27) |
| Massachusetts: | 1.1% (8,682) |
| Franklin: | 1.6% (25) |
| Massachusetts: | 1.7% (13,456) |
Place of birth for U.S.-born residents:
- This state: 20,438
- Other state: 7,384
- Northeast: 4,921
- Midwest: 899
- South: 1,037
- West: 527
60% of Franklin residents lived in the same house 5 years ago.
Out of people who lived in different houses, 51% lived in this county.
Out of people who lived in different counties, 47% lived in Massachusetts.
Education attainment for males 25 years and older:
- No schooling: 13
- Nursery to 4th grade: 7
- 5th and 6th grade: 30
- 7th and 8th grade: 114
- 9th grade: 76
- 10th grade: 146
- 11th grade: 83
- 12th grade, no diploma: 182
- High school graduate (or equivalency): 1,969
- Less than 1 year of college: 614
- Some college more than 1 year, no degree: 983
- Associate degree: 605
- Bachelor's degree: 2,686
- Master's degree: 1,130
- Professional school degree: 135
- Doctorate degree: 172

Education attainment for females 25 years and older:
- No schooling: 43
- Nursery to 4th grade: 6
- 5th and 6th grade: 60
- 7th and 8th grade: 85
- 9th grade: 80
- 10th grade: 120
- 11th grade: 109
- 12th grade, no diploma: 171
- High school graduate (or equivalency): 2,433
- Less than 1 year of college: 765
- Some college more than 1 year, no degree: 1,002
- Associate degree: 1,041
- Bachelor's degree: 2,755
- Master's degree: 952
- Professional school degree: 125
- Doctorate degree: 44


Housing units in structures:
- One, detached: 7,262
- One, attached: 561
- Two: 625
- 3 or 4: 576
- 5 to 9: 554
- 10 to 19: 348
- 20 to 49: 231
- 50 or more: 170
Housing units lacking complete kitchen facilities: 0.2%

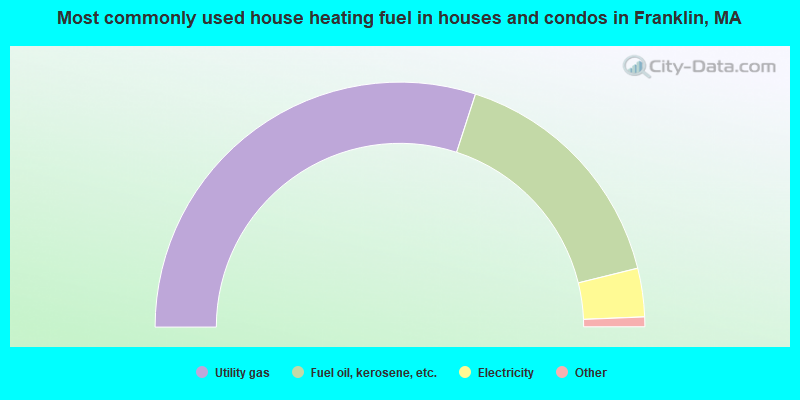
- 60.0%Utility gas
- 32.3%Fuel oil, kerosene, etc.
- 6.4%Electricity
- 0.7%Bottled, tank, or LP gas
- 0.4%Wood
- 0.3%Other fuel
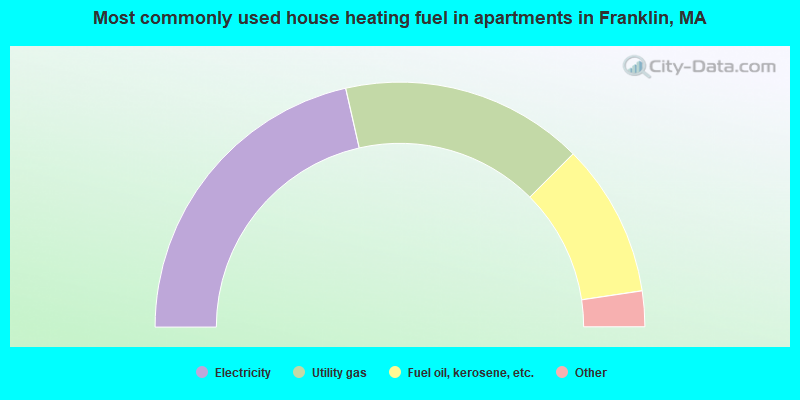
- 42.9%Electricity
- 32.1%Utility gas
- 20.3%Fuel oil, kerosene, etc.
- 2.3%Other fuel
- 2.0%Bottled, tank, or LP gas
- 0.3%No fuel used
Private vs. public school enrollment:
| Here: | 2.6% |
| Massachusetts: | 10.8% |
| Here: | 12.6% |
| Massachusetts: | 12.2% |
| Here: | 64.1% |
| Massachusetts: | 48.2% |


