Races in Franklin, Massachusetts (MA) Detailed Stats
Ancestries, Foreign-born residents, place of birth

Recent posts about races in Franklin, Massachusetts on our local forum with over 2,400,000 registered users:
 | House opinions - Franklin! (20 replies) |
| 2023 Real Estate Observations (5278 replies) |
| Post is about Franklin,MA and Indian community (5 replies) |
| towns that offer the most jobs per dollar of house (58 replies) |
| "All-Inclusive Boston" campaiagn (582 replies) |
| Mayor Walsh tapped for Labor Secretary (1240 replies) |
Latest news about races in Franklin, MA collected exclusively by city-data.com from local newspapers, TV, and radio stations
5.3% of Franklin, MA residents are foreign-born (2.3% born in Europe, 1.7% born in Asia, 0.7% born in North America), which is 240.6% less than the foreign-born rate of 18.0% across the entire state of Massachusetts.
Race distribution in Franklin

- 28,16595.3%White alone
- 4861.6%Asian alone
- 3181.1%Hispanic
- 3051.0%Black alone
- 2110.7%Two or more races
- 320.1%Other race alone
- 360.1%American Indian alone
- 70.02%Native Hawaiian and Other
Pacific Islander alone
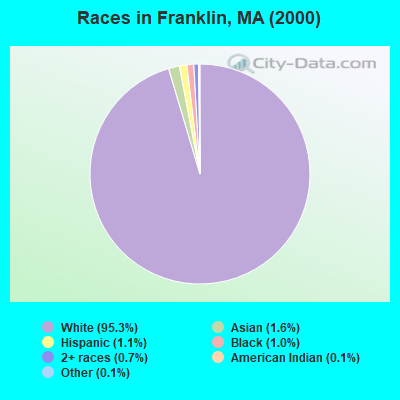
2000
2022
-
- 5,198,35981.9%White alone
- 428,7296.8%Hispanic
- 318,3295.0%Black alone
- 236,7863.7%Asian alone
- 110,3381.7%Two or more races
- 43,5860.7%Other race alone
- 11,2640.2%American Indian alone
- 1,7060.03%Native Hawaiian and Other
Pacific Islander alone

-
- 4,676,62767.0%White alone
- 911,03813.0%Hispanic
- 501,4637.2%Asian alone
- 459,7406.6%Black alone
- 341,8894.9%Two or more races
- 84,4031.2%Other race alone
- 5,8380.08%American Indian alone
- 9760.01%Native Hawaiian and Other
Pacific Islander alone

Income and house value in Franklin
- Median household income in 2022
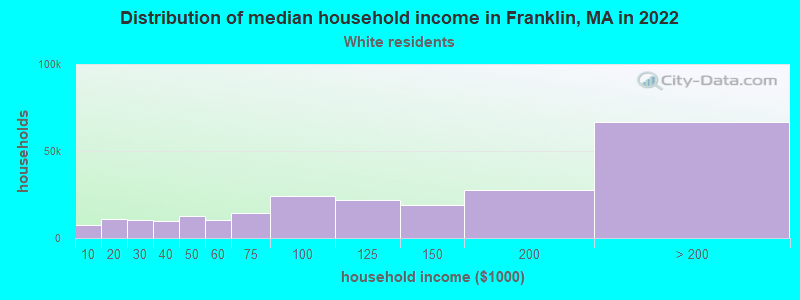
- $133,417White non-Hispanic householders
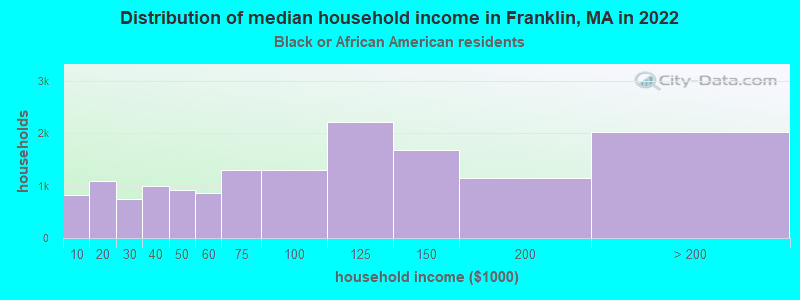
- $82,694Black householders
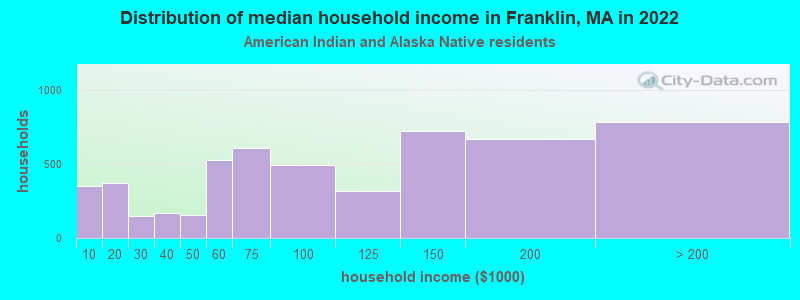
- $64,571American Indian and Alaska Native householders
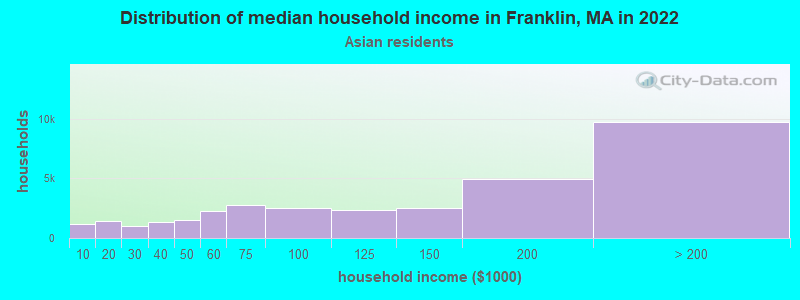
- $139,568Asian householders
- $24,532Some other race householders
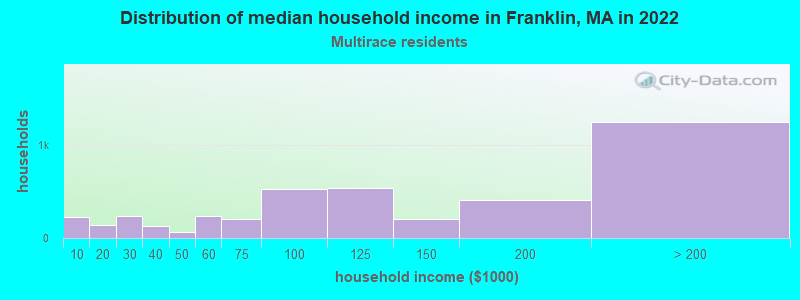
- $33,462Two or more races householders
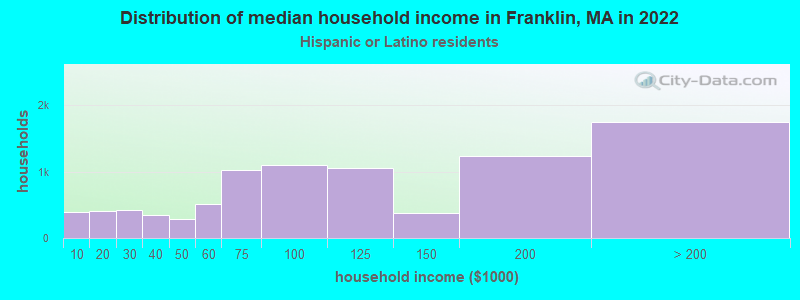
- $70,564Hispanic or Latino race householders
- Median 2022 house value
- $651,000White Non-Hispanic householders
- $897,386Black or African American householders
- $673,685Asian householders
- $789,700Some other race householders
- $538,431Two or more races householders
- $466,640Hispanic or Latino householders
Household income for White non-Hispanic householders
Household income for Black householders
Household income for American Indian and Alaska Native householders
Household income for Asian householders
Household income for Two or more races householders
Household income for Hispanic or Latino race householders
Foreign-born residents in Franklin
1,562 residents are foreign born (2.3% Europe, 1.7% Asia, 0.7% North America).
| This city: | 5.3% |
| Massachusetts: | 12.2% |
Ancestries in Franklin

- 9,52225.2%Irish
- 7,32019.3%Italian
- 4,30311.4%English
- 3,1868.4%Other
- 2,6777.1%German
- 1,9385.1%French
- 1,3633.6%French Canadian
- 1,2983.4%Polish
- 1,0452.8%United States
- 9052.4%Scottish
- 7041.9%Swedish
- 6141.6%Scotch-Irish
- 3941.0%Russian
- 3681.0%Portuguese
- 3020.8%Dutch
- 2580.7%Greek
- 2230.6%Norwegian
- 2200.6%Lithuanian
- 2200.6%Ukrainian
- 2160.6%Arab
- 1930.5%Czech
- 1390.4%Danish
- 1290.3%Welsh
- 900.2%Hungarian
- 770.2%Slovak
- 720.2%Subsaharan African
- 540.1%Swiss
- 240.06%West Indian

Zip codes: 02038.