Chamblee, GA (Georgia) Houses and Residents
Estimated median house or condo value in 2022: $463,089 (it was $184,100 in 2000 )
Chamblee:
$463,089Georgia:
$297,400
Lower value quartile - upper value quartile: $351,733 - $625,226Mean price in 2022: Detached houses: $455,421 Here:
$455,421State:
$376,364
Townhouses or other attached units: $375,970 Here:
$375,970State:
$341,709
In 2-unit structures: $223,718 Here:
$223,718State:
$269,631
In 3-to-4-unit structures: $178,759 Here:
$178,759State:
$250,092
In 5-or-more-unit structures: $230,146 Here:
$230,146State:
$370,730
Total population: 16,112 (Urban population: 9,838, Rural population: 0)
Houses: 13,754 (12,438 occupied: 4,795 owner occupied, 7,253 renter occupied )
% of renters here:
60%State:
34%
Housing density: 4,382 houses/condos per square mile
Median price asked for vacant for-sale houses and condos in 2022: $578,318.
Median contract rent in 2022: $1,637 (lower quartile is $1,326, upper quartile is over $2,000)
Median rent asked for vacant for-rent units in 2022: $1,814
Median gross rent in Chamblee, GA in 2022: $1,831
Housing units in Chamblee with a mortgage: 3,685 (238 second mortgage, 0 home equity loan, 194 both second mortgage and home equity loan )Houses without a mortgage: 0
Median household income for houses/condos with a mortgage: $121,663
Median household income for apartments without a mortgage: $80,744
Median monthly housing costs: $1,784
Data:
Median house or condo value ($)
Median house or condo value ($ change since 2000)
Median house or condo value ($) - White
Median house or condo value ($) - Black or African American
Median house or condo value ($) - Asian
Median house or condo value ($) - Hispanic or Latino
Median house or condo value ($) - American Indian and Alaska Native
Median house or condo value ($) - Multirace
Median house or condo value ($) - Other Race
Median price asked for mobile homes ($)
Household density (households per square mile)
Mean house or condo value by units in structure - 1, detached ($)
Mean house or condo value by units in structure - 1, attached ($)
Mean house or condo value by units in structure - 2 ($)
Mean house or condo value by units in structure by units in structure - 3 or 4 ($)
Mean house or condo value by units in structure - 5 or more ($)
Mean house or condo value by units in structure - Boat, RV, van, etc. ($)
Mean house or condo value by units in structure - Mobile home ($)
Median contract rent ($)
Median contract rent - Lower quartile ($)
Median contract rent - Upper quartile ($)
Median gross rent ($)
Urban houses (%)
Rural houses (%)
Houses occupied (%)
Houses occupied (% change since 2000)
Houses owner occupied (%)
Houses owner occupied (% change since 2000)
Houses renter occupied (%)
Houses renter occupied (% change since 2000)
Vacant housing units - For rent (%)
Vacant housing units - For rent (% change since 2000)
Vacant housing units - For sale only (%)
Vacant housing units - For sale only (% change since 2000)
Vacant housing units - Rented or sold, not occupied (%)
Vacant housing units - Rented or sold, not occupied (% change since 2000)
Vacant housing units - For seasonal, recreational, or occasional use (%)
Vacant housing units - For seasonal, recreational, or occasional use (% change since 2000)
Vacant housing units - For migrant workers (%)
Vacant housing units - For migrant workers (% change since 2000)
Vacant housing units - Other vacant (%)
Vacant housing units - Other vacant (% change since 2000)
Median monthly housing costs ($)
Median household income for houses/condos with a mortgage ($)
Median household income for houses/condos without a mortgage ($)
Median household income ($)
Median household income ($) - White
Median household income ($) - Black or African American
Median household income ($) - Asian
Median household income ($) - Hispanic or Latino
Median household income ($) - American Indian and Alaska Native
Median household income ($) - Multirace
Median household income ($) - Other Race
Mortgage status - with mortgage (%)
Mortgage status - with second mortgage (%)
Mortgage status - with home equity loan (%)
Mortgage status - with both second mortgage and home equity loan (%)
Mortgage status - without a mortgage (%)
Median year house/condo built
Median year apartment built
Household type by relationship - Male householder living alone (%)
Household type by relationship - Male householder not living alone (%)
Household type by relationship - Female householder living alone (%)
Household type by relationship - Female householder not living alone (%)
Household type by relationship - Opposite-Sex spouse (%)
Household type by relationship - Same-Sex spouse (%)
Household type by relationship - Opposite-Sex unmarried partner (%)
Household type by relationship - Same-Sex unmarried partner (%)
Household type by relationship - In group quarters (%)
Size of family households - 2-person household (%)
Size of family households - 3-person household (%)
Size of family households - 4-person household (%)
Size of family households - 5-person household (%)
Size of family households - 6-person household (%)
Size of family households - 7-or-more-person household (%)
Size of nonfamily households - 1-person household (%)
Size of nonfamily households - 2-person household (%)
Size of nonfamily households - 3-person household (%)
Size of nonfamily households - 4-person household (%)
Size of nonfamily households - 5-person household (%)
Size of nonfamily households - 6-person household (%)
Size of nonfamily households - 7-or-moreperson household (%)
Year house built - Built 2010 or later (%)
Year house built - Built 2000 to 2009 (%)
Year house built - Built 1990 to 1999 (%)
Year house built - Built 1980 to 1989 (%)
Year house built - Built 1970 to 1979 (%)
Year house built - Built 1960 to 1969 (%)
Year house built - Built 1950 to 1959 (%)
Year house built - Built 1940 to 1949 (%)
Year house built - Built 1939 or earlier (%)
Median number of rooms in houses and condos
Median number of rooms in apartments
Median number of bedrooms in owner occupied houses
Mean number of bedrooms in owner occupied houses
Median number of bedrooms in renter occupied houses
Mean number of bedrooms in renter occupied houses
Median number of vehichles in owner occupied houses
Mean number of vehichles in owner occupied houses
Median number of vehichles in renter occupied houses
Mean number of vehichles in renter occupied houses
Rooms in owner-occupied houses - 1 room (%)
Rooms in owner-occupied houses - 2 rooms (%)
Rooms in owner-occupied houses - 3 rooms (%)
Rooms in owner-occupied houses - 4 rooms (%)
Rooms in owner-occupied houses - 5 rooms (%)
Rooms in owner-occupied houses - 6 rooms (%)
Rooms in owner-occupied houses - 7 rooms (%)
Rooms in owner-occupied houses - 8 rooms (%)
Rooms in owner-occupied houses - 9+ rooms (%)
Rooms in renter-occupied houses - 1 room (%)
Rooms in renter-occupied houses - 2 rooms (%)
Rooms in renter-occupied houses - 3 rooms (%)
Rooms in renter-occupied houses - 4 rooms (%)
Rooms in renter-occupied houses - 5 rooms (%)
Rooms in renter-occupied houses - 6 rooms (%)
Rooms in renter-occupied houses - 7 rooms (%)
Rooms in renter-occupied houses - 8 rooms (%)
Rooms in renter-occupied houses - 9+ rooms (%)
Bedrooms in owner-occupied houses - no bedrooms (%)
Bedrooms in owner-occupied houses - 1 bedroom (%)
Bedrooms in owner-occupied houses - 2 bedrooms (%)
Bedrooms in owner-occupied houses - 3 bedrooms (%)
Bedrooms in owner-occupied houses - 4 bedrooms (%)
Bedrooms in owner-occupied houses - 5+ bedrooms (%)
Bedrooms in renter-occupied houses - no bedrooms (%)
Bedrooms in renter-occupied houses - 1 bedroom (%)
Bedrooms in renter-occupied houses - 2 bedrooms (%)
Bedrooms in renter-occupied houses - 3 bedrooms (%)
Bedrooms in renter-occupied houses - 4 bedrooms (%)
Bedrooms in renter-occupied houses - 5+ bedrooms (%)
Vehicles available in owner-occupied houses - no vehicle available (%)
Vehicles available in owner-occupied houses - 1 vehicle available(%)
Vehicles available in owner-occupied houses - 2 Vehicles available (%)
Vehicles available in owner-occupied houses - 3 Vehicles available (%)
Vehicles available in owner-occupied houses - 4 Vehicles available (%)
Vehicles available in owner-occupied houses - 5+ Vehicles available (%)
Vehicles available in renter-occupied houses - no vehicle available (%)
Vehicles available in renter-occupied houses - 1 vehicle available (%)
Vehicles available in renter-occupied houses - 2 Vehicles available (%)
Vehicles available in renter-occupied houses - 3 Vehicles available (%)
Vehicles available in renter-occupied houses - 4 Vehicles available (%)
Vehicles available in renter-occupied houses - 5+ Vehicles available (%)
Housing units in structures - 1, detached (%)
Housing units in structures - 1, attached (%)
Housing units in structures - 2 (%)
Housing units in structures - 3 or 4 (%)
Housing units in structures - 5 to 9 (%)
Housing units in structures - 10 to 19 (%)
Housing units in structures - 20 to 49 (%)
Housing units in structures - 50 or more (%)
Housing units in structures - Mobile home (%)
Housing units in structures - Boat, RV, van, etc. (%)
Housing units in structures - Owners - 1, detached (%)
Housing units in structures - Owners - 1, attached (%)
Housing units in structures - Owners - 2 (%)
Housing units in structures - Owners - 3 or 4 (%)
Housing units in structures - Owners - 5 to 9 (%)
Housing units in structures - Owners - 10 to 19 (%)
Housing units in structures - Owners - 20 to 49 (%)
Housing units in structures - Owners - 50 or more (%)
Housing units in structures - Owners - Mobile home (%)
Housing units in structures - Owners - Boat, RV, van, etc. (%)
Housing units in structures - Renters - 1, detached (%)
Housing units in structures - Renters - 1, attached (%)
Housing units in structures - Renters - 2 (%)
Housing units in structures - Renters - 3 or 4 (%)
Housing units in structures - Renters - 5 to 9 (%)
Housing units in structures - Renters - 10 to 19 (%)
Housing units in structures - Renters - 20 to 49 (%)
Housing units in structures - Renters - 50 or more (%)
Housing units in structures - Renters - Mobile home (%)
Housing units in structures - Renters - Boat, RV, van, etc. (%)
House/condo owner moved in on average (years ago)
Renter moved in on average (years ago)
Year householder moved into unit - Moved in 1999 to March 2000 (%)
Year householder moved into unit - Moved in 1999 to March 2000 (%) - White
Year householder moved into unit - Moved in 1999 to March 2000 (%) - Black or African American
Year householder moved into unit - Moved in 1999 to March 2000 (%) - Asian
Year householder moved into unit - Moved in 1999 to March 2000 (%) - Hispanic or Latino
Year householder moved into unit - Moved in 1999 to March 2000 (%) - American Indian and Alaska Native
Year householder moved into unit - Moved in 1999 to March 2000 (%) - Multirace
Year householder moved into unit - Moved in 1999 to March 2000 (%) - Other Race
Year householder moved into unit - Moved in 1995 to 1998 (%)
Year householder moved into unit - Moved in 1995 to 1998 (%) - White
Year householder moved into unit - Moved in 1995 to 1998 (%) - Black or African American
Year householder moved into unit - Moved in 1995 to 1998 (%) - Asian
Year householder moved into unit - Moved in 1995 to 1998 (%) - Hispanic or Latino
Year householder moved into unit - Moved in 1995 to 1998 (%) - American Indian and Alaska Native
Year householder moved into unit - Moved in 1995 to 1998 (%) - Multirace
Year householder moved into unit - Moved in 1995 to 1998 (%) - Other Race
Year householder moved into unit - Moved in 1990 to 1994 (%)
Year householder moved into unit - Moved in 1990 to 1994 (%) - White
Year householder moved into unit - Moved in 1990 to 1994 (%) - Black or African American
Year householder moved into unit - Moved in 1990 to 1994 (%) - Asian
Year householder moved into unit - Moved in 1990 to 1994 (%) - Hispanic or Latino
Year householder moved into unit - Moved in 1990 to 1994 (%) - American Indian and Alaska Native
Year householder moved into unit - Moved in 1990 to 1994 (%) - Multirace
Year householder moved into unit - Moved in 1990 to 1994 (%) - Other Race
Year householder moved into unit - Moved in 1980 to 1989 (%)
Year householder moved into unit - Moved in 1980 to 1989 (%) - White
Year householder moved into unit - Moved in 1980 to 1989 (%) - Black or African American
Year householder moved into unit - Moved in 1980 to 1989 (%) - Asian
Year householder moved into unit - Moved in 1980 to 1989 (%) - Hispanic or Latino
Year householder moved into unit - Moved in 1980 to 1989 (%) - American Indian and Alaska Native
Year householder moved into unit - Moved in 1980 to 1989 (%) - Multirace
Year householder moved into unit - Moved in 1980 to 1989 (%) - Other Race
Year householder moved into unit - Moved in 1970 to 1979 (%)
Year householder moved into unit - Moved in 1970 to 1979 (%) - White
Year householder moved into unit - Moved in 1970 to 1979 (%) - Black or African American
Year householder moved into unit - Moved in 1970 to 1979 (%) - Asian
Year householder moved into unit - Moved in 1970 to 1979 (%) - Hispanic or Latino
Year householder moved into unit - Moved in 1970 to 1979 (%) - American Indian and Alaska Native
Year householder moved into unit - Moved in 1970 to 1979 (%) - Multirace
Year householder moved into unit - Moved in 1970 to 1979 (%) - Other Race
Year householder moved into unit - Moved in 1969 or earlier (%)
Year householder moved into unit - Moved in 1969 or earlier (%) - White
Year householder moved into unit - Moved in 1969 or earlier (%) - Black or African American
Year householder moved into unit - Moved in 1969 or earlier (%) - Asian
Year householder moved into unit - Moved in 1969 or earlier (%) - Hispanic or Latino
Year householder moved into unit - Moved in 1969 or earlier (%) - American Indian and Alaska Native
Year householder moved into unit - Moved in 1969 or earlier (%) - Multirace
Year householder moved into unit - Moved in 1969 or earlier (%) - Other Race
Housing units lacking complete plumbing facilities (%)
Housing units lacking complete kitchen facilities (%)
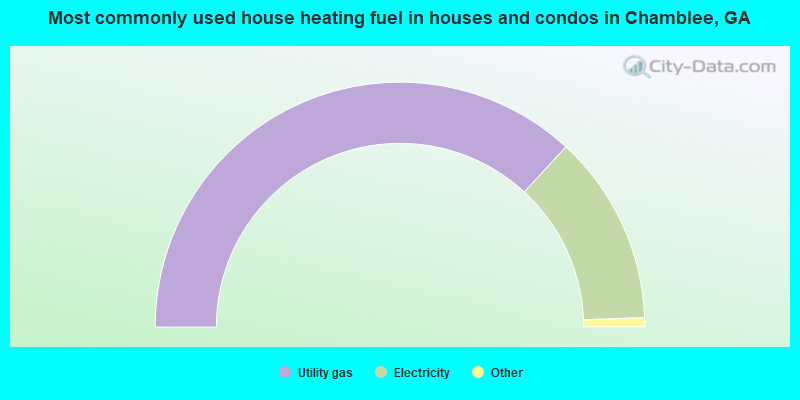
House heating fuel used in houses and condos - Utility gas (%)
House heating fuel used in houses and condos - Bottled, tank, or LP gas (%)
House heating fuel used in houses and condos - Electricity (%)
House heating fuel used in houses and condos - Fuel oil, kerosene, etc. (%)
House heating fuel used in houses and condos - Coal or coke (%)
House heating fuel used in houses and condos - Wood (%)
House heating fuel used in houses and condos - Solar energy (%)
House heating fuel used in houses and condos - Other fuel (%)
House heating fuel used in houses and condos - No fuel used (%)
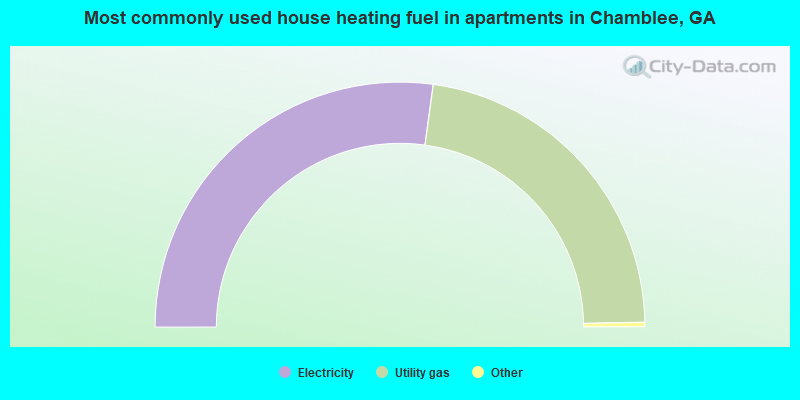
House heating fuel used in apartments - Utility gas (%)
House heating fuel used in apartments - Bottled, tank, or LP gas (%)
House heating fuel used in apartments - Electricity (%)
House heating fuel used in apartments - Fuel oil, kerosene, etc. (%)
House heating fuel used in apartments - Coal or coke (%)
House heating fuel used in apartments - Wood (%)
House heating fuel used in apartments - Solar energy (%)
House heating fuel used in apartments - Other fuel (%)
House heating fuel used in apartments - No fuel used (%)
Latest news about housing in Chamblee, GA collected exclusively by city-data.com from local newspapers, TV, and radio stations
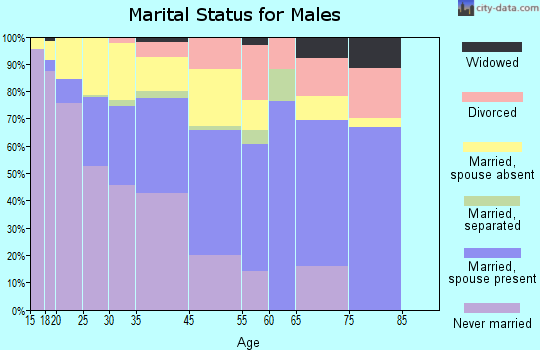
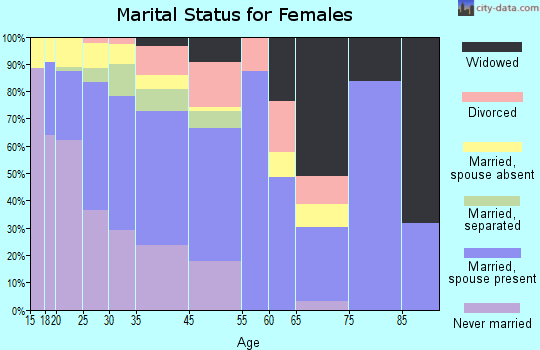
Median year house/condo built: 1975Median year apartment built: 1984Household type by relationship:
Households: 30,043
Male householders: 6,138 (2,252 living alone ), Female householders: 6,145 (2,745 living alone )4,087 spouses (4,019 opposite-sex spouses ), 932 unmarried partners , (822 opposite-sex unmarried partners ), 7,412 children (7,160 natural , 78 adopted , 174 stepchildren ), 370 grandchildren , 630 brothers or sisters , 470 parents , 47 foster children , 772 other relatives , 2,877 non-relatives In group quarters: 156
Size of family households: 2,877 2-persons , 1,199 3-persons , 927 4-persons , 439 5-persons , 155 6-persons , 199 7-or-more-persons .
Size of nonfamily households: 4,650 1-person , 1,074 2-persons , 355 3-persons , 58 4-persons , 62 5-persons , 33 6-persons .
3,857 married couples with children. single-parent households (618 men , 1,385 women ).
54.0% of residents of Chamblee speak English at home. of residents speak Spanish at home (39% speak English very well , 12% speak English well , 26% speak English not well , 23% don't speak English at all ).of residents speak other Indo-European language at home (81% speak English very well , 14% speak English well , 3% speak English not well , 2% don't speak English at all ).of residents speak Asian or Pacific Island language at home (58% speak English very well , 12% speak English well , 23% speak English not well , 7% don't speak English at all ).of residents speak other language at home (53% speak English very well , 25% speak English well , 9% speak English not well , 13% don't speak English at all ).
Foreign born population: 9,124 (30.4%)of them are naturalized citizens )
Median number of rooms in houses and condos:
Median number of rooms in apartments
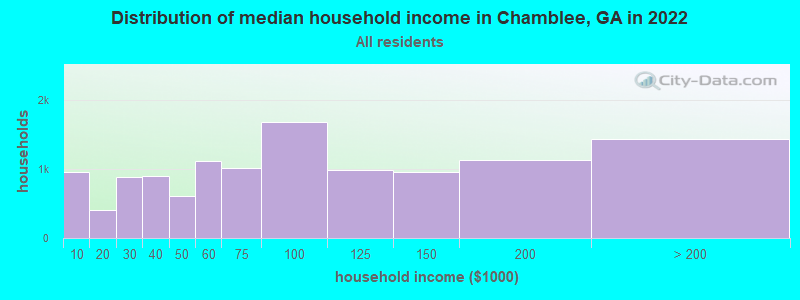
Chamblee, GA household income distribution 961 Less than $10,000407 $10,000 to $19,999883 $20,000 to $29,999897 $30,000 to $39,999612 $40,000 to $49,9991,116 $50,000 to $59,9991,021 $60,000 to $74,9991,680 $75,000 to $99,999979 $100,000 to $124,999955 $125,000 to $149,9991,123 $150,000 to $199,9991,440 $200,000 or more
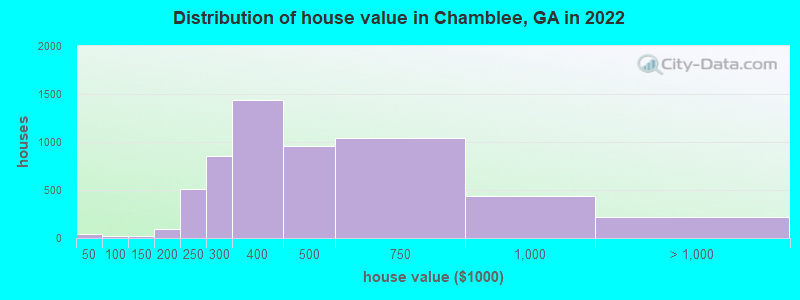
Home value of owner - occupied houses in 2022 in Chamblee, GA 6 Less than $10,00013 $20,000 to $24,99917 $35,000 to $39,9998 $40,000 to $49,99915 $50,000 to $59,9995 $100,000 to $124,99911 $125,000 to $149,99959 $150,000 to $174,99934 $175,000 to $199,999508 $200,000 to $249,999854 $250,000 to $299,9991,435 $300,000 to $399,999961 $400,000 to $499,9991,041 $500,000 to $749,999440 $750,000 to $999,999217 $1,000,000 to $1,499,999Rent paid by renters in 2022 in Chamblee, GA 46 $200 to $24936 $350 to $39911 $450 to $49931 $600 to $649114 $650 to $69957 $700 to $74932 $750 to $799117 $800 to $899120 $900 to $999881 $1,000 to $1,2491,526 $1,250 to $1,4993,242 $1,500 to $1,999805 $2,000 to $2,499186 $2,500 to $2,99936 $3,000 to $3,49923 $3,500 or more185 No cash rent
Percentage of workers working in this county: 58.7%Number of people working at home: 3,985 (22.9% of all workers )
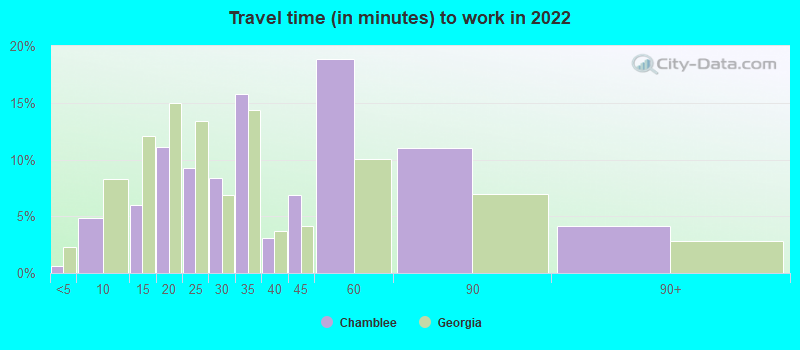
Travel time to work (commute)
Less than 5 minutes: 405 to 9 minutes: 60110 to 14 minutes: 1,08915 to 19 minutes: 2,57620 to 24 minutes: 2,11725 to 29 minutes: 1,00630 to 34 minutes: 2,98335 to 39 minutes: 63840 to 44 minutes: 56645 to 59 minutes: 86360 to 89 minutes: 61290 or more minutes: 145
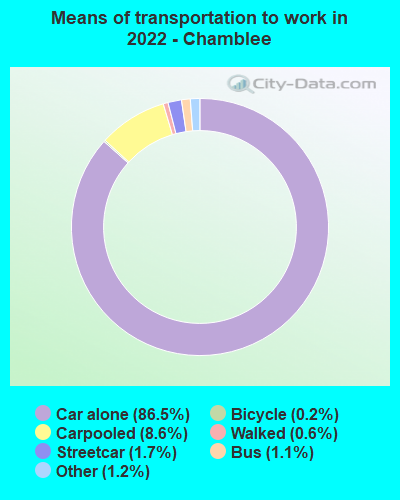
Means of transportation to work:
Drove a car alone: 19,925 (72.4%)Carpooled: 1,799 (6.5%)Bus : 208 (0.8%)Subway or elevated rail : 174 (0.6%)Taxi: 240 (0.9%)Bicycle: 79 (0.3%)Walked: 170 (0.6%)Worked at home: 3,985 (14.5%)
Unemployment by race in 2022
Unemployment rate for White non-Hispanic residents 0.4% Males2.2% FemalesUnemployment rate for Black residents 4.9% Males0.9% FemalesUnemployment rate for American Indian and Alaska Native residents 2.3% Males0.9% FemalesUnemployment rate for other race residents 0.8% Males1.5% FemalesUnemployment rate for two or more race residents 3.5% FemalesUnemployment rate for Hispanic or Latino residents 1.3% Males1.9% Females
Year of entry for the foreign-born population in Chamblee, Georgia
3,657 2010 or later 2,719 2000 to 2009 1,468 1990 to 1999 604 1980 to 1989 123 1970 to 1979 29 Before 1970
First ancestries reported:
American: 3,027 (14.1%)
Ethiopian: 1,016 (4.7%)
Liberian: 574 (2.7%)
English: 570 (2.7%)
Irish: 416 (1.9%)
German: 405 (1.9%)
European: 368 (1.7%)
Nigerian: 307 (1.4%)
French: 224 (1.0%)
Scottish: 153 (0.7%)
Scotch-Irish: 122 (0.6%)
Italian: 102 (0.5%)
African: 91 (0.4%)
Russian: 76 (0.4%)
Greek: 70 (0.3%)
Czech: 68 (0.3%)
Senegalese: 62 (0.3%)
British: 59 (0.3%)
Brazilian: 57 (0.3%)
Welsh: 52 (0.2%)
Turkish: 51 (0.2%)
Iranian: 44 (0.2%)
Croatian: 39 (0.2%)
Scandinavian: 35 (0.2%)
Bermudan: 27 (0.1%)
Cajun: 26 (0.1%)
Dutch: 26 (0.1%)
Hungarian: 25 (0.1%)
Ukrainian: 25 (0.1%)
Egyptian: 18 (0.08%)
Swedish: 18 (0.08%)
Eastern European: 17 (0.08%)
Latvian: 17 (0.08%)
Romanian: 17 (0.08%)
Canadian: 11 (0.05%)
Norwegian: 10 (0.05%)
Yugoslavian: 9 (0.04%)
Polish: 8 (0.04%)
Ugandan: 5 (0.02%)
Swiss: 5 (0.02%) Most common places of birth for foreign-born residents (%): Guatemala Chamblee:
25.8% (2,530)Georgia:
3.6% (39,974)
Mexico Chamblee:
23.4% (2,295)Georgia:
20.0% (223,400)
Ethiopia Chamblee:
7.8% (769)Georgia:
1.6% (17,643)
Liberia Chamblee:
7.8% (765)Georgia:
0.4% (4,350)
Vietnam Chamblee:
4.9% (480)Georgia:
4.1% (45,797)
Honduras Chamblee:
4.8% (467)Georgia:
2.1% (23,500)
China, excluding Hong Kong and Taiwan Chamblee:
3.6% (350)Georgia:
3.5% (39,227)
Nigeria Chamblee:
2.3% (221)Georgia:
2.5% (27,846)
Bangladesh Chamblee:
2.2% (220)Georgia:
0.7% (7,441)
India Chamblee:
1.8% (180)Georgia:
9.2% (103,325)
Korea Chamblee:
1.7% (169)Georgia:
3.9% (43,756)
Ecuador Chamblee:
1.5% (150)Georgia:
0.4% (4,046)
Place of birth for U.S.-born residents:
This state: 12,254Other state: 8,145Northeast: 1,650Midwest: 1,732South: 4,188West: 571 87.2% of Chamblee residents lived in the same house 1 years ago.
Out of people who lived in different houses, 30.6% lived in this county.
Out of people who lived in different counties, 75.6% lived in Georgia.
Chamblee:
87.2%State average:
86.6%
Education attainment for males 25 years and older:
No schooling: 435Nursery to 4th grade: 2175th and 6th grade: 6747th and 8th grade: 2439th grade: 17510th grade: 34811th grade: 8712th grade, no diploma: 63High school graduate (or equivalency): 1,727Less than 1 year of college: 238Some college more than 1 year, no degree: 702Associate degree: 549Bachelor's degree: 2,842Master's degree: 1,495Professional school degree: 235Doctorate degree: 335
Education attainment for females 25 years and older:
No schooling: 490Nursery to 4th grade: 1735th and 6th grade: 3257th and 8th grade: 1249th grade: 10310th grade: 12711th grade: 1312th grade, no diploma: 205High school graduate (or equivalency): 1,679Less than 1 year of college: 626Some college more than 1 year, no degree: 581Associate degree: 463Bachelor's degree: 2,840Master's degree: 1,666Professional school degree: 442Doctorate degree: 110
Housing units in structures:
One, detached: 4,953One, attached: 1,219Two: 3733 or 4: 6195 to 9: 1,28710 to 19: 1,55120 to 49: 1,39050 or more: 2,306Mobile homes: 51Housing units lacking complete plumbing facilities in 2022: 0.2%Housing units lacking complete kitchen facilities in 2022: 0.5%House/condo owner moved in on average 7 years ago
Renter moved in on average 2 years ago
Private vs. public school enrollment:
Students in private schools in grades 1 to 8 (elementary and middle school): 325 Students in private schools in grades 9 to 12 (high school): 122 Students in private undergraduate colleges: 146