Races in Chamblee, Georgia (GA) Detailed Stats
Data:
Races - White alone (%)
Races - White alone (% change since 2000)
Races - Black alone (%)
Races - Black alone (% change since 2000)
Races - American Indian alone (%)
Races - American Indian alone (% change since 2000)
Races - Asian alone (%)
Races - Asian alone (% change since 2000)
Races - Hispanic (%)
Races - Hispanic (% change since 2000)
Races - Native Hawaiian and Other Pacific Islander alone (%)
Races - Native Hawaiian and Other Pacific Islander alone (% change since 2000)
Races - Two or more races(%)
Races - Two or more races(% change since 2000)
Races - Other race alone (%)
Races - Other race alone (% change since 2000)
Racial diversity
Place of birth - Born in state of residence (%)
Place of birth - Born in state of residence (%) - White
Place of birth - Born in state of residence (%) - Black or African American
Place of birth - Born in state of residence (%) - Asian
Place of birth - Born in state of residence (%) - Hispanic or Latino
Place of birth - Born in state of residence (%) - American Indian and Alaska Native
Place of birth - Born in state of residence (%) - Multirace
Place of birth - Born in state of residence (%) - Other Race
Place of birth - Born in other state (%)
Place of birth - Born in other state (%) - White
Place of birth - Born in other state (%) - Black or African American
Place of birth - Born in other state (%) - Asian
Place of birth - Born in other state (%) - Hispanic or Latino
Place of birth - Born in other state (%) - American Indian and Alaska Native
Place of birth - Born in other state (%) - Multirace
Place of birth - Born in other state (%) - Other Race
Place of birth - Native, outside of US (%)
Place of birth - Native, outside of US (%) - White
Place of birth - Native, outside of US (%) - Black or African American
Place of birth - Native, outside of US (%) - Asian
Place of birth - Native, outside of US (%) - Hispanic or Latino
Place of birth - Native, outside of US (%) - American Indian and Alaska Native
Place of birth - Native, outside of US (%) - Multirace
Place of birth - Native, outside of US (%) - Other Race
Place of birth - Foreign born (%)
Place of birth - Foreign born (%) - White
Place of birth - Foreign born (%) - Black or African American
Place of birth - Foreign born (%) - Asian
Place of birth - Foreign born (%) - Hispanic or Latino
Place of birth - Foreign born (%) - American Indian and Alaska Native
Place of birth - Foreign born (%) - Multirace
Place of birth - Foreign born (%) - Other Race
Residents speaking English at home (%)
Residents speaking English at home - Born in the United States (%)
Residents speaking English at home - Native, born elsewhere (%)
Residents speaking English at home - Foreign born (%)
Residents speaking Spanish at home (%)
Residents speaking Spanish at home - Born in the United States (%)
Residents speaking Spanish at home - Native, born elsewhere (%)
Residents speaking Spanish at home - Foreign born (%)
Residents speaking other language at home (%)
Residents speaking other language at home - Born in the United States (%)
Residents speaking other language at home - Native, born elsewhere (%)
Residents speaking other language at home - Foreign born (%)
Marital status - Never married (%)
Marital status - Now married (%)
Marital status - Separated (%)
Marital status - Widowed (%)
Marital status - Divorced (%)
Ancestries Reported - Arab (%)
Ancestries Reported - Czech (%)
Ancestries Reported - Danish (%)
Ancestries Reported - Dutch (%)
Ancestries Reported - English (%)
Ancestries Reported - French (%)
Ancestries Reported - French Canadian (%)
Ancestries Reported - German (%)
Ancestries Reported - Greek (%)
Ancestries Reported - Hungarian (%)
Ancestries Reported - Irish (%)
Ancestries Reported - Italian (%)
Ancestries Reported - Lithuanian (%)
Ancestries Reported - Norwegian (%)
Ancestries Reported - Polish (%)
Ancestries Reported - Portuguese (%)
Ancestries Reported - Russian (%)
Ancestries Reported - Scotch-Irish (%)
Ancestries Reported - Scottish (%)
Ancestries Reported - Slovak (%)
Ancestries Reported - Subsaharan African (%)
Ancestries Reported - Swedish (%)
Ancestries Reported - Swiss (%)
Ancestries Reported - Ukrainian (%)
Ancestries Reported - United States (%)
Ancestries Reported - Welsh (%)
Ancestries Reported - West Indian (%)
Ancestries Reported - Other (%)
Geographical mobility - Same house 1 year ago (%)
Geographical mobility - Same house 1 year ago (%) - White
Geographical mobility - Same house 1 year ago (%) - Black or African American
Geographical mobility - Same house 1 year ago (%) - Asian
Geographical mobility - Same house 1 year ago (%) - Hispanic or Latino
Geographical mobility - Same house 1 year ago (%) - American Indian and Alaska Native
Geographical mobility - Same house 1 year ago (%) - Multirace
Geographical mobility - Same house 1 year ago (%) - Other Race
Geographical mobility - Moved within same county (%)
Geographical mobility - Moved within same county (%) - White
Geographical mobility - Moved within same county (%) - Black or African American
Geographical mobility - Moved within same county (%) - Asian
Geographical mobility - Moved within same county (%) - Hispanic or Latino
Geographical mobility - Moved within same county (%) - American Indian and Alaska Native
Geographical mobility - Moved within same county (%) - Multirace
Geographical mobility - Moved within same county (%) - Other Race
Geographical mobility - Moved from different county within same state (%)
Geographical mobility - Moved from different county within same state (%) - White
Geographical mobility - Moved from different county within same state (%) - Black or African American
Geographical mobility - Moved from different county within same state (%) - Asian
Geographical mobility - Moved from different county within same state (%) - Hispanic or Latino
Geographical mobility - Moved from different county within same state (%) - American Indian and Alaska Native
Geographical mobility - Moved from different county within same state (%) - Multirace
Geographical mobility - Moved from different county within same state (%) - Other Race
Geographical mobility - Moved from different state (%)
Geographical mobility - Moved from different state (%) - White
Geographical mobility - Moved from different state (%) - Black or African American
Geographical mobility - Moved from different state (%) - Asian
Geographical mobility - Moved from different state (%) - Hispanic or Latino
Geographical mobility - Moved from different state (%) - American Indian and Alaska Native
Geographical mobility - Moved from different state (%) - Multirace
Geographical mobility - Moved from different state (%) - Other Race
Geographical mobility - Moved from abroad (%)
Geographical mobility - Moved from abroad (%) - White
Geographical mobility - Moved from abroad (%) - Black or African American
Geographical mobility - Moved from abroad (%) - Asian
Geographical mobility - Moved from abroad (%) - Hispanic or Latino
Geographical mobility - Moved from abroad (%) - American Indian and Alaska Native
Geographical mobility - Moved from abroad (%) - Multirace
Geographical mobility - Moved from abroad (%) - Other Race
Place of birth for the foreign-born population - Ireland (%)
Place of birth for the foreign-born population - Denmark (%)
Place of birth for the foreign-born population - Norway (%)
Place of birth for the foreign-born population - Sweden (%)
Place of birth for the foreign-born population - United Kingdom (%)
Place of birth for the foreign-born population - England (%)
Place of birth for the foreign-born population - Scotland (%)
Place of birth for the foreign-born population - Other Northern Europe (%)
Place of birth for the foreign-born population - Austria (%)
Place of birth for the foreign-born population - Belgium (%)
Place of birth for the foreign-born population - France (%)
Place of birth for the foreign-born population - Germany (%)
Place of birth for the foreign-born population - Netherlands (%)
Place of birth for the foreign-born population - Switzerland (%)
Place of birth for the foreign-born population - Other Western Europe (%)
Place of birth for the foreign-born population - Greece (%)
Place of birth for the foreign-born population - Italy (%)
Place of birth for the foreign-born population - Portugal (%)
Place of birth for the foreign-born population - Spain (%)
Place of birth for the foreign-born population - Other Southern Europe (%)
Place of birth for the foreign-born population - Albania (%)
Place of birth for the foreign-born population - Belarus (%)
Place of birth for the foreign-born population - Bosnia and Herzegovina (%)
Place of birth for the foreign-born population - Bulgaria (%)
Place of birth for the foreign-born population - Croatia (%)
Place of birth for the foreign-born population - Czechoslovakia (%)
Place of birth for the foreign-born population - Hungary (%)
Place of birth for the foreign-born population - Latvia (%)
Place of birth for the foreign-born population - Lithuania (%)
Place of birth for the foreign-born population - North Macedonia (Macedonia) (%)
Place of birth for the foreign-born population - Moldova (%)
Place of birth for the foreign-born population - Poland (%)
Place of birth for the foreign-born population - Romania (%)
Place of birth for the foreign-born population - Russia (%)
Place of birth for the foreign-born population - Serbia (%)
Place of birth for the foreign-born population - Ukraine (%)
Place of birth for the foreign-born population - Other Eastern Europe (%)
Place of birth for the foreign-born population - China (%)
Place of birth for the foreign-born population - Hong Kong (%)
Place of birth for the foreign-born population - Taiwan (%)
Place of birth for the foreign-born population - Japan (%)
Place of birth for the foreign-born population - Korea (%)
Place of birth for the foreign-born population - Other Eastern Asia (%)
Place of birth for the foreign-born population - Afghanistan (%)
Place of birth for the foreign-born population - Bangladesh (%)
Place of birth for the foreign-born population - India (%)
Place of birth for the foreign-born population - Iran (%)
Place of birth for the foreign-born population - Kazakhstan (%)
Place of birth for the foreign-born population - Nepal (%)
Place of birth for the foreign-born population - Pakistan (%)
Place of birth for the foreign-born population - Sri Lanka (%)
Place of birth for the foreign-born population - Uzbekistan (%)
Place of birth for the foreign-born population - Other South Central Asia (%)
Place of birth for the foreign-born population - Burma (%)
Place of birth for the foreign-born population - Cambodia (%)
Place of birth for the foreign-born population - Indonesia (%)
Place of birth for the foreign-born population - Laos (%)
Place of birth for the foreign-born population - Malaysia (%)
Place of birth for the foreign-born population - Philippines (%)
Place of birth for the foreign-born population - Singapore (%)
Place of birth for the foreign-born population - Thailand (%)
Place of birth for the foreign-born population - Vietnam (%)
Place of birth for the foreign-born population - Other South Eastern Asia (%)
Place of birth for the foreign-born population - Armenia (%)
Place of birth for the foreign-born population - Iraq (%)
Place of birth for the foreign-born population - Israel (%)
Place of birth for the foreign-born population - Jordan (%)
Place of birth for the foreign-born population - Kuwait (%)
Place of birth for the foreign-born population - Lebanon (%)
Place of birth for the foreign-born population - Saudi Arabia (%)
Place of birth for the foreign-born population - Syria (%)
Place of birth for the foreign-born population - Turkey (%)
Place of birth for the foreign-born population - Yemen (%)
Place of birth for the foreign-born population - Other Western Asia (%)
Place of birth for the foreign-born population - Eritrea (%)
Place of birth for the foreign-born population - Ethiopia (%)
Place of birth for the foreign-born population - Kenya (%)
Place of birth for the foreign-born population - Somalia (%)
Place of birth for the foreign-born population - Uganda (%)
Place of birth for the foreign-born population - Zimbabwe (%)
Place of birth for the foreign-born population - Other Eastern Africa (%)
Place of birth for the foreign-born population - Cameroon (%)
Place of birth for the foreign-born population - Congo (%)
Place of birth for the foreign-born population - Democratic Republic of Congo (Zaire) (%)
Place of birth for the foreign-born population - Other Middle Africa (%)
Place of birth for the foreign-born population - Egypt (%)
Place of birth for the foreign-born population - Morocco (%)
Place of birth for the foreign-born population - Sudan (%)
Place of birth for the foreign-born population - Other Northern Africa (%)
Place of birth for the foreign-born population - South Africa (%)
Place of birth for the foreign-born population - Other Southern Africa (%)
Place of birth for the foreign-born population - Cabo Verde (%)
Place of birth for the foreign-born population - Ghana (%)
Place of birth for the foreign-born population - Liberia (%)
Place of birth for the foreign-born population - Nigeria (%)
Place of birth for the foreign-born population - Senegal (%)
Place of birth for the foreign-born population - Sierra Leone (%)
Place of birth for the foreign-born population - Other Western Africa (%)
Place of birth for the foreign-born population - Australia (%)
Place of birth for the foreign-born population - New Zealand (%)
Place of birth for the foreign-born population - Fiji (%)
Place of birth for the foreign-born population - Micronesia (%)
Place of birth for the foreign-born population - Bahamas (%)
Place of birth for the foreign-born population - Barbados (%)
Place of birth for the foreign-born population - Cuba (%)
Place of birth for the foreign-born population - Dominica (%)
Place of birth for the foreign-born population - Dominican Republic (%)
Place of birth for the foreign-born population - Grenada (%)
Place of birth for the foreign-born population - Haiti (%)
Place of birth for the foreign-born population - Jamaica (%)
Place of birth for the foreign-born population - St. Vincent and the Grenadines (%)
Place of birth for the foreign-born population - Trinidad and Tobago (%)
Place of birth for the foreign-born population - West Indies (%)
Place of birth for the foreign-born population - Other Caribbean (%)
Place of birth for the foreign-born population - Belize (%)
Place of birth for the foreign-born population - Costa Rica (%)
Place of birth for the foreign-born population - El Salvador (%)
Place of birth for the foreign-born population - Guatemala (%)
Place of birth for the foreign-born population - Honduras (%)
Place of birth for the foreign-born population - Mexico (%)
Place of birth for the foreign-born population - Nicaragua (%)
Place of birth for the foreign-born population - Panama (%)
Place of birth for the foreign-born population - Other Central America (%)
Place of birth for the foreign-born population - Argentina (%)
Place of birth for the foreign-born population - Bolivia (%)
Place of birth for the foreign-born population - Brazil (%)
Place of birth for the foreign-born population - Chile (%)
Place of birth for the foreign-born population - Colombia (%)
Place of birth for the foreign-born population - Ecuador (%)
Place of birth for the foreign-born population - Guyana (%)
Place of birth for the foreign-born population - Peru (%)
Place of birth for the foreign-born population - Uruguay (%)
Place of birth for the foreign-born population - Venezuela (%)
Place of birth for the foreign-born population - Other South America (%)
Place of birth for the foreign-born population - Canada (%)
Place of birth for the foreign-born population - Other Northern America (%)
Place of birth for the foreign-born population - Other (%)
Latest news about races in Chamblee, GA collected exclusively by city-data.com from local newspapers, TV, and radio stations
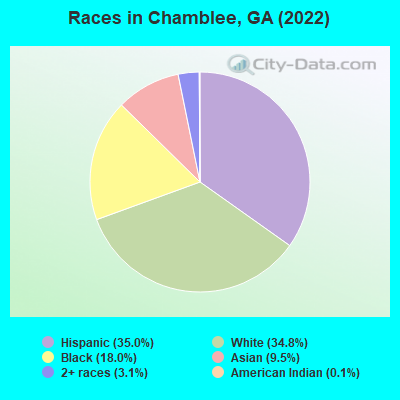
According to 2022 data, the most numerous races in Chamblee, GA are White alone (10,443 residents), Black alone (5,421 residents), and Hispanic (10,510 residents). 54.2% of Chamblee residents speak English at home. 32.6% of Chamblee, GA residents are foreign-born (18.9% born in Latin America, 6.3% born in Asia, 4.9% born in Africa), which is 69.4% greater than the foreign-born rate of 10.0% across the entire state of Georgia.
Race distribution in Chamblee
2000 2022
5,128,661 62.6% White alone 2,331,465 28.5% Black alone 435,227 5.3% Hispanic 171,513 2.1% Asian alone 87,364 1.1% Two or more races 17,670 0.2% American Indian alone 11,275 0.1% Other race alone 3,278 0.04% Native Hawaiian and Other
5,415,657 49.6% White alone 3,349,240 30.7% Black alone 1,132,604 10.4% Hispanic 479,156 4.4% Asian alone 462,923 4.2% Two or more races 54,416 0.5% Other race alone 11,923 0.1% American Indian alone 6,957 0.06% Native Hawaiian and Other
Income and house value in Chamblee Median household income in 2022 $104,558 White non-Hispanic householders$69,306 Black householders$35,768 American Indian and Alaska Native householders$69,928 Asian householders$33,067 Some other race householders$55,455 Two or more races householders$49,447 Hispanic or Latino race householdersMedian 2022 house value $468,370 White Non-Hispanic householders$222,111 Black or African American householders $224,123 Asian householders$301,850 Some other race householders$565,969 Two or more races householders$432,400 Hispanic or Latino householders
Median age by race in Chamblee
35.4 Median age for White residents35.8 34.6 37.0 Median age for Black or African American residents32.7 39.3 20.0 Median age for American Indian / Alaska Native residents27.5 16.5 36.1 Median age for Asian residents32.1 42.2 -657,243,815.6 Median age for Native Hawaiian / Pacific Islander residents-693,227,090.9 -776,776,776.0 22.4 Median age for Other race residents22.1 25.3 30.0 Median age for Two or more races residents25.9 30.4 36.9 Median age for White alone residents38.8 35.7 26.1 Median age for Hispanic or Latino residents26.8 25.8
Owner/renter occupied households by race in Chamblee
House owners and renters - White residents 3,324 55.8% Owner occupied2,636 44.2% Renter occupiedHouse owners and renters - Black or African American residents 477 17.5% Owner occupied2,244 82.5% Renter occupiedHouse owners and renters - American Indian / Alaska Native residents 76 27.2% Owner occupied205 72.8% Renter occupiedHouse owners and renters - Asian residents 781 73.2% Owner occupied286 26.8% Renter occupiedHouse owners and renters - Other race residents 153 21.8% Owner occupied548 78.2% Renter occupiedHouse owners and renters - Two or more races residents 276 19.6% Owner occupied1,135 80.4% Renter occupiedHouse owners and renters - White alone residents 3,287 60.5% Owner occupied2,146 39.5% Renter occupiedHouse owners and renters - Hispanic or Latino residents 381 14.9% Owner occupied2,174 85.1% Renter occupied
Language usage in Chamblee
English speakers - Total 54.2% of residents of Chamblee speak English at home.
27.2% of residents speak Spanish at home 3,064 40.4% Speak English very well4,523 59.6% Speak English less than very well15.2% of residents speak other language at home 2,925 69.0% Speak English very well1,313 31.0% Speak English less than very well
English speakers - Born in the United States 90.6% of residents of Chamblee speak English at home.
5.8% of residents speak Spanish at home 397 85.2% Speak English very well69 14.8% Speak English less than very well3.6% of residents speak other language at home 167 57.6% Speak English very well123 42.4% Speak English less than very well
English speakers - Native, born elsewhere 47.6% of residents of Chamblee speak English at home.
16.8% of residents speak Spanish at home 56 100.0% Speak English very well47.3% of residents speak other language at home 152 96.2% Speak English very well6 3.8% Speak English less than very well
English speakers - Foreign-born 10.2% of residents of Chamblee speak English at home.
48.5% of residents speak Spanish at home 789 17.9% Speak English very well3,628 82.1% Speak English less than very well34.1% of residents speak other language at home 2,000 64.3% Speak English very well1,109 35.7% Speak English less than very well
White (Caucasian) - Speak only English Native:
92.4% (9,258)Foreign-born:
7.2% (106)
White (Caucasian) - Speak another language Native:
6.1% (615)Foreign-born:
84.8% (1,252)
Black or African American - Speak only English Native:
97.9% (3,776)Foreign-born:
25.7% (398)
Black or African American - Speak another language Native:
1.8% (69)Foreign-born:
73.8% (1,144)
American Indian / Alaska Native - Speak another language Native:
53.4% (240)Foreign-born:
99.9% (631)
Asian - Speak only English Native:
44.0% (481)Foreign-born:
11.2% (182)
Asian - Speak another language Native:
56.2% (613)Foreign-born:
87.9% (1,434)
Other race - Speak only English Native:
16.5% (231)Foreign-born:
7.3% (106)
Other race - Speak another language Native:
93.2% (1,309)Foreign-born:
92.6% (1,344)
Two or more races - Speak only English Native:
29.5% (734)Foreign-born:
5.2% (100)
Two or more races - Speak another language Native:
60.7% (1,509)Foreign-born:
92.0% (1,750)
White alone - Speak only English Native:
97.8% (9,190)Foreign-born:
16.5% (84)
White alone - Speak another language Native:
2.3% (214)Foreign-born:
86.9% (440)
Hispanic or Latino - Speak only English Native:
14.0% (612)Foreign-born:
3.0% (144)
Hispanic or Latino - Speak another language Native:
78.3% (3,420)Foreign-born:
96.3% (4,627)
Foreign-born residents in Chamblee 9,804 residents are foreign born (18.9% Latin America , 6.3% Asia , 4.9% Africa ).
This city:
32.6%Georgia:
10.4%
Marital status for residents in Chamblee Marital status - White (Caucasian) population 15 years and over
Males 48.9% Never married40.3% Now married0.3% Separated2.5% Widowed7.9% DivorcedFemales 39.9% Never married44.6% Now married0.4% Separated1.2% Widowed14.0% DivorcedWomen who gave birth in the past 12 months Now married:
92.3% (125)Unmarried:
7.7% (10)
Women who did not give birth in the past 12 months Now married:
40.7% (1,447)Unmarried:
59.3% (2,105)
Marital status - Black or African American population 15 years and over
Males 54.7% Never married36.2% Now married2.5% Separated1.2% Widowed5.3% DivorcedFemales 55.8% Never married22.5% Now married2.7% Separated6.3% Widowed12.7% DivorcedWomen who gave birth in the past 12 months Now married:
100.0% (18)Unmarried:
0.0% (0)
Women who did not give birth in the past 12 months Now married:
26.5% (638)Unmarried:
73.5% (1,767)
Marital status - American Indian / Alaska Native population 15 years and over
Males 48.8% Never married38.3% Now married4.2% Separated8.7% Widowed0.0% DivorcedFemales 60.1% Never married35.1% Now married4.8% Separated0.0% Widowed0.0% DivorcedWomen who gave birth in the past 12 months Now married:
100.0% (52)Unmarried:
0.0% (0)
Women who did not give birth in the past 12 months Now married:
22.2% (119)Unmarried:
77.8% (417)
Marital status - Asian population 15 years and over
Males 50.6% Never married42.1% Now married0.0% Separated0.0% Widowed7.2% DivorcedFemales 25.3% Never married62.4% Now married1.5% Separated8.7% Widowed2.2% DivorcedWomen who gave birth in the past 12 months Now married:
100.0% (65)Unmarried:
0.0% (0)
Women who did not give birth in the past 12 months Now married:
60.1% (406)Unmarried:
39.9% (270)
Marital status - Other race population 15 years and over
Males 49.6% Never married34.7% Now married4.8% Separated1.0% Widowed10.0% DivorcedFemales 43.6% Never married41.0% Now married0.0% Separated3.2% Widowed12.3% DivorcedWomen who gave birth in the past 12 months Now married:
35.7% (7)Unmarried:
64.3% (13)
Women who did not give birth in the past 12 months Now married:
49.0% (320)Unmarried:
51.0% (334)
Marital status - Two or more races population 15 years and over
Males 61.8% Never married32.1% Now married1.3% Separated1.2% Widowed3.6% DivorcedFemales 47.4% Never married31.8% Now married3.2% Separated0.1% Widowed17.5% DivorcedWomen who gave birth in the past 12 months Now married:
100.0% (39)Unmarried:
0.0% (0)
Women who did not give birth in the past 12 months Now married:
35.7% (427)Unmarried:
64.3% (770)
Marital status - White alone, not Hispanic / Latino population 15 years and over
Males 42.4% Never married45.6% Now married0.4% Separated2.6% Widowed8.9% DivorcedFemales 38.2% Never married45.8% Now married0.4% Separated1.3% Widowed14.2% DivorcedWomen who gave birth in the past 12 months Now married:
89.4% (92)Unmarried:
10.6% (11)
Women who did not give birth in the past 12 months Now married:
40.3% (1,274)Unmarried:
59.7% (1,890)
Marital status - Hispanic or Latino population 15 years and over
Males 61.6% Never married29.9% Now married1.6% Separated2.2% Widowed4.7% DivorcedFemales 49.4% Never married36.4% Now married1.6% Separated0.6% Widowed12.1% DivorcedWomen who gave birth in the past 12 months Now married:
92.7% (119)Unmarried:
7.3% (9)
Women who did not give birth in the past 12 months Now married:
38.5% (901)Unmarried:
61.5% (1,443)
Ancestries in Chamblee
3,027 14.1% American1,016 4.7% Ethiopian574 2.7% Liberian570 2.7% English416 1.9% Irish405 1.9% German368 1.7% European307 1.4% Nigerian224 1.0% French153 0.7% Scottish122 0.6% Scotch-Irish102 0.5% Italian91 0.4% African76 0.4% Russian70 0.3% Greek68 0.3% Czech62 0.3% Senegalese59 0.3% British57 0.3% Brazilian52 0.2% Welsh51 0.2% Turkish44 0.2% Iranian39 0.2% Croatian35 0.2% Scandinavian27 0.1% Bermudan26 0.1% Cajun26 0.1% Dutch25 0.1% Hungarian25 0.1% Ukrainian18 0.08% Egyptian18 0.08% Swedish17 0.08% Eastern European17 0.08% Latvian17 0.08% Romanian11 0.05% Canadian10 0.05% Norwegian9 0.04% Yugoslavian8 0.04% Polish5 0.02% Ugandan5 0.02% Swiss
Geographical mobility in Chamblee Same house 1 year ago 10,766 83.4% White (Caucasian)4,685 86.6% Black or African American823 77.9% American Indian / Alaska Native2,653 92.6% Asian2,917 91.7% Other race4,642 92.1% Two or more races8,371 81.2% White alone, not Hispanic / Latino9,155 88.7% Hispanic or LatinoMoved within same county 1,085 8.4% White / Caucasian322 6.0% Black or African American3 0.3% American Indian / Alaska Native37 1.3% Asian46 1.5% Other race227 4.5% Two or more races976 9.5% White alone, not Hispanic / Latino242 2.3% Hispanic or LatinoMoved within same state 706 5.5% White / Caucasian205 3.8% Black or African American10 1.0% American Indian / Alaska Native135 4.7% Asian205 4.1% Two or more races636 6.2% White alone, not Hispanic / Latino412 4.0% Hispanic or LatinoMoved from different state 278 2.2% White / Caucasian177 3.3% Black or African American13 0.4% Asian35 1.1% Other race13 0.3% Two or more races286 2.8% White alone, not Hispanic / Latino35 0.3% Hispanic or LatinoMoved from abroad 48 0.4% White171 16.2% American Indian / Alaska Native64 2.2% Asian41 0.4% White alone, not Hispanic / Latino250 2.4% Hispanic or Latino
Children Nativity (place of birth) in Chamblee
Children under 6 years - Living with two parents Both parents native 881 100.0% NativeBoth parents foreign-born 809 99.0% Native8 1.0% Foreign-bornOne native, one foreign-born parent 248 100.0% NativeChildren under 6 years - Living with one parent Native parent 205 100.0% NativeForeign-born parent 283 93.4% Native20 6.6% Foreign-bornChildren 6 to 17 years - Living with two parents Both parents native 482 99.4% Native3 0.6% Foreign-bornBoth parents foreign-born 1,123 91.0% Native111 9.0% Foreign-bornOne native, one foreign-born parent 367 99.2% Native3 0.8% Foreign-bornChildren 6 to 17 years - Living with one parent Native parent 628 100.0% NativeForeign-born parent 1,267 49.4% Native1,296 50.6% Foreign-born
Grandparents responsible for own grandchildren in Chamblee
Grandparents (30 to 59 years) White / Caucasian 35 100.0% Not responsible for grandchildrenBlack or African American 20 38.5% Responsible for grandchildren32 61.5% Not responsible for grandchildrenAsian 14 100.0% Not responsible for grandchildrenOther race 67 100.0% Responsible for grandchildrenTwo or more races 19 100.0% Not responsible for grandchildrenHispanic or Latino 65 56.3% Responsible for grandchildren51 43.7% Not responsible for grandchildrenGrandparents (60 years and over) White / Caucasian 32 39.0% Responsible for grandchildren50 61.0% Not responsible for grandchildrenBlack or African American 11 100.0% Not responsible for grandchildrenAsian 174 71.2% Responsible for grandchildren70 28.8% Not responsible for grandchildrenTwo or more races 13 90.5% Responsible for grandchildren1 9.5% Not responsible for grandchildrenHispanic or Latino 10 16.1% Responsible for grandchildren54 83.9% Not responsible for grandchildren