Addison, IL (Illinois) Houses and Residents
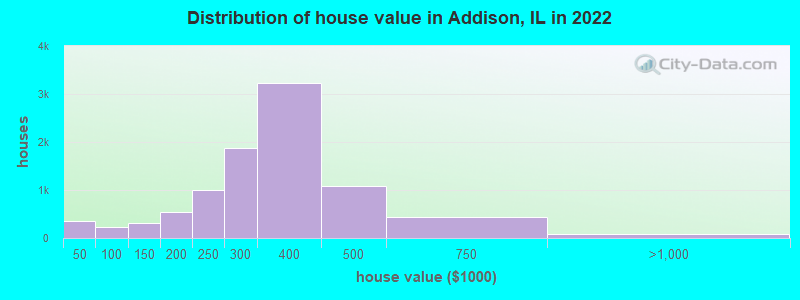
Estimated median house or condo value in 2022: $304,167 (it was $169,700 in 2000 )
Addison:
$304,167Illinois:
$251,600
Lower value quartile - upper value quartile: $246,385 - $379,539Mean price in 2022: Detached houses: $355,982 Here:
$355,982State:
$310,164
Townhouses or other attached units: $271,196 Here:
$271,196State:
$286,230
In 2-unit structures: $324,539 Here:
$324,539State:
$299,638
In 3-to-4-unit structures: $315,036 Here:
$315,036State:
$330,907
In 5-or-more-unit structures: $186,390 Here:
$186,390State:
$318,887
Total population: 37,297 (Urban population: 35,709, Rural population: 0)
Houses: 13,519 (13,133 occupied: 8,759 owner occupied, 4,387 renter occupied )
% of renters here:
33%State:
33%
Housing density: 1,433 houses/condos per square mile
Median price asked for vacant for-sale houses and condos in 2022: $230,188.
Median contract rent in 2022: $1,108 (lower quartile is $964, upper quartile is $1,291)
Median rent asked for vacant for-rent units in 2022: $1,227
Median gross rent in Addison, IL in 2022: $1,176
Housing units in Addison with a mortgage: 5,051 (350 second mortgage, 0 home equity loan, 310 both second mortgage and home equity loan )Houses without a mortgage: 206
Median household income for houses/condos with a mortgage: $104,198
Median household income for apartments without a mortgage: $83,404
Median monthly housing costs: $1,264
Data:
Median house or condo value ($)
Median house or condo value ($ change since 2000)
Median house or condo value ($) - White
Median house or condo value ($) - Black or African American
Median house or condo value ($) - Asian
Median house or condo value ($) - Hispanic or Latino
Median house or condo value ($) - American Indian and Alaska Native
Median house or condo value ($) - Multirace
Median house or condo value ($) - Other Race
Median price asked for mobile homes ($)
Household density (households per square mile)
Mean house or condo value by units in structure - 1, detached ($)
Mean house or condo value by units in structure - 1, attached ($)
Mean house or condo value by units in structure - 2 ($)
Mean house or condo value by units in structure by units in structure - 3 or 4 ($)
Mean house or condo value by units in structure - 5 or more ($)
Mean house or condo value by units in structure - Boat, RV, van, etc. ($)
Mean house or condo value by units in structure - Mobile home ($)
Median contract rent ($)
Median contract rent - Lower quartile ($)
Median contract rent - Upper quartile ($)
Median gross rent ($)
Urban houses (%)
Rural houses (%)
Houses occupied (%)
Houses occupied (% change since 2000)
Houses owner occupied (%)
Houses owner occupied (% change since 2000)
Houses renter occupied (%)
Houses renter occupied (% change since 2000)
Vacant housing units - For rent (%)
Vacant housing units - For rent (% change since 2000)
Vacant housing units - For sale only (%)
Vacant housing units - For sale only (% change since 2000)
Vacant housing units - Rented or sold, not occupied (%)
Vacant housing units - Rented or sold, not occupied (% change since 2000)
Vacant housing units - For seasonal, recreational, or occasional use (%)
Vacant housing units - For seasonal, recreational, or occasional use (% change since 2000)
Vacant housing units - For migrant workers (%)
Vacant housing units - For migrant workers (% change since 2000)
Vacant housing units - Other vacant (%)
Vacant housing units - Other vacant (% change since 2000)
Median monthly housing costs ($)
Median household income for houses/condos with a mortgage ($)
Median household income for houses/condos without a mortgage ($)
Median household income ($)
Median household income ($) - White
Median household income ($) - Black or African American
Median household income ($) - Asian
Median household income ($) - Hispanic or Latino
Median household income ($) - American Indian and Alaska Native
Median household income ($) - Multirace
Median household income ($) - Other Race
Mortgage status - with mortgage (%)
Mortgage status - with second mortgage (%)
Mortgage status - with home equity loan (%)
Mortgage status - with both second mortgage and home equity loan (%)
Mortgage status - without a mortgage (%)
Median year house/condo built
Median year apartment built
Household type by relationship - Male householder living alone (%)
Household type by relationship - Male householder not living alone (%)
Household type by relationship - Female householder living alone (%)
Household type by relationship - Female householder not living alone (%)
Household type by relationship - Opposite-Sex spouse (%)
Household type by relationship - Same-Sex spouse (%)
Household type by relationship - Opposite-Sex unmarried partner (%)
Household type by relationship - Same-Sex unmarried partner (%)
Household type by relationship - In group quarters (%)
Size of family households - 2-person household (%)
Size of family households - 3-person household (%)
Size of family households - 4-person household (%)
Size of family households - 5-person household (%)
Size of family households - 6-person household (%)
Size of family households - 7-or-more-person household (%)
Size of nonfamily households - 1-person household (%)
Size of nonfamily households - 2-person household (%)
Size of nonfamily households - 3-person household (%)
Size of nonfamily households - 4-person household (%)
Size of nonfamily households - 5-person household (%)
Size of nonfamily households - 6-person household (%)
Size of nonfamily households - 7-or-moreperson household (%)
Year house built - Built 2010 or later (%)
Year house built - Built 2000 to 2009 (%)
Year house built - Built 1990 to 1999 (%)
Year house built - Built 1980 to 1989 (%)
Year house built - Built 1970 to 1979 (%)
Year house built - Built 1960 to 1969 (%)
Year house built - Built 1950 to 1959 (%)
Year house built - Built 1940 to 1949 (%)
Year house built - Built 1939 or earlier (%)
Median number of rooms in houses and condos
Median number of rooms in apartments
Median number of bedrooms in owner occupied houses
Mean number of bedrooms in owner occupied houses
Median number of bedrooms in renter occupied houses
Mean number of bedrooms in renter occupied houses
Median number of vehichles in owner occupied houses
Mean number of vehichles in owner occupied houses
Median number of vehichles in renter occupied houses
Mean number of vehichles in renter occupied houses
Rooms in owner-occupied houses - 1 room (%)
Rooms in owner-occupied houses - 2 rooms (%)
Rooms in owner-occupied houses - 3 rooms (%)
Rooms in owner-occupied houses - 4 rooms (%)
Rooms in owner-occupied houses - 5 rooms (%)
Rooms in owner-occupied houses - 6 rooms (%)
Rooms in owner-occupied houses - 7 rooms (%)
Rooms in owner-occupied houses - 8 rooms (%)
Rooms in owner-occupied houses - 9+ rooms (%)
Rooms in renter-occupied houses - 1 room (%)
Rooms in renter-occupied houses - 2 rooms (%)
Rooms in renter-occupied houses - 3 rooms (%)
Rooms in renter-occupied houses - 4 rooms (%)
Rooms in renter-occupied houses - 5 rooms (%)
Rooms in renter-occupied houses - 6 rooms (%)
Rooms in renter-occupied houses - 7 rooms (%)
Rooms in renter-occupied houses - 8 rooms (%)
Rooms in renter-occupied houses - 9+ rooms (%)
Bedrooms in owner-occupied houses - no bedrooms (%)
Bedrooms in owner-occupied houses - 1 bedroom (%)
Bedrooms in owner-occupied houses - 2 bedrooms (%)
Bedrooms in owner-occupied houses - 3 bedrooms (%)
Bedrooms in owner-occupied houses - 4 bedrooms (%)
Bedrooms in owner-occupied houses - 5+ bedrooms (%)
Bedrooms in renter-occupied houses - no bedrooms (%)
Bedrooms in renter-occupied houses - 1 bedroom (%)
Bedrooms in renter-occupied houses - 2 bedrooms (%)
Bedrooms in renter-occupied houses - 3 bedrooms (%)
Bedrooms in renter-occupied houses - 4 bedrooms (%)
Bedrooms in renter-occupied houses - 5+ bedrooms (%)
Vehicles available in owner-occupied houses - no vehicle available (%)
Vehicles available in owner-occupied houses - 1 vehicle available(%)
Vehicles available in owner-occupied houses - 2 Vehicles available (%)
Vehicles available in owner-occupied houses - 3 Vehicles available (%)
Vehicles available in owner-occupied houses - 4 Vehicles available (%)
Vehicles available in owner-occupied houses - 5+ Vehicles available (%)
Vehicles available in renter-occupied houses - no vehicle available (%)
Vehicles available in renter-occupied houses - 1 vehicle available (%)
Vehicles available in renter-occupied houses - 2 Vehicles available (%)
Vehicles available in renter-occupied houses - 3 Vehicles available (%)
Vehicles available in renter-occupied houses - 4 Vehicles available (%)
Vehicles available in renter-occupied houses - 5+ Vehicles available (%)
Housing units in structures - 1, detached (%)
Housing units in structures - 1, attached (%)
Housing units in structures - 2 (%)
Housing units in structures - 3 or 4 (%)
Housing units in structures - 5 to 9 (%)
Housing units in structures - 10 to 19 (%)
Housing units in structures - 20 to 49 (%)
Housing units in structures - 50 or more (%)
Housing units in structures - Mobile home (%)
Housing units in structures - Boat, RV, van, etc. (%)
Housing units in structures - Owners - 1, detached (%)
Housing units in structures - Owners - 1, attached (%)
Housing units in structures - Owners - 2 (%)
Housing units in structures - Owners - 3 or 4 (%)
Housing units in structures - Owners - 5 to 9 (%)
Housing units in structures - Owners - 10 to 19 (%)
Housing units in structures - Owners - 20 to 49 (%)
Housing units in structures - Owners - 50 or more (%)
Housing units in structures - Owners - Mobile home (%)
Housing units in structures - Owners - Boat, RV, van, etc. (%)
Housing units in structures - Renters - 1, detached (%)
Housing units in structures - Renters - 1, attached (%)
Housing units in structures - Renters - 2 (%)
Housing units in structures - Renters - 3 or 4 (%)
Housing units in structures - Renters - 5 to 9 (%)
Housing units in structures - Renters - 10 to 19 (%)
Housing units in structures - Renters - 20 to 49 (%)
Housing units in structures - Renters - 50 or more (%)
Housing units in structures - Renters - Mobile home (%)
Housing units in structures - Renters - Boat, RV, van, etc. (%)
House/condo owner moved in on average (years ago)
Renter moved in on average (years ago)
Year householder moved into unit - Moved in 1999 to March 2000 (%)
Year householder moved into unit - Moved in 1999 to March 2000 (%) - White
Year householder moved into unit - Moved in 1999 to March 2000 (%) - Black or African American
Year householder moved into unit - Moved in 1999 to March 2000 (%) - Asian
Year householder moved into unit - Moved in 1999 to March 2000 (%) - Hispanic or Latino
Year householder moved into unit - Moved in 1999 to March 2000 (%) - American Indian and Alaska Native
Year householder moved into unit - Moved in 1999 to March 2000 (%) - Multirace
Year householder moved into unit - Moved in 1999 to March 2000 (%) - Other Race
Year householder moved into unit - Moved in 1995 to 1998 (%)
Year householder moved into unit - Moved in 1995 to 1998 (%) - White
Year householder moved into unit - Moved in 1995 to 1998 (%) - Black or African American
Year householder moved into unit - Moved in 1995 to 1998 (%) - Asian
Year householder moved into unit - Moved in 1995 to 1998 (%) - Hispanic or Latino
Year householder moved into unit - Moved in 1995 to 1998 (%) - American Indian and Alaska Native
Year householder moved into unit - Moved in 1995 to 1998 (%) - Multirace
Year householder moved into unit - Moved in 1995 to 1998 (%) - Other Race
Year householder moved into unit - Moved in 1990 to 1994 (%)
Year householder moved into unit - Moved in 1990 to 1994 (%) - White
Year householder moved into unit - Moved in 1990 to 1994 (%) - Black or African American
Year householder moved into unit - Moved in 1990 to 1994 (%) - Asian
Year householder moved into unit - Moved in 1990 to 1994 (%) - Hispanic or Latino
Year householder moved into unit - Moved in 1990 to 1994 (%) - American Indian and Alaska Native
Year householder moved into unit - Moved in 1990 to 1994 (%) - Multirace
Year householder moved into unit - Moved in 1990 to 1994 (%) - Other Race
Year householder moved into unit - Moved in 1980 to 1989 (%)
Year householder moved into unit - Moved in 1980 to 1989 (%) - White
Year householder moved into unit - Moved in 1980 to 1989 (%) - Black or African American
Year householder moved into unit - Moved in 1980 to 1989 (%) - Asian
Year householder moved into unit - Moved in 1980 to 1989 (%) - Hispanic or Latino
Year householder moved into unit - Moved in 1980 to 1989 (%) - American Indian and Alaska Native
Year householder moved into unit - Moved in 1980 to 1989 (%) - Multirace
Year householder moved into unit - Moved in 1980 to 1989 (%) - Other Race
Year householder moved into unit - Moved in 1970 to 1979 (%)
Year householder moved into unit - Moved in 1970 to 1979 (%) - White
Year householder moved into unit - Moved in 1970 to 1979 (%) - Black or African American
Year householder moved into unit - Moved in 1970 to 1979 (%) - Asian
Year householder moved into unit - Moved in 1970 to 1979 (%) - Hispanic or Latino
Year householder moved into unit - Moved in 1970 to 1979 (%) - American Indian and Alaska Native
Year householder moved into unit - Moved in 1970 to 1979 (%) - Multirace
Year householder moved into unit - Moved in 1970 to 1979 (%) - Other Race
Year householder moved into unit - Moved in 1969 or earlier (%)
Year householder moved into unit - Moved in 1969 or earlier (%) - White
Year householder moved into unit - Moved in 1969 or earlier (%) - Black or African American
Year householder moved into unit - Moved in 1969 or earlier (%) - Asian
Year householder moved into unit - Moved in 1969 or earlier (%) - Hispanic or Latino
Year householder moved into unit - Moved in 1969 or earlier (%) - American Indian and Alaska Native
Year householder moved into unit - Moved in 1969 or earlier (%) - Multirace
Year householder moved into unit - Moved in 1969 or earlier (%) - Other Race
Housing units lacking complete plumbing facilities (%)
Housing units lacking complete kitchen facilities (%)
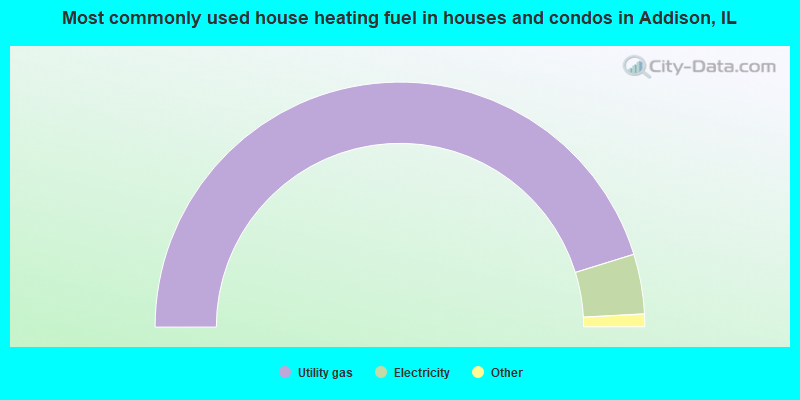
House heating fuel used in houses and condos - Utility gas (%)
House heating fuel used in houses and condos - Bottled, tank, or LP gas (%)
House heating fuel used in houses and condos - Electricity (%)
House heating fuel used in houses and condos - Fuel oil, kerosene, etc. (%)
House heating fuel used in houses and condos - Coal or coke (%)
House heating fuel used in houses and condos - Wood (%)
House heating fuel used in houses and condos - Solar energy (%)
House heating fuel used in houses and condos - Other fuel (%)
House heating fuel used in houses and condos - No fuel used (%)
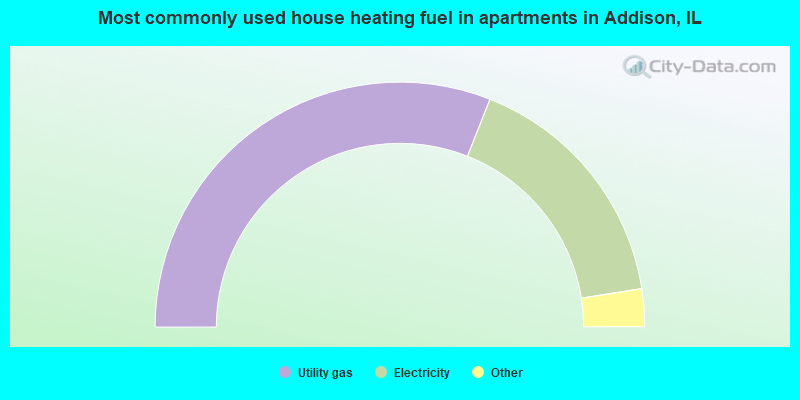
House heating fuel used in apartments - Utility gas (%)
House heating fuel used in apartments - Bottled, tank, or LP gas (%)
House heating fuel used in apartments - Electricity (%)
House heating fuel used in apartments - Fuel oil, kerosene, etc. (%)
House heating fuel used in apartments - Coal or coke (%)
House heating fuel used in apartments - Wood (%)
House heating fuel used in apartments - Solar energy (%)
House heating fuel used in apartments - Other fuel (%)
House heating fuel used in apartments - No fuel used (%)
Latest news about housing in Addison, IL collected exclusively by city-data.com from local newspapers, TV, and radio stations
Median year house/condo built: 1971Median year apartment built: 1972Household type by relationship:
Households: 35,314
Male householders: 7,171 (1,321 living alone ), Female householders: 5,759 (1,674 living alone )7,092 spouses (7,037 opposite-sex spouses ), 763 unmarried partners , (751 opposite-sex unmarried partners ), 11,112 children (10,498 natural , 29 adopted , 583 stepchildren ), 414 grandchildren , 771 brothers or sisters , 702 parents , 0 foster children , 609 other relatives , 798 non-relatives In group quarters: 116
Size of family households: 3,702 2-persons , 1,941 3-persons , 2,190 4-persons , 913 5-persons , 260 6-persons , 262 7-or-more-persons .
Size of nonfamily households: 3,104 1-person , 554 2-persons , 145 3-persons , 29 5-persons .
4,683 married couples with children. single-parent households (246 men , 1,051 women ).
44.0% of residents of Addison speak English at home. of residents speak Spanish at home (54% speak English very well , 18% speak English well , 21% speak English not well , 7% don't speak English at all ).of residents speak other Indo-European language at home (61% speak English very well , 25% speak English well , 11% speak English not well , 3% don't speak English at all ).of residents speak Asian or Pacific Island language at home (59% speak English very well , 20% speak English well , 16% speak English not well , 5% don't speak English at all ).of residents speak other language at home (68% speak English very well , 32% speak English well ).
Foreign born population: 11,663 (33.0%)of them are naturalized citizens )
Median number of rooms in houses and condos:
Median number of rooms in apartments
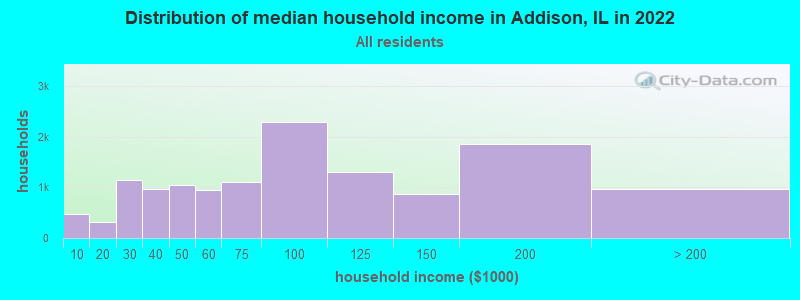
Addison, IL household income distribution 465 Less than $10,000321 $10,000 to $19,9991,139 $20,000 to $29,999967 $30,000 to $39,9991,043 $40,000 to $49,999947 $50,000 to $59,9991,095 $60,000 to $74,9992,287 $75,000 to $99,9991,296 $100,000 to $124,999872 $125,000 to $149,9991,849 $150,000 to $199,999968 $200,000 or more
Home value of owner - occupied houses in 2022 in Addison, IL 121 Less than $10,00036 $10,000 to $14,99911 $15,000 to $19,999155 $20,000 to $24,9998 $25,000 to $29,99917 $30,000 to $34,9995 $35,000 to $39,9996 $40,000 to $49,99933 $50,000 to $59,999128 $60,000 to $69,99914 $70,000 to $79,99915 $80,000 to $89,99927 $90,000 to $99,999147 $100,000 to $124,999155 $125,000 to $149,999299 $150,000 to $174,999236 $175,000 to $199,9991,009 $200,000 to $249,9991,867 $250,000 to $299,9993,219 $300,000 to $399,9991,078 $400,000 to $499,999438 $500,000 to $749,99948 $750,000 to $999,99911 $1,000,000 to $1,499,99920 $2,000,000 or moreRent paid by renters in 2022 in Addison, IL 23 $100 to $14919 $150 to $1998 $200 to $2499 $250 to $29943 $350 to $399208 $400 to $44959 $450 to $49931 $500 to $54913 $550 to $59916 $750 to $799240 $800 to $899586 $900 to $9991,737 $1,000 to $1,249587 $1,250 to $1,499331 $1,500 to $1,99996 $2,000 to $2,49915 $2,500 to $2,99911 $3,000 to $3,499158 No cash rent
Percentage of workers working in this county: 65.1%Number of people working at home: 2,251 (11.5% of all workers )
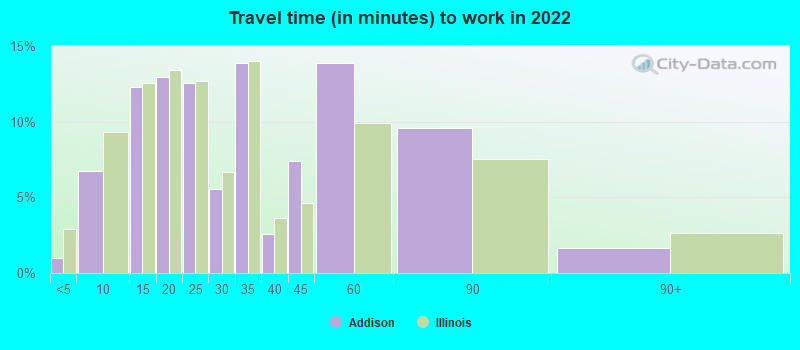
Travel time to work (commute)
Less than 5 minutes: 2195 to 9 minutes: 1,40910 to 14 minutes: 2,23715 to 19 minutes: 2,99020 to 24 minutes: 2,70625 to 29 minutes: 1,60430 to 34 minutes: 2,22435 to 39 minutes: 40640 to 44 minutes: 1,00045 to 59 minutes: 1,34760 to 89 minutes: 71390 or more minutes: 237
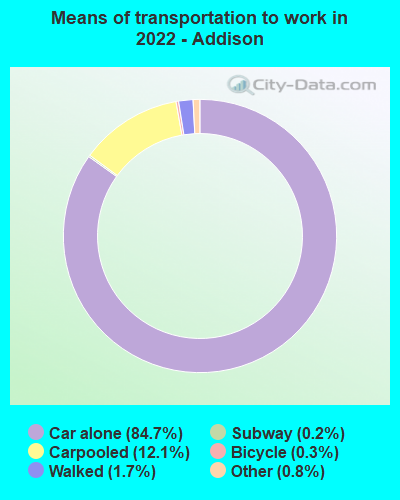
Means of transportation to work:
Drove a car alone: 16,469 (73.5%)Carpooled: 2,891 (12.9%)Bus : 25 (0.1%)Long-distance train or commuter rail : 44 (0.2%)Taxi: 180 (0.8%)Bicycle: 57 (0.3%)Walked: 306 (1.4%)Worked at home: 2,251 (10.0%)
Unemployment by race in 2022
Unemployment rate for White non-Hispanic residents 2.6% Males1.4% FemalesUnemployment rate for Black residents 17.9% MalesUnemployment rate for Asian residents 6.5% Males5.9% FemalesUnemployment rate for other race residents 8.5% Males6.3% FemalesUnemployment rate for two or more race residents 0.9% Males2.8% FemalesUnemployment rate for Hispanic or Latino residents 6.5% Males3.7% Females
Year of entry for the foreign-born population in Addison, Illinois
2,004 2010 or later 2,160 2000 to 2009 3,427 1990 to 1999 2,661 1980 to 1989 1,954 1970 to 1979 1,442 Before 1970
First ancestries reported:
Polish: 2,369 (11.0%)
Italian: 2,298 (10.7%)
Greek: 563 (2.6%)
German: 457 (2.1%)
Albanian: 374 (1.7%)
Serbian: 297 (1.4%)
Irish: 291 (1.4%)
American: 285 (1.3%)
European: 221 (1.0%)
English: 134 (0.6%)
Yugoslavian: 96 (0.4%)
Romanian: 90 (0.4%)
Russian: 85 (0.4%)
Ukrainian: 69 (0.3%)
Croatian: 67 (0.3%)
Lithuanian: 66 (0.3%)
Norwegian: 55 (0.3%)
Swedish: 51 (0.2%)
Czech: 47 (0.2%)
Danish: 40 (0.2%)
Dutch: 38 (0.2%)
Jamaican: 38 (0.2%)
Scottish: 36 (0.2%)
Eastern European: 29 (0.1%)
Hungarian: 27 (0.1%)
Egyptian: 21 (0.10%)
Assyrian: 20 (0.09%)
Ghanaian: 17 (0.08%)
Syrian: 16 (0.07%)
Brazilian: 15 (0.07%)
Iraqi: 12 (0.06%)
Czechoslovakian: 12 (0.06%)
Haitian: 10 (0.05%)
Armenian: 8 (0.04%)
Jordanian: 6 (0.03%)
Scotch-Irish: 5 (0.02%)
Belgian: 4 (0.02%)
British: 4 (0.02%)
French: 2 (0.01%) Most common places of birth for foreign-born residents (%): Mexico Addison:
41.7% (4,895)Illinois:
34.7% (626,958)
Poland Addison:
11.3% (1,331)Illinois:
6.9% (124,474)
India Addison:
7.6% (894)Illinois:
9.2% (166,409)
Italy Addison:
7.4% (866)Illinois:
0.9% (15,679)
Philippines Addison:
6.0% (708)Illinois:
5.2% (93,003)
Guatemala Addison:
4.1% (479)Illinois:
1.3% (22,793)
Greece Addison:
3.4% (396)Illinois:
0.6% (10,720)
Albania Addison:
2.9% (340)Illinois:
0.4% (6,488)
Pakistan Addison:
2.3% (272)Illinois:
1.6% (29,519)
Place of birth for U.S.-born residents:
This state: 20,655Other state: 2,167Northeast: 278Midwest: 676South: 782West: 382 91.8% of Addison residents lived in the same house 1 years ago.
Out of people who lived in different houses, 28.1% lived in this county.
Out of people who lived in different counties, 79.8% lived in Illinois.
Addison:
91.8%State average:
88.3%
Education attainment for males 25 years and older:
No schooling: 432Nursery to 4th grade: 585th and 6th grade: 4687th and 8th grade: 3239th grade: 10410th grade: 21511th grade: 12712th grade, no diploma: 694High school graduate (or equivalency): 3,665Less than 1 year of college: 619Some college more than 1 year, no degree: 1,294Associate degree: 1,063Bachelor's degree: 1,996Master's degree: 690Professional school degree: 63Doctorate degree: 28
Education attainment for females 25 years and older:
No schooling: 590Nursery to 4th grade: 2565th and 6th grade: 4367th and 8th grade: 2809th grade: 11310th grade: 33811th grade: 13512th grade, no diploma: 399High school graduate (or equivalency): 3,612Less than 1 year of college: 726Some college more than 1 year, no degree: 1,117Associate degree: 1,331Bachelor's degree: 2,287Master's degree: 860Professional school degree: 126Doctorate degree: 136
Housing units in structures:
One, detached: 7,560One, attached: 908Two: 3003 or 4: 8035 to 9: 1,59810 to 19: 1,24420 to 49: 64350 or more: 423Mobile homes: 38Housing units lacking complete plumbing facilities in 2022: 0.6%Housing units lacking complete kitchen facilities in 2022: 0.6%House/condo owner moved in on average 17 years ago
Renter moved in on average 5 years ago
Private vs. public school enrollment:
Students in private schools in grades 1 to 8 (elementary and middle school): 225 Students in private schools in grades 9 to 12 (high school): 66 Students in private undergraduate colleges: 464