Races in Addison, Illinois (IL) Detailed Stats
Data:
Races - White alone (%)
Races - White alone (% change since 2000)
Races - Black alone (%)
Races - Black alone (% change since 2000)
Races - American Indian alone (%)
Races - American Indian alone (% change since 2000)
Races - Asian alone (%)
Races - Asian alone (% change since 2000)
Races - Hispanic (%)
Races - Hispanic (% change since 2000)
Races - Native Hawaiian and Other Pacific Islander alone (%)
Races - Native Hawaiian and Other Pacific Islander alone (% change since 2000)
Races - Two or more races(%)
Races - Two or more races(% change since 2000)
Races - Other race alone (%)
Races - Other race alone (% change since 2000)
Racial diversity
Place of birth - Born in state of residence (%)
Place of birth - Born in state of residence (%) - White
Place of birth - Born in state of residence (%) - Black or African American
Place of birth - Born in state of residence (%) - Asian
Place of birth - Born in state of residence (%) - Hispanic or Latino
Place of birth - Born in state of residence (%) - American Indian and Alaska Native
Place of birth - Born in state of residence (%) - Multirace
Place of birth - Born in state of residence (%) - Other Race
Place of birth - Born in other state (%)
Place of birth - Born in other state (%) - White
Place of birth - Born in other state (%) - Black or African American
Place of birth - Born in other state (%) - Asian
Place of birth - Born in other state (%) - Hispanic or Latino
Place of birth - Born in other state (%) - American Indian and Alaska Native
Place of birth - Born in other state (%) - Multirace
Place of birth - Born in other state (%) - Other Race
Place of birth - Native, outside of US (%)
Place of birth - Native, outside of US (%) - White
Place of birth - Native, outside of US (%) - Black or African American
Place of birth - Native, outside of US (%) - Asian
Place of birth - Native, outside of US (%) - Hispanic or Latino
Place of birth - Native, outside of US (%) - American Indian and Alaska Native
Place of birth - Native, outside of US (%) - Multirace
Place of birth - Native, outside of US (%) - Other Race
Place of birth - Foreign born (%)
Place of birth - Foreign born (%) - White
Place of birth - Foreign born (%) - Black or African American
Place of birth - Foreign born (%) - Asian
Place of birth - Foreign born (%) - Hispanic or Latino
Place of birth - Foreign born (%) - American Indian and Alaska Native
Place of birth - Foreign born (%) - Multirace
Place of birth - Foreign born (%) - Other Race
Residents speaking English at home (%)
Residents speaking English at home - Born in the United States (%)
Residents speaking English at home - Native, born elsewhere (%)
Residents speaking English at home - Foreign born (%)
Residents speaking Spanish at home (%)
Residents speaking Spanish at home - Born in the United States (%)
Residents speaking Spanish at home - Native, born elsewhere (%)
Residents speaking Spanish at home - Foreign born (%)
Residents speaking other language at home (%)
Residents speaking other language at home - Born in the United States (%)
Residents speaking other language at home - Native, born elsewhere (%)
Residents speaking other language at home - Foreign born (%)
Marital status - Never married (%)
Marital status - Now married (%)
Marital status - Separated (%)
Marital status - Widowed (%)
Marital status - Divorced (%)
Ancestries Reported - Arab (%)
Ancestries Reported - Czech (%)
Ancestries Reported - Danish (%)
Ancestries Reported - Dutch (%)
Ancestries Reported - English (%)
Ancestries Reported - French (%)
Ancestries Reported - French Canadian (%)
Ancestries Reported - German (%)
Ancestries Reported - Greek (%)
Ancestries Reported - Hungarian (%)
Ancestries Reported - Irish (%)
Ancestries Reported - Italian (%)
Ancestries Reported - Lithuanian (%)
Ancestries Reported - Norwegian (%)
Ancestries Reported - Polish (%)
Ancestries Reported - Portuguese (%)
Ancestries Reported - Russian (%)
Ancestries Reported - Scotch-Irish (%)
Ancestries Reported - Scottish (%)
Ancestries Reported - Slovak (%)
Ancestries Reported - Subsaharan African (%)
Ancestries Reported - Swedish (%)
Ancestries Reported - Swiss (%)
Ancestries Reported - Ukrainian (%)
Ancestries Reported - United States (%)
Ancestries Reported - Welsh (%)
Ancestries Reported - West Indian (%)
Ancestries Reported - Other (%)
Geographical mobility - Same house 1 year ago (%)
Geographical mobility - Same house 1 year ago (%) - White
Geographical mobility - Same house 1 year ago (%) - Black or African American
Geographical mobility - Same house 1 year ago (%) - Asian
Geographical mobility - Same house 1 year ago (%) - Hispanic or Latino
Geographical mobility - Same house 1 year ago (%) - American Indian and Alaska Native
Geographical mobility - Same house 1 year ago (%) - Multirace
Geographical mobility - Same house 1 year ago (%) - Other Race
Geographical mobility - Moved within same county (%)
Geographical mobility - Moved within same county (%) - White
Geographical mobility - Moved within same county (%) - Black or African American
Geographical mobility - Moved within same county (%) - Asian
Geographical mobility - Moved within same county (%) - Hispanic or Latino
Geographical mobility - Moved within same county (%) - American Indian and Alaska Native
Geographical mobility - Moved within same county (%) - Multirace
Geographical mobility - Moved within same county (%) - Other Race
Geographical mobility - Moved from different county within same state (%)
Geographical mobility - Moved from different county within same state (%) - White
Geographical mobility - Moved from different county within same state (%) - Black or African American
Geographical mobility - Moved from different county within same state (%) - Asian
Geographical mobility - Moved from different county within same state (%) - Hispanic or Latino
Geographical mobility - Moved from different county within same state (%) - American Indian and Alaska Native
Geographical mobility - Moved from different county within same state (%) - Multirace
Geographical mobility - Moved from different county within same state (%) - Other Race
Geographical mobility - Moved from different state (%)
Geographical mobility - Moved from different state (%) - White
Geographical mobility - Moved from different state (%) - Black or African American
Geographical mobility - Moved from different state (%) - Asian
Geographical mobility - Moved from different state (%) - Hispanic or Latino
Geographical mobility - Moved from different state (%) - American Indian and Alaska Native
Geographical mobility - Moved from different state (%) - Multirace
Geographical mobility - Moved from different state (%) - Other Race
Geographical mobility - Moved from abroad (%)
Geographical mobility - Moved from abroad (%) - White
Geographical mobility - Moved from abroad (%) - Black or African American
Geographical mobility - Moved from abroad (%) - Asian
Geographical mobility - Moved from abroad (%) - Hispanic or Latino
Geographical mobility - Moved from abroad (%) - American Indian and Alaska Native
Geographical mobility - Moved from abroad (%) - Multirace
Geographical mobility - Moved from abroad (%) - Other Race
Place of birth for the foreign-born population - Ireland (%)
Place of birth for the foreign-born population - Denmark (%)
Place of birth for the foreign-born population - Norway (%)
Place of birth for the foreign-born population - Sweden (%)
Place of birth for the foreign-born population - United Kingdom (%)
Place of birth for the foreign-born population - England (%)
Place of birth for the foreign-born population - Scotland (%)
Place of birth for the foreign-born population - Other Northern Europe (%)
Place of birth for the foreign-born population - Austria (%)
Place of birth for the foreign-born population - Belgium (%)
Place of birth for the foreign-born population - France (%)
Place of birth for the foreign-born population - Germany (%)
Place of birth for the foreign-born population - Netherlands (%)
Place of birth for the foreign-born population - Switzerland (%)
Place of birth for the foreign-born population - Other Western Europe (%)
Place of birth for the foreign-born population - Greece (%)
Place of birth for the foreign-born population - Italy (%)
Place of birth for the foreign-born population - Portugal (%)
Place of birth for the foreign-born population - Spain (%)
Place of birth for the foreign-born population - Other Southern Europe (%)
Place of birth for the foreign-born population - Albania (%)
Place of birth for the foreign-born population - Belarus (%)
Place of birth for the foreign-born population - Bosnia and Herzegovina (%)
Place of birth for the foreign-born population - Bulgaria (%)
Place of birth for the foreign-born population - Croatia (%)
Place of birth for the foreign-born population - Czechoslovakia (%)
Place of birth for the foreign-born population - Hungary (%)
Place of birth for the foreign-born population - Latvia (%)
Place of birth for the foreign-born population - Lithuania (%)
Place of birth for the foreign-born population - North Macedonia (Macedonia) (%)
Place of birth for the foreign-born population - Moldova (%)
Place of birth for the foreign-born population - Poland (%)
Place of birth for the foreign-born population - Romania (%)
Place of birth for the foreign-born population - Russia (%)
Place of birth for the foreign-born population - Serbia (%)
Place of birth for the foreign-born population - Ukraine (%)
Place of birth for the foreign-born population - Other Eastern Europe (%)
Place of birth for the foreign-born population - China (%)
Place of birth for the foreign-born population - Hong Kong (%)
Place of birth for the foreign-born population - Taiwan (%)
Place of birth for the foreign-born population - Japan (%)
Place of birth for the foreign-born population - Korea (%)
Place of birth for the foreign-born population - Other Eastern Asia (%)
Place of birth for the foreign-born population - Afghanistan (%)
Place of birth for the foreign-born population - Bangladesh (%)
Place of birth for the foreign-born population - India (%)
Place of birth for the foreign-born population - Iran (%)
Place of birth for the foreign-born population - Kazakhstan (%)
Place of birth for the foreign-born population - Nepal (%)
Place of birth for the foreign-born population - Pakistan (%)
Place of birth for the foreign-born population - Sri Lanka (%)
Place of birth for the foreign-born population - Uzbekistan (%)
Place of birth for the foreign-born population - Other South Central Asia (%)
Place of birth for the foreign-born population - Burma (%)
Place of birth for the foreign-born population - Cambodia (%)
Place of birth for the foreign-born population - Indonesia (%)
Place of birth for the foreign-born population - Laos (%)
Place of birth for the foreign-born population - Malaysia (%)
Place of birth for the foreign-born population - Philippines (%)
Place of birth for the foreign-born population - Singapore (%)
Place of birth for the foreign-born population - Thailand (%)
Place of birth for the foreign-born population - Vietnam (%)
Place of birth for the foreign-born population - Other South Eastern Asia (%)
Place of birth for the foreign-born population - Armenia (%)
Place of birth for the foreign-born population - Iraq (%)
Place of birth for the foreign-born population - Israel (%)
Place of birth for the foreign-born population - Jordan (%)
Place of birth for the foreign-born population - Kuwait (%)
Place of birth for the foreign-born population - Lebanon (%)
Place of birth for the foreign-born population - Saudi Arabia (%)
Place of birth for the foreign-born population - Syria (%)
Place of birth for the foreign-born population - Turkey (%)
Place of birth for the foreign-born population - Yemen (%)
Place of birth for the foreign-born population - Other Western Asia (%)
Place of birth for the foreign-born population - Eritrea (%)
Place of birth for the foreign-born population - Ethiopia (%)
Place of birth for the foreign-born population - Kenya (%)
Place of birth for the foreign-born population - Somalia (%)
Place of birth for the foreign-born population - Uganda (%)
Place of birth for the foreign-born population - Zimbabwe (%)
Place of birth for the foreign-born population - Other Eastern Africa (%)
Place of birth for the foreign-born population - Cameroon (%)
Place of birth for the foreign-born population - Congo (%)
Place of birth for the foreign-born population - Democratic Republic of Congo (Zaire) (%)
Place of birth for the foreign-born population - Other Middle Africa (%)
Place of birth for the foreign-born population - Egypt (%)
Place of birth for the foreign-born population - Morocco (%)
Place of birth for the foreign-born population - Sudan (%)
Place of birth for the foreign-born population - Other Northern Africa (%)
Place of birth for the foreign-born population - South Africa (%)
Place of birth for the foreign-born population - Other Southern Africa (%)
Place of birth for the foreign-born population - Cabo Verde (%)
Place of birth for the foreign-born population - Ghana (%)
Place of birth for the foreign-born population - Liberia (%)
Place of birth for the foreign-born population - Nigeria (%)
Place of birth for the foreign-born population - Senegal (%)
Place of birth for the foreign-born population - Sierra Leone (%)
Place of birth for the foreign-born population - Other Western Africa (%)
Place of birth for the foreign-born population - Australia (%)
Place of birth for the foreign-born population - New Zealand (%)
Place of birth for the foreign-born population - Fiji (%)
Place of birth for the foreign-born population - Micronesia (%)
Place of birth for the foreign-born population - Bahamas (%)
Place of birth for the foreign-born population - Barbados (%)
Place of birth for the foreign-born population - Cuba (%)
Place of birth for the foreign-born population - Dominica (%)
Place of birth for the foreign-born population - Dominican Republic (%)
Place of birth for the foreign-born population - Grenada (%)
Place of birth for the foreign-born population - Haiti (%)
Place of birth for the foreign-born population - Jamaica (%)
Place of birth for the foreign-born population - St. Vincent and the Grenadines (%)
Place of birth for the foreign-born population - Trinidad and Tobago (%)
Place of birth for the foreign-born population - West Indies (%)
Place of birth for the foreign-born population - Other Caribbean (%)
Place of birth for the foreign-born population - Belize (%)
Place of birth for the foreign-born population - Costa Rica (%)
Place of birth for the foreign-born population - El Salvador (%)
Place of birth for the foreign-born population - Guatemala (%)
Place of birth for the foreign-born population - Honduras (%)
Place of birth for the foreign-born population - Mexico (%)
Place of birth for the foreign-born population - Nicaragua (%)
Place of birth for the foreign-born population - Panama (%)
Place of birth for the foreign-born population - Other Central America (%)
Place of birth for the foreign-born population - Argentina (%)
Place of birth for the foreign-born population - Bolivia (%)
Place of birth for the foreign-born population - Brazil (%)
Place of birth for the foreign-born population - Chile (%)
Place of birth for the foreign-born population - Colombia (%)
Place of birth for the foreign-born population - Ecuador (%)
Place of birth for the foreign-born population - Guyana (%)
Place of birth for the foreign-born population - Peru (%)
Place of birth for the foreign-born population - Uruguay (%)
Place of birth for the foreign-born population - Venezuela (%)
Place of birth for the foreign-born population - Other South America (%)
Place of birth for the foreign-born population - Canada (%)
Place of birth for the foreign-born population - Other Northern America (%)
Place of birth for the foreign-born population - Other (%)
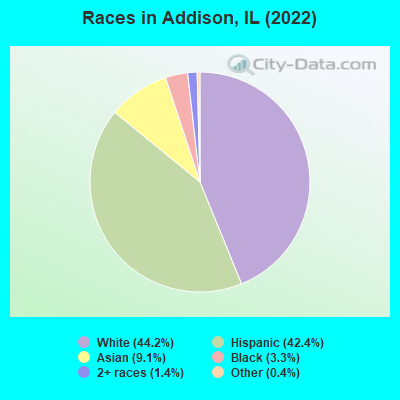
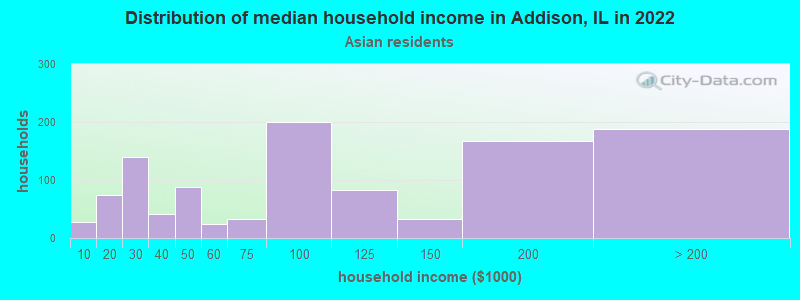
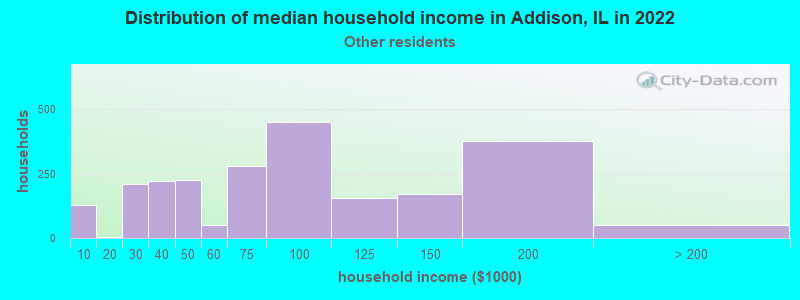
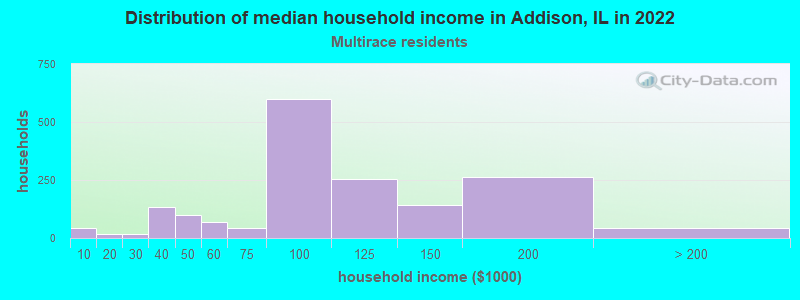
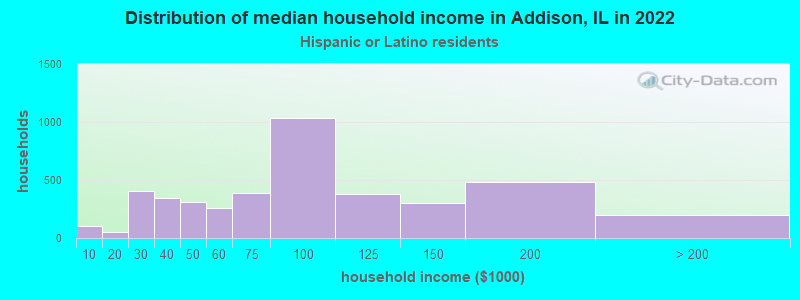
According to 2022 data, the most numerous races in Addison, IL are White alone (15,610 residents), Hispanic (14,963 residents), and Black alone (1,179 residents). 43.9% of Addison residents speak English at home. 33.2% of Addison, IL residents are foreign-born (16.1% born in Latin America, 9.7% born in Europe, 6.6% born in Asia), which is 57.8% greater than the foreign-born rate of 14.0% across the entire state of Illinois.
Race distribution in Addison
2000 2022
8,424,140 67.8% White alone 1,856,152 14.9% Black alone 1,530,262 12.3% Hispanic 419,916 3.4% Asian alone 153,996 1.2% Two or more races 13,479 0.1% Other race alone 18,232 0.1% American Indian alone 3,116 0.03% Native Hawaiian and Other
7,356,301 58.5% White alone 2,299,726 18.3% Hispanic 1,660,423 13.2% Black alone 747,296 5.9% Asian alone 458,599 3.6% Two or more races 45,386 0.4% Other race alone 10,405 0.08% American Indian alone 3,896 0.03% Native Hawaiian and Other
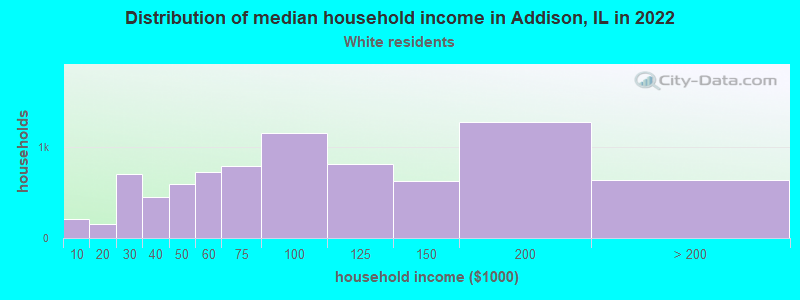
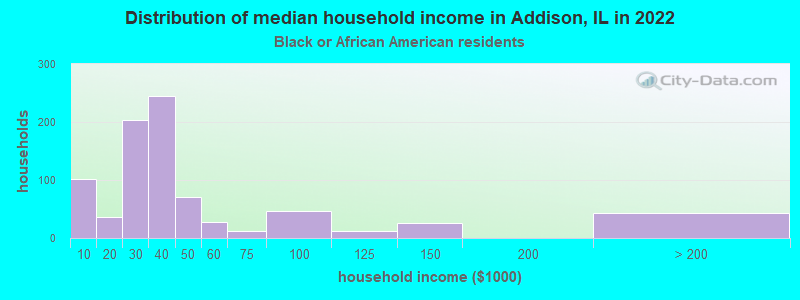
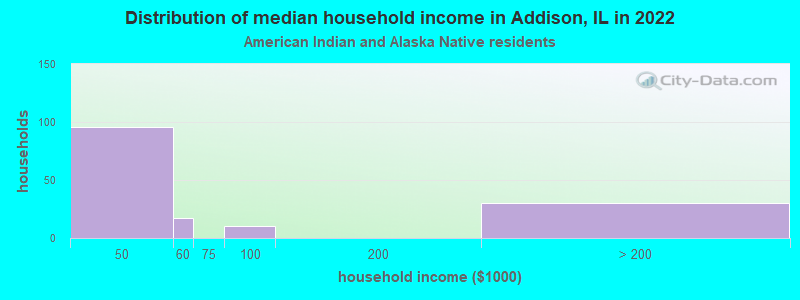
Income and house value in Addison Median household income in 2022 $82,272 White non-Hispanic householders$28,222 Black householders$92,708 Asian householders$81,580 Some other race householders$97,881 Two or more races householders$78,584 Hispanic or Latino race householdersMedian 2022 house value $311,874 White Non-Hispanic householders$264,376 Black or African American householders$316,534 American Indian or Alaska Native householders $351,844 Asian householders$291,620 Some other race householders$289,290 Two or more races householders$292,516 Hispanic or Latino householders
Median age by race in Addison
47.4 Median age for White residents46.3 48.4 31.0 Median age for Black or African American residents32.0 30.6 28.1 Median age for American Indian / Alaska Native residents29.0 26.2 40.5 Median age for Asian residents40.2 40.3 -593,236,714.4 Median age for Native Hawaiian / Pacific Islander residents-658,536,584.7 -576,015,108.0 33.1 Median age for Other race residents29.5 36.2 36.9 Median age for Two or more races residents33.8 37.6 52.7 Median age for White alone residents50.3 55.0 30.9 Median age for Hispanic or Latino residents30.8 31.9
Owner/renter occupied households by race in Addison
House owners and renters - White residents 6,351 79.3% Owner occupied1,655 20.7% Renter occupiedHouse owners and renters - Black or African American residents 60 9.3% Owner occupied585 90.7% Renter occupiedHouse owners and renters - American Indian / Alaska Native residents 27 27.0% Owner occupied73 73.0% Renter occupiedHouse owners and renters - Asian residents 827 77.6% Owner occupied239 22.4% Renter occupiedHouse owners and renters - Other race residents 1,191 54.6% Owner occupied990 45.4% Renter occupiedHouse owners and renters - Two or more races residents 830 45.2% Owner occupied1,008 54.8% Renter occupiedHouse owners and renters - White alone residents 5,859 84.0% Owner occupied1,118 16.0% Renter occupiedHouse owners and renters - Hispanic or Latino residents 2,066 48.1% Owner occupied2,226 51.9% Renter occupied
Language usage in Addison
English speakers - Total 43.9% of residents of Addison speak English at home.
36.1% of residents speak Spanish at home 6,612 53.9% Speak English very well5,666 46.1% Speak English less than very well21.6% of residents speak other language at home 4,476 60.9% Speak English very well2,878 39.1% Speak English less than very well
English speakers - Born in the United States 76.3% of residents of Addison speak English at home.
14.0% of residents speak Spanish at home 303 100.0% Speak English very well6.7% of residents speak other language at home 128 87.7% Speak English very well18 12.3% Speak English less than very well
English speakers - Native, born elsewhere 25.6% of residents of Addison speak English at home.
38.9% of residents speak Spanish at home 217 69.8% Speak English very well94 30.2% Speak English less than very well37.4% of residents speak other language at home 294 98.3% Speak English very well5 1.7% Speak English less than very well
English speakers - Foreign-born 9.4% of residents of Addison speak English at home.
49.0% of residents speak Spanish at home 1,234 21.6% Speak English very well4,477 78.4% Speak English less than very well44.7% of residents speak other language at home 2,503 48.0% Speak English very well2,714 52.0% Speak English less than very well
White (Caucasian) - Speak only English Native:
73.8% (10,487)Foreign-born:
9.5% (405)
White (Caucasian) - Speak another language Native:
20.7% (2,939)Foreign-born:
89.3% (3,812)
Black or African American - Speak another language Native:
8.3% (112)Foreign-born:
100.0% (17)
American Indian / Alaska Native - Speak only English Native:
6.8% (11)Foreign-born:
30.5% (62)
American Indian / Alaska Native - Speak another language Native:
100.0% (161)Foreign-born:
75.5% (153)
Asian - Speak only English Native:
49.9% (424)Foreign-born:
13.9% (323)
Asian - Speak another language Native:
47.9% (407)Foreign-born:
85.4% (1,985)
Other race - Speak only English Native:
20.5% (770)Foreign-born:
10.4% (347)
Other race - Speak another language Native:
76.7% (2,885)Foreign-born:
88.6% (2,953)
Two or more races - Speak only English Native:
36.0% (1,148)Foreign-born:
2.5% (58)
Two or more races - Speak another language Native:
69.3% (2,208)Foreign-born:
99.2% (2,296)
White alone - Speak only English Native:
85.0% (9,923)Foreign-born:
9.9% (361)
White alone - Speak another language Native:
14.2% (1,655)Foreign-born:
89.7% (3,269)
Hispanic or Latino - Speak only English Native:
20.9% (1,721)Foreign-born:
7.2% (428)
Hispanic or Latino - Speak another language Native:
80.1% (6,594)Foreign-born:
92.8% (5,530)
Foreign-born residents in Addison 11,729 residents are foreign born (16.1% Latin America , 9.7% Europe , 6.6% Asia ).
This city:
33.2%Illinois:
14.1%
Marital status for residents in Addison Marital status - White (Caucasian) population 15 years and over
Males 37.4% Never married53.3% Now married0.0% Separated2.1% Widowed7.2% DivorcedFemales 29.5% Never married51.1% Now married0.4% Separated8.8% Widowed10.2% DivorcedWomen who gave birth in the past 12 months Now married:
67.4% (135)Unmarried:
32.6% (65)
Women who did not give birth in the past 12 months Now married:
37.5% (1,505)Unmarried:
62.5% (2,508)
Marital status - Black or African American population 15 years and over
Males 62.1% Never married34.2% Now married0.0% Separated3.7% Widowed0.0% DivorcedFemales 71.7% Never married9.3% Now married7.0% Separated4.6% Widowed7.4% DivorcedWomen who did not give birth in the past 12 months Now married:
1.5% (8)Unmarried:
98.5% (549)
Marital status - American Indian / Alaska Native population 15 years and over
Males 29.9% Never married70.1% Now married0.0% Separated0.0% Widowed0.0% DivorcedFemales 26.9% Never married73.1% Now married0.0% Separated0.0% Widowed0.0% DivorcedWomen who did not give birth in the past 12 months Now married:
66.4% (128)Unmarried:
33.6% (65)
Marital status - Asian population 15 years and over
Males 37.7% Never married50.3% Now married6.5% Separated0.9% Widowed4.6% DivorcedFemales 29.0% Never married49.8% Now married0.0% Separated10.5% Widowed10.8% DivorcedWomen who gave birth in the past 12 months Now married:
100.0% (5)Unmarried:
0.0% (0)
Women who did not give birth in the past 12 months Now married:
46.6% (357)Unmarried:
53.4% (409)
Marital status - Other race population 15 years and over
Males 46.5% Never married48.3% Now married1.9% Separated0.3% Widowed2.9% DivorcedFemales 41.7% Never married45.0% Now married2.6% Separated4.6% Widowed6.2% DivorcedWomen who gave birth in the past 12 months Now married:
52.4% (105)Unmarried:
47.6% (95)
Women who did not give birth in the past 12 months Now married:
41.7% (891)Unmarried:
58.3% (1,246)
Marital status - Two or more races population 15 years and over
Males 47.3% Never married49.6% Now married2.0% Separated0.0% Widowed1.0% DivorcedFemales 28.7% Never married60.9% Now married4.5% Separated3.3% Widowed2.6% DivorcedWomen who gave birth in the past 12 months Now married:
100.0% (11)Unmarried:
0.0% (0)
Women who did not give birth in the past 12 months Now married:
55.6% (659)Unmarried:
44.4% (525)
Marital status - White alone, not Hispanic / Latino population 15 years and over
Males 33.6% Never married55.5% Now married0.0% Separated2.6% Widowed8.2% DivorcedFemales 23.9% Never married53.2% Now married0.4% Separated11.1% Widowed11.5% DivorcedWomen who gave birth in the past 12 months Now married:
65.3% (73)Unmarried:
34.7% (39)
Women who did not give birth in the past 12 months Now married:
38.3% (1,080)Unmarried:
61.7% (1,738)
Marital status - Hispanic or Latino population 15 years and over
Males 48.6% Never married47.4% Now married1.4% Separated0.1% Widowed2.5% DivorcedFemales 42.0% Never married48.3% Now married2.0% Separated2.9% Widowed4.8% DivorcedWomen who gave birth in the past 12 months Now married:
59.9% (157)Unmarried:
40.1% (105)
Women who did not give birth in the past 12 months Now married:
42.8% (1,774)Unmarried:
57.3% (2,375)
Ancestries in Addison
2,369 11.0% Polish2,298 10.7% Italian563 2.6% Greek457 2.1% German374 1.7% Albanian297 1.4% Serbian291 1.4% Irish285 1.3% American221 1.0% European134 0.6% English96 0.4% Yugoslavian90 0.4% Romanian85 0.4% Russian69 0.3% Ukrainian67 0.3% Croatian66 0.3% Lithuanian55 0.3% Norwegian51 0.2% Swedish47 0.2% Czech40 0.2% Danish38 0.2% Dutch38 0.2% Jamaican36 0.2% Scottish29 0.1% Eastern European27 0.1% Hungarian21 0.10% Egyptian20 0.09% Assyrian17 0.08% Ghanaian16 0.07% Syrian15 0.07% Brazilian12 0.06% Iraqi12 0.06% Czechoslovakian10 0.05% Haitian8 0.04% Armenian6 0.03% Jordanian5 0.02% Scotch-Irish4 0.02% Belgian4 0.02% British2 0.01% French
Geographical mobility in Addison Same house 1 year ago 17,978 93.7% White (Caucasian)885 68.1% Black or African American288 61.0% American Indian / Alaska Native3,112 95.2% Asian6,468 85.4% Other race5,576 97.7% Two or more races14,585 94.1% White alone, not Hispanic / Latino13,233 89.4% Hispanic or LatinoMoved within same county 412 2.1% White / Caucasian156 12.0% Black or African American187 39.6% American Indian / Alaska Native70 2.2% Asian479 6.3% Other race29 0.5% Two or more races282 1.8% White alone, not Hispanic / Latino609 4.1% Hispanic or LatinoMoved within same state 757 3.9% White / Caucasian145 11.1% Black or African American35 1.1% Asian305 4.0% Other race51 0.9% Two or more races605 3.9% White alone, not Hispanic / Latino605 4.1% Hispanic or LatinoMoved from different state 79 0.4% White / Caucasian54 4.2% Black or African American11 0.3% Asian136 1.8% Other race29 0.5% Two or more races64 0.4% White alone, not Hispanic / Latino243 1.6% Hispanic or LatinoMoved from abroad 4 0.0% White4 0.0% White alone, not Hispanic / Latino
Children Nativity (place of birth) in Addison
Children under 6 years - Living with two parents Both parents native 425 99.9% Native0 0.1% Foreign-bornBoth parents foreign-born 525 98.8% Native6 1.2% Foreign-bornOne native, one foreign-born parent 160 100.0% NativeChildren under 6 years - Living with one parent Native parent 223 100.0% NativeForeign-born parent 97 64.8% Native53 35.2% Foreign-bornChildren 6 to 17 years - Living with two parents Both parents native 1,175 100.0% NativeBoth parents foreign-born 1,706 95.2% Native87 4.8% Foreign-bornOne native, one foreign-born parent 589 100.0% NativeChildren 6 to 17 years - Living with one parent Native parent 525 100.0% NativeForeign-born parent 717 55.6% Native572 44.4% Foreign-born
Place of birth for residents in Addison 5,838 Americas5,751 Latin America5,548 Central America3,475 Europe2,358 Asia2,264 Eastern Europe1,131 South Central Asia1,072 Southern Europe841 South Eastern Asia289 Eastern Asia180 South America104 China95 Western Asia87 Northern America73 Western Europe65 Northern Europe31 Oceania31 Australia and New Zealand Subregion26 Africa26 Northern Africa22 Caribbean4,952 Mexico1,380 Poland860 India730 Italy714 Philippines479 Guatemala342 Greece313 Albania270 Pakistan144 Serbia138 Korea107 Bosnia and Herzegovina101 Ecuador100 Croatia90 Russia87 Canada86 Honduras73 Germany70 China65 Ireland61 Cambodia59 Romania54 Colombia48 Vietnam35 Iraq31 Australia27 Jordan26 Egypt23 El Salvador22 Ukraine20 Syria20 Hong Kong19 Venezuela16 Trinidad and Tobago15 Czechoslovakia14 Taiwan13 Kuwait12 Belarus10 Hungary9 Burma (Myanmar)9 Thailand7 Nicaragua6 Brazil6 Dominican Republic4 Japan
Grandparents responsible for own grandchildren in Addison
Grandparents (30 to 59 years) White / Caucasian 63 88.3% Responsible for grandchildren8 11.7% Not responsible for grandchildrenBlack or African American 10 71.6% Responsible for grandchildren4 28.4% Not responsible for grandchildrenAsian 44 100.0% Not responsible for grandchildrenOther race 48 79.1% Responsible for grandchildren13 20.9% Not responsible for grandchildrenTwo or more races 13 100.0% Not responsible for grandchildrenWhite alone, not Hispanic / Latino 6 100.0% Responsible for grandchildrenHispanic or Latino 42 50.2% Responsible for grandchildren42 49.8% Not responsible for grandchildrenGrandparents (60 years and over) White / Caucasian 13 8.6% Responsible for grandchildren139 91.4% Not responsible for grandchildrenAsian 136 100.0% Not responsible for grandchildrenOther race 20 48.4% Responsible for grandchildren21 51.6% Not responsible for grandchildrenWhite alone, not Hispanic / Latino 14 10.4% Responsible for grandchildren124 89.6% Not responsible for grandchildrenHispanic or Latino 31 23.2% Responsible for grandchildren104 76.8% Not responsible for grandchildren