Please register to participate in our discussions with 2 million other members - it's free and quick! Some forums can only be seen by registered members. After you create your account, you'll be able to customize options and access all our 15,000 new posts/day with fewer ads.
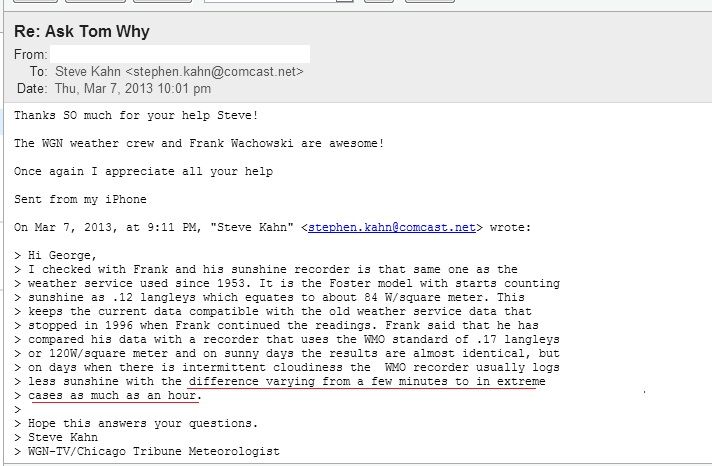
120 W/per sq meter was only adopted as a WMO standard in 2003. The Foster sunshine recorder uses 87 W/per sq meter.
Again I post this correspondence which states that the difference is minimal. In "extreme" cases there might be an hour difference.
You want to knock off 100 hours fine from the watt discrepancy between the WMO standard and what was NWS standard since 1953, fine. Chicago would still see around 2500 hours annually. However, the peer reviewed literature suggests a much smaller difference which is what was stated above by professional met people... If you read below somewhere averaging around 66 hours when looking at the various sites!!
Prior to 1953, the Maring Marvin recorder, which didn't begin recording until 37 langleys was achieved, while the current WMO threshold only requires 17 langleys!
Quote:
Three different types of sunshine duration recorders
were used during the period covered by the database:
first, the Jordan photographic recorder from 1888 to
1907; second, the Maring–Marvin thermometric sunshine
recorder from 1893 to the mid-1960s; and currently
the Foster photoelectric Sun Switch (beginning
in 1953). Details of these instruments with further references
are given in appendix B of Steurer and Karl’s
publication. The extent to which the above changes in
instrumentation influenced the homogeneity of the
U.S. sunshine duration records is examined in the first
section of the results.
Mean continental values of SS were taken as the average
of the normalized anomaly for each station year,
computed as the difference between the annual total
and the median of the station series divided by the
standard deviation of the station series. 3. Results
a. Effect of changes in recorders
Replacement of the photographic by the thermometric
method of recording sunshine during the early years
of the last century had a minor and nonsignificant effect
on the annual sunshine duration, as shown by a comparison
of the values measured at 13 sites for an average
of 10 yr before and after the change. Following this
change, which occurred between 1898 and 1908, the
average annual sunshine duration increased from 2805
to 2859 h, or 1.9%; the intersite variation in this change
was large, ranging from 3.8% to 10% with a standard
deviation of 4.1%. Even at the site showing the
largest change, this was not statistically significant,
amounting to only 1.14 times the interannual standard
deviation in annual sunshine duration. Data from many more sites were available to assess
the effect of the second change of instruments, from
thermometric to photoelectric recorders. Based on the
mean annual sunshine duration measured for 11 yr before
and after the year of change (which occurred between
1953 and 1964) at 34 sites, each from a different
continental U.S. state, the average value of SS increased
from 2740 to 2806 h yr1, a rise of 2.4%. The
intersite variation in this change was considerable,
varying from 15.9% to 11.2%, with a standard deviation
of 5.8%. As in the previous comparison of recorders,
the changes were not statistically significant
even at the sites with the largest changes, which did not
exceed 1.33 times the interannual standard deviation in
annual sunshine duration.
Heliographs, thermometric recorders, photoelectric recorders... What I want to do, is to finally get out of the whole mess with the plethora of different sunshine recording devices, and stick to the modern electronic sensor adjusted to the WMO threshold. That's what I'm working on right now, also for comparison purposes between various stations.
As stated above, the Jordan and the Maring Marvin required much more wattage per square meter than the current WMO standard, yet based on the data from the later 19th and early 20th century, annual sunshine hours in Chicago was 2628 hours Not far from the measurements taken with the Foster equipment which was used after 1953 to the present and compared with the 120 watt e sensors that the WMO has as standard.
According to Wikipedia, they add up to approximately 2,635 hours, annually. I want to see if it's accurate by making my own calculation.
Please register to post and access all features of our very popular forum. It is free and quick. Over $68,000 in prizes has already been given out to active posters on our forum. Additional giveaways are planned.
Detailed information about all U.S. cities, counties, and zip codes on our site: City-data.com.

 Please register to participate in our discussions with 2 million other members - it's free and quick! Some forums can only be seen by registered members. After you create your account, you'll be able to customize options and access all our 15,000 new posts/day with fewer ads.


 [/url]
 [/url]

