Sussex County Home Sale Stats 2016 vs 2015 (Jersey City, Paterson: short sales, real estate, foreclosures)
Please register to participate in our discussions with 2 million other members - it's free and quick! Some forums can only be seen by registered members. After you create your account, you'll be able to customize options and access all our 15,000 new posts/day with fewer ads.
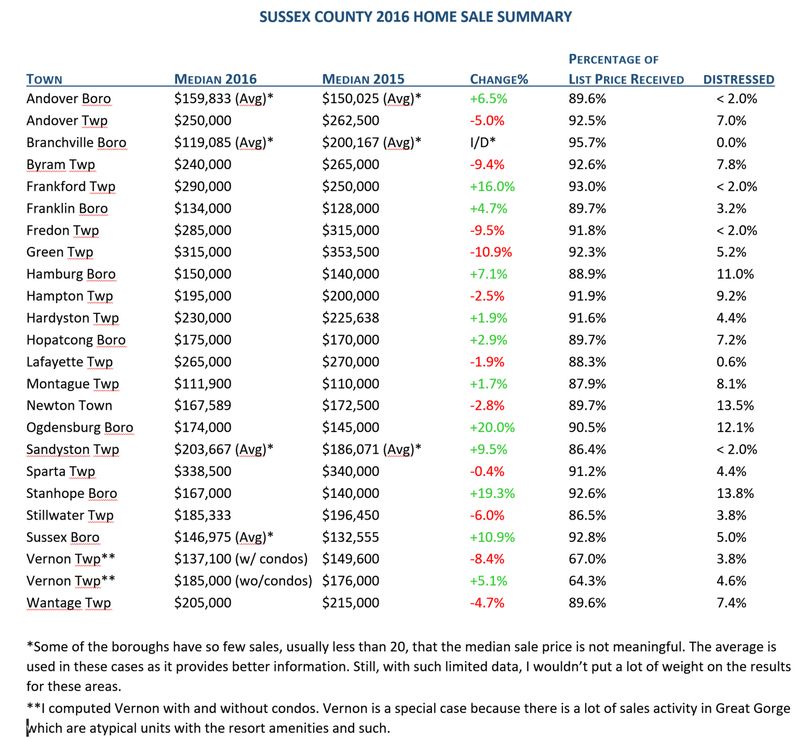
Here are the stats for Sussex County for 2016 compared with 2015. Observations:
1) A couple of the smaller boroughs have so few sales that I used average instead of median. The median was totally meaningless. Average is not much better, but better than nothing. I/D means Insufficient Data, for example if there were only 2 or 3 sales.
2) Ghost town: Walpack. Walpack is an oddball. It has very little private property and almost never has a sale, so it is omitted.
3) Vernon Twp has Great Gorge, and there are sales in that complex that might be considered atypical with the resort amenities attached to living there. So there is seasonality, and some of the units are hotel condos. So I computed Vernon with and without condos. With the condos, the stats are down, but those condos are not selling all that well and are a bit of a drag. If you limit the stats to single family homes, Vernon actually went up a bit.
4) Sussex Borough went up a bit, but with only 20 sales, so not enough data to really conclude that it is a hot area.
5) Sparta is what would happen if aliens extracted a town from Morris County and dropped it around Lake Mohawk.
6) Ogdensburg? The new "it" town?
7) Distressed. What does that column mean? Are the people unhappy or more anxious in the towns with a big number? No. The distressed column shows the percentage of homes that were short sales or foreclosures. I have included that calculation for Sussex County. I thought it would be higher, as post housing crash, many towns have seen that number running in the 20s and 30s. It has dropped throughout northern NJ as the housing market has normalized. So if it is below 10%, then things are returning to normal. Stanhope, Newton, Ogdensburg, and Hamburg had the highest numbers of distressed sales, but even there it was not extreme.
I have to manually derive that stat myself and it is extra work. So I did not include it for Morris and will not include it for Somerset, Bergen, or Passaic (except maybe Paterson). Those areas are healthy and short sales and foreclosures are way down and insignificant at this point. I will include it for Union and Essex and maybe Hudson (at least Jersey City), because those areas still are working off a lot of troubled inventory.
8) Sale-to-list. You can really see a difference between Morris and Sussex Counties here. In Morris, this number is closer to 95%, while in Sussex it is running upper 80%s. Exurban areas are definitely a harder sell these days. And I don't think the damnable gasoline tax is going to help, as that inflates commuting expenses disproportionately in the exurbs. Thanks Gov Christie for upping the only low tax we had to offset the confiscatory taxes we face in every other arena.
I just read an article about foreclosures in the state. Looks like Sussex is the third highest for foreclosure rates in the state. Only Atlantic and Camden county have higher rates. N.J. leads nation in foreclosures (again) in 2016 | NJ.com
As far as Frankford is concerned, houses are being flipped on culver lake, and sold to rich city people. Amazing what they are going for. The rest of the township is hurting.!
You bring up a good point chuck172. If I had to guess Culver Lake is skewing the numbers for the township. I can't believe what some of the properties are going for on the lake. I saw one real estate transaction last year where the owner paid between 400K and 450K (I don't remember the exact number), and tore the house down and built a big new house in it's place. I'm over in Sandyston and was surprised to see our number go up. I believe it is all because of one house that sold at the end of last year. I think it sold for 360K. I check listings up here every week and nothing seems to sell unless you're willing to give it away. If I had to guess I would think our number would have stayed the same or dropped. Marc Paolella if I wanted to drill down on my township where could I go to easily find this info?
You bring up a good point chuck172. If I had to guess Culver Lake is skewing the numbers for the township. I can't believe what some of the properties are going for on the lake. I saw one real estate transaction last year where the owner paid between 400K and 450K (I don't remember the exact number), and tore the house down and built a big new house in it's place. I'm over in Sandyston and was surprised to see our number go up. I believe it is all because of one house that sold at the end of last year. I think it sold for 360K. I check listings up here every week and nothing seems to sell unless you're willing to give it away. If I had to guess I would think our number would have stayed the same or dropped. Marc Paolella if I wanted to drill down on my township where could I go to easily find this info?
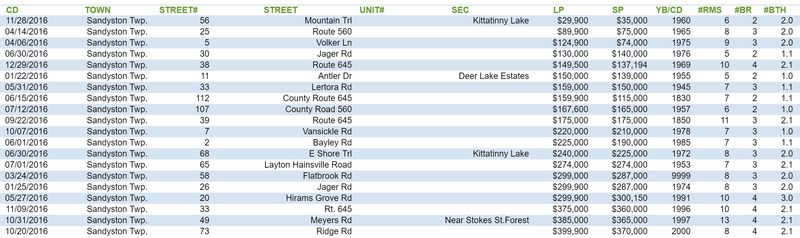
Sandyston doesn't really have a good sample size, usually less than 30 sales per year. But here are the sales from 2016.
CD=Closed date
YB=Year built
LP=List Price
SP=Sale Price
SEC=Neighborhood (most agents don't fill out this field, and some neighborhoods don't have a name)
I had a realtor inspect and appraise my house and property here in Frankford. They came out with what I thought was a real low figure. After lots of BS'ing on their part I finally got them to admit that the market here really Sucks and now is not a good time to sell.
Thanks for the report. I would have though there would be more appreciation as taxes and prices in more suburban/ urban areas and improved roads for commuting would have pushed more buyers North and West.
Thank you Marc Paolella for adding in the sales info for Sandyston. I didn't realize all the other sales that took place.
Please register to post and access all features of our very popular forum. It is free and quick. Over $68,000 in prizes has already been given out to active posters on our forum. Additional giveaways are planned.
Detailed information about all U.S. cities, counties, and zip codes on our site: City-data.com.

 Please register to participate in our discussions with 2 million other members - it's free and quick! Some forums can only be seen by registered members. After you create your account, you'll be able to customize options and access all our 15,000 new posts/day with fewer ads.