Walpole: Fire Incidents, Massachusetts (MA)
Where are fire incidents reported in Walpole, MA
Something went wrong! Please refresh the page.
| Fire incidents reported | |
|---|---|
| Sreet name | Count |
| MAIN ST | 628 |
| ROUTE 1 | 264 |
| WASHINGTON ST | 106 |
| RAINBOW POND DR | 92 |
| EAST ST | 82 |
| NORTH ST | 72 |
| ROUTE 95 | 66 |
| COMMON ST | 62 |
| LINCOLN RD | 62 |
| SOUTH ST | 60 |
| WEST ST | 52 |
| NEPONSET VIEW TER | 48 |
| CONEY ST | 42 |
| SCHOOL ST | 40 |
| STONE ST | 36 |
| HIGH PLAIN ST | 34 |
| FISHER ST | 28 |
| HIGH ST | 28 |
| HILLTOP DR | 26 |
| ROBBINS RD | 26 |
| SHERWOOD DR | 26 |
| 95 | 24 |
| ELM ST | 24 |
| NORTON AVE | 24 |
| PEMBERTON ST | 24 |
| NORFOLK ST | 20 |
| OLD POST RD | 20 |
| WALPOLE PARK SOUTH | 18 |
| DIAMOND POND TER | 16 |
| PEACH ST | 16 |
2002 - 2018 National Fire Incident Reporting System (NFIRS) incidents
- Incident types reported to NFIRS in Walpole, MA
- 10,09254.7%Rescue & EMS
- 2,61514.2%Hazardous Condition
- 1,84210.0%False Alarm
- 1,6168.8%Fire
- 1,2827.0%Service Call
- 9455.1%Good Intent Call
- 220.1%Severe Weather
- Fire incident types reported to NFIRS in Walpole, MA
- 94358.4%Structure Fires
- 50231.1%Outside Fires
- 1428.8%Mobile Property/Vehicle Fires
- 291.8%Other
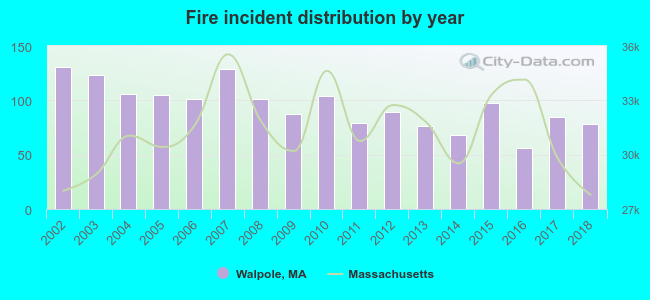 Based on the data from the years 2002 - 2018 the average number of fire incidents per year is 95. The highest number of reported fire incidents - 131 took place in 2002, and the least - 56 in 2016. The data has a declining trend.
The average number of yearly fire incidents per 10k residents in Walpole, MA compared to nearest cities:
(Note: Based on data for the last 3 years, including only cities with population 5,000 and above)
| Walpole: | 123.4 |
| Sharon: | 86.6 |
| Norwood: | 40.4 |
| Medfield: | 29.8 |
| Norfolk: | 60.0 |
| Foxborough: | 96.0 |
| Westwood: | 92.1 |
| Millis: | 6.3 |
| Canton: | 29.2 |
 The median response time based on all reported fire incidents is 3 minutes. This is lower compared to the Massachusetts median value.
The median response time in Walpole, MA compared to nearest cities:
(Note: Based on data for all years, including only cities with at least 500 fire incidents)
| Walpole: | 3 minutes |
| Sharon: | 5 minutes |
| Norwood: | 4 minutes |
| Norfolk: | 3 minutes |
| Foxborough: | 5 minutes |
| Westwood: | 5 minutes |
| Canton: | 5 minutes |
| Stoughton: | 3 minutes |
| Wrentham: | 2 minutes |
 Based on the data from the years 2002 - 2018 the average number of fire-related casualties per year is 1. The highest number of casualties - 9 took place in 2004, and the lowest - 0 in 2005. The data has a decreasing trend.
The average number of casualties per 1,000 fires is 12. This indicator was the highest - 85 in 2004, and the lowest 0 in 2005. The trend for injuries per 1,000 fire incidents is dropping. Compared to the state value the number of injuries per 1,000 incidents is about the same.
Based on the data from the years 2002 - 2018 the average number of fire-related casualties per year is 1. The highest number of casualties - 9 took place in 2004, and the lowest - 0 in 2005. The data has a decreasing trend.
The average number of casualties per 1,000 fires is 12. This indicator was the highest - 85 in 2004, and the lowest 0 in 2005. The trend for injuries per 1,000 fire incidents is dropping. Compared to the state value the number of injuries per 1,000 incidents is about the same.
 31.2% incidents where reported in the morning and 68.8% in the evening. The most fires (16.0%) took place on Sunday, and the least (12.4%) on Saturday.
 According to the 1,616 fire incident reports from years 2002 - 2018 most fires (11.8%) took place during April, and the least (6.9%) in October.
 Out of all 18,442 cases reported during the years 2002 - 2018, the most belonged to the categories: Rescue & EMS (54.7%), Hazardous Condition (14.2%), and False Alarm (10.0%).
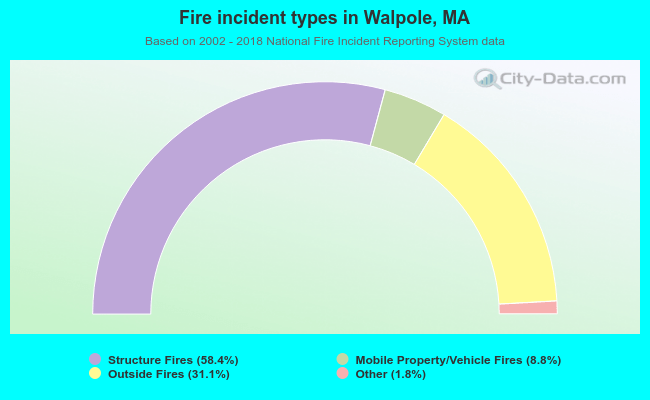 When looking into fire subcategories, the most incidents belonged to: Structure Fires (58.4%), and Outside Fires (31.1%).