Medfield: Fire Incidents, Massachusetts (MA)
Where are fire incidents reported in Medfield, MA
Something went wrong! Please refresh the page.
|
| |||||||||||||||||||||||||||||||||||||||||||||||||||||||||||||||||||||||||||||||||||||||||||||||||||||||||||||
2002 - 2018 National Fire Incident Reporting System (NFIRS) incidents
- Incident types reported to NFIRS in Medfield, MA
- 2,88440.9%Rescue & EMS
- 1,67723.8%Hazardous Condition
- 86912.3%Service Call
- 76210.8%False Alarm
- 4987.1%Fire
- 2884.1%Good Intent Call
- 380.5%Severe Weather
- 260.4%Special Incident
- Fire incident types reported to NFIRS in Medfield, MA
- 22745.6%Structure Fires
- 21242.6%Outside Fires
- 336.6%Mobile Property/Vehicle Fires
- 265.2%Other
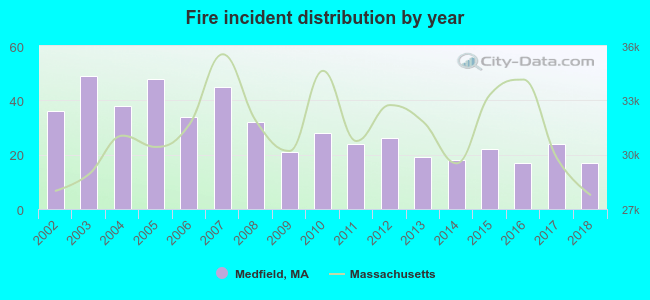 According to the data from the years 2002 - 2018 the average number of fires per year is 29. The highest number of reported fires - 49 took place in 2003, and the least - 17 in 2016. The data has a decreasing trend.
The average number of yearly fire incidents per 10k residents in Medfield, MA compared to nearest cities:
(Note: Based on data for the last 3 years, including only cities with population 5,000 and above)
| Medfield: | 29.8 |
| Millis: | 6.3 |
| Walpole: | 123.4 |
| Norwood: | 40.4 |
| Norfolk: | 60.0 |
| Westwood: | 92.1 |
| Medway: | 42.1 |
| Holliston: | 5.2 |
| Natick: | 25.0 |
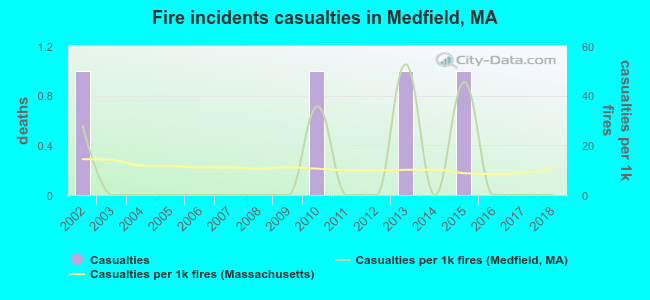 Based on the reports from the years 2002 - 2018 the average number of fire-related yearly casualties is 0. The highest number of reported casualties - 1 took place in 2002, and the lowest - 0 in 2003. The data has a dropping trend.
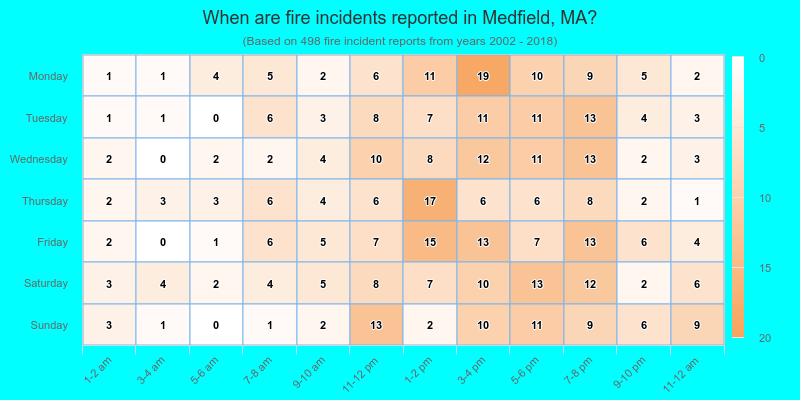
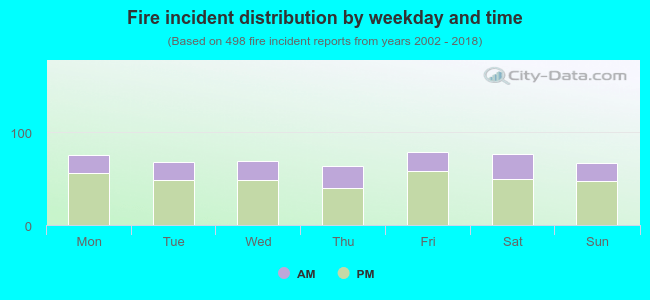 29.9% incidents where reported in the morning and 70.1% in the evening. The most fires (15.9%) took place on Friday, and the least (12.9%) on Thursday.
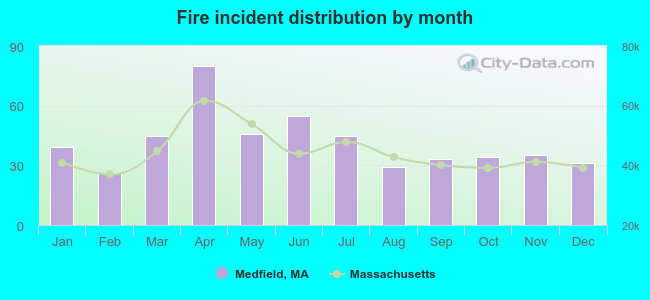 According to the 498 incident reports from years 2002 - 2018 most fires (16.1%) took place during April, and the least (5.2%) in February.
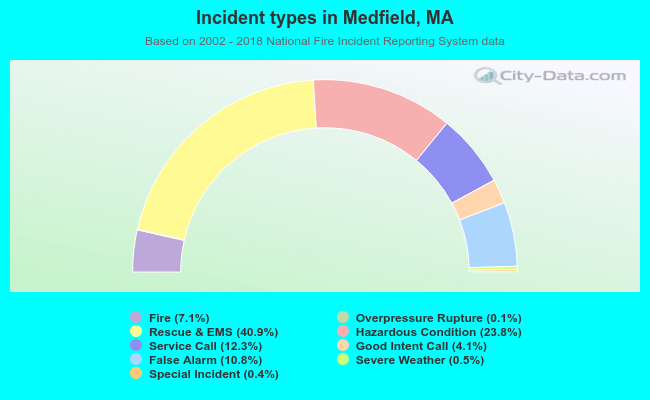 Out of all 7,048 cases reported during the years 2002 - 2018, the most belonged to the categories: Rescue & EMS (40.9%), Hazardous Condition (23.8%), and Service Call (12.3%).
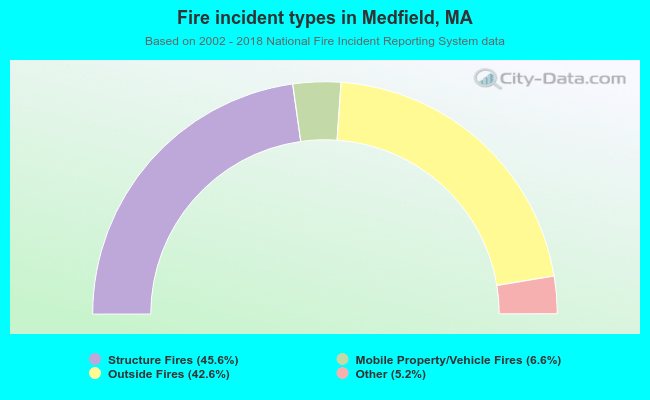 When looking into fire subcategories, the most reports belonged to: Structure Fires (45.6%), and Outside Fires (42.6%).