Walnut: Fire Incidents, California (CA)
Where are fire incidents reported in Walnut, CA
Something went wrong! Please refresh the page.
|
| |||||||||||||||||||||||||||||||||||||||||||||||||||||||||||||||||||||||||||||||||||||||||||||||||||||||||||||
2005 - 2018 National Fire Incident Reporting System (NFIRS) incidents
- Incident types reported to NFIRS in Walnut, CA
- 3,71364.4%Rescue & EMS
- 1,08818.9%Good Intent Call
- 4067.0%False Alarm
- 2263.9%Fire
- 1933.3%Service Call
- 1252.2%Hazardous Condition
- 80.1%Special Incident
- Fire incident types reported to NFIRS in Walnut, CA
- 9240.7%Outside Fires
- 6729.6%Structure Fires
- 5323.5%Mobile Property/Vehicle Fires
- 146.2%Other
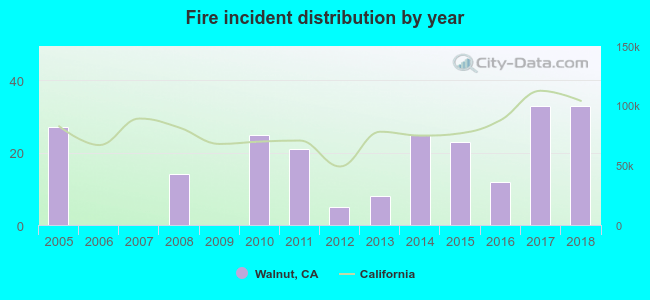 According to the data from the years 2005 - 2018 the average number of fires per year is 16. The highest number of fires - 33 took place in 2017, and the least - 0 in 2006. The data has a growing trend.
The average number of yearly fire incidents per 10k residents in Walnut, CA compared to nearest cities:
(Note: Based on data for the last 3 years, including only cities with population 5,000 and above)
| Walnut: | 8.6 |
| Diamond Bar: | 9.5 |
| Rowland Heights: | 6.5 |
| West Covina: | 5.2 |
| Valinda: | 10.2 |
| Covina: | 12.7 |
| Charter Oak: | 6.4 |
| La Puente: | 8.3 |
| San Dimas: | 14.6 |

 29.6% incidents where reported in the morning and 70.4% in the evening. The most fires (18.6%) took place on Thursday, and the least (10.6%) on Tuesday.
 According to the 226 fire incident reports from years 2005 - 2018 most fires (12.8%) took place during October, and the least (5.3%) in February.
 Out of all 5,762 cases reported during the years 2005 - 2018, the most belonged to the categories: Rescue & EMS (64.4%), Good Intent Call (18.9%), and False Alarm (7.0%).
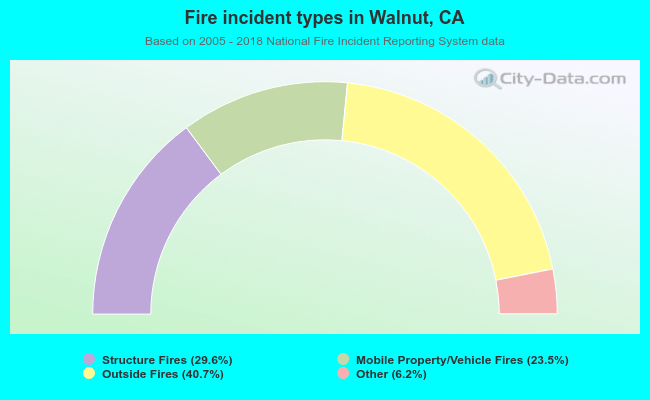 When looking into fire subcategories, the most reports belonged to: Outside Fires (40.7%), and Structure Fires (29.6%).