La Puente: Fire Incidents, California (CA)
Where are fire incidents reported in La Puente, CA
Something went wrong! Please refresh the page.
|
| |||||||||||||||||||||||||||||||||||||||||||||||||||||||||||||||||||||||||||||||||||||||||||||||||||||||||||||
2005 - 2018 National Fire Incident Reporting System (NFIRS) incidents
- Incident types reported to NFIRS in La Puente, CA
- 7,74871.0%Rescue & EMS
- 1,88517.3%Good Intent Call
- 4293.9%False Alarm
- 3683.4%Fire
- 2552.3%Hazardous Condition
- 2071.9%Service Call
- 120.1%Special Incident
- Fire incident types reported to NFIRS in La Puente, CA
- 14038.0%Outside Fires
- 13436.4%Structure Fires
- 7720.9%Mobile Property/Vehicle Fires
- 174.6%Other
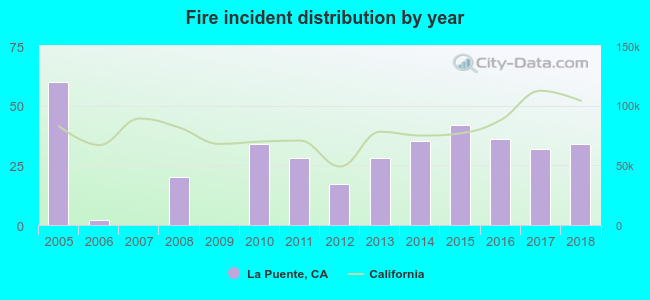 Based on the data from the years 2005 - 2018 the average number of fire incidents per year is 26. The highest number of fires - 60 took place in 2005, and the least - 0 in 2007. The data has a dropping trend.
The average number of yearly fire incidents per 10k residents in La Puente, CA compared to nearest cities:
(Note: Based on data for the last 3 years, including only cities with population 5,000 and above)
| La Puente: | 8.3 |
| Valinda: | 10.2 |
| Hacienda Heights: | 11.5 |
| West Covina: | 5.2 |
| Baldwin Park: | 8.9 |
| La Habra Heights: | 18.9 |
| El Monte: | 14.1 |
| Rowland Heights: | 6.5 |
| Walnut: | 8.6 |

 31.5% incidents where reported in the morning and 68.5% in the evening. The most fires (17.9%) took place on Sunday, and the least (10.9%) on Saturday.
 Based on the 368 fire incidents from years 2005 - 2018 most fires (13.0%) took place during July, and the least (5.7%) in February.
 Out of all 10,906 cases reported during the years 2005 - 2018, the most belonged to the categories: Rescue & EMS (71.0%), Good Intent Call (17.3%), and False Alarm (3.9%).
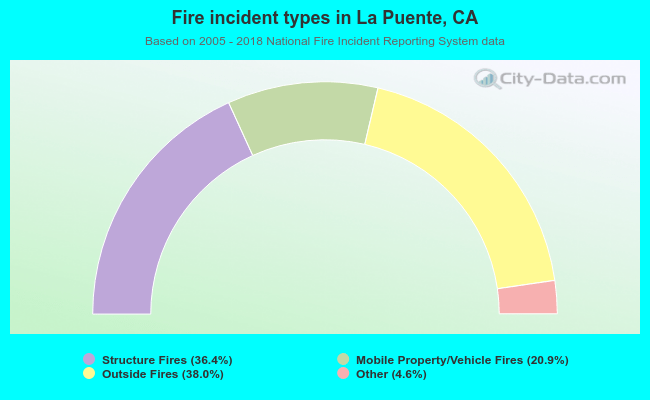 When looking into fire subcategories, the most incidents belonged to: Outside Fires (38.0%), and Structure Fires (36.4%).