Thornton: Fire Incidents, New Hampshire (NH)
Where are fire incidents reported in Thornton, NH
Something went wrong! Please refresh the page.
|
| |||||||||||||||||||||||||||||||||||||||||||||||||||||||||||||||||||||||||||||||||||||||||||||||||||||||||||||
2002 - 2018 National Fire Incident Reporting System (NFIRS) incidents
- Incident types reported to NFIRS in Thornton, NH
- 89546.0%Rescue & EMS
- 37119.1%Fire
- 24112.4%Hazardous Condition
- 1779.1%Service Call
- 1568.0%Good Intent Call
- 854.4%False Alarm
- 100.5%Special Incident
- 70.4%Severe Weather
- 20.1%Overpressure Rupture
- Fire incident types reported to NFIRS in Thornton, NH
- 17547.2%Structure Fires
- 10127.2%Other
- 6918.6%Outside Fires
- 267.0%Mobile Property/Vehicle Fires
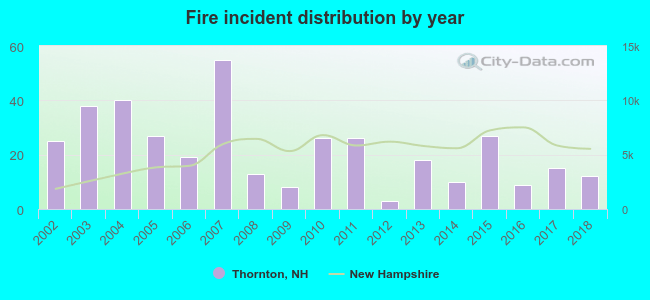 Based on the data from the years 2002 - 2018 the average number of fires per year is 22. The highest number of fire incidents - 55 took place in 2007, and the least - 3 in 2012. The data has a decreasing trend.
 29.9% incidents where reported in the morning and 70.1% in the evening. The most fires (19.1%) took place on Friday, and the least (11.9%) on Saturday.
 According to the 371 reports from years 2002 - 2018 most fires (16.4%) took place during January, and the least (3.5%) in October.
 Out of all 1,944 cases reported during the years 2002 - 2018, the most belonged to the categories: Rescue & EMS (46.0%), Fire (19.1%), and Hazardous Condition (12.4%).
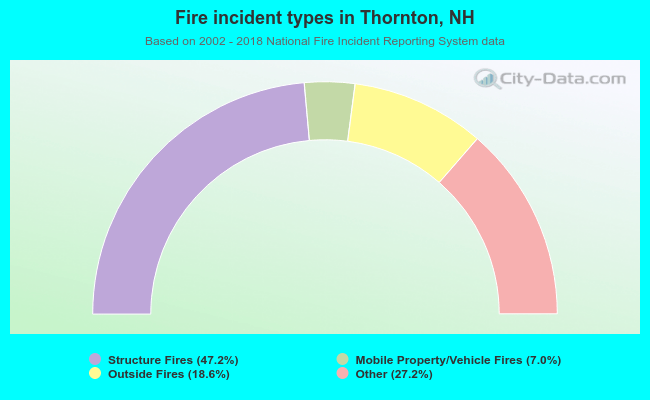 When looking into fire subcategories, the most incidents belonged to: Structure Fires (47.2%), and Other (27.2%).