| Fire incidents reported |
|---|
| Sreet name | Count |
|---|
| TEAYS VALLEY | 6 | | 1100 LIBERTY SQUARE | 4 | | 250 HICKORY RD | 4 | | ASST TEAYS VALLEY | 4 | | JOYCE RD | 4 | | JOYCE RD | 4 | | NORTH POPLAR FORK ROAD RD | 4 | | POPLAR DRIVE DR | 4 | | ROUTE 34 | 4 | | RT 34 TEAYS VALLEY | 4 | | SABLE POINT DR | 4 | | TEAYS VALLEY RD | 4 | | VENTROUX RD | 4 | | # 9 SABLE POINT MNR | 2 | | 1017 NEW LONDON COMMONS | 2 | | 1028 MARINA DR | 2 | | 104 LAUREL LN | 2 | | 112 DEER VALLEY DRIVE | 2 | | 1400 HASPITAL DRIVE CAMC | 2 | | 17 GRANADA CIRCLE | 2 | | 2092 MT VERNON RD | 2 | | 300 BLK MARIGOLD LANE | 2 | | 303 MAURY | 2 | | 308 PLANTATION DR | 2 | | 315 WOODBERRY WAY | 2 |
| | | Fire incidents reported |
|---|
| Sreet name | Count |
|---|
| 3500 BLK TEAYS VALLEY ROAD | 2 | | 3701 TEAYS VALLEY RD | 2 | | 4218 TEAYS VALLEY RD | 2 | | 4823 B TEAYS VALLEY RD | 2 | | 500B PRESTIGE PARK | 2 | | 51 MARINA PARK | 2 | | 7105 TEAYS VALLEY RD | 2 | | 8 MARINA PARK | 2 | | BEECHWOOD ESTATES MNR | 2 | | BENT TREE EST | 2 | | BILLS CREEK ROAD RD | 2 | | BURN RD | 2 | | CEDAR DR | 2 | | CHURCH CAMP RD | 2 | | CHURCH CAMP RD | 2 | | CROOKED CREEK RD | 2 | | DEER VALLEY DR | 2 | | DEER VALLEY DR | 2 | | GREAT TEAY BLVD | 2 | | GREAT TEAYS BLVD | 2 | | GREAT TEAYS BOULEVARD | 2 | | GREENBRIER AVE | 2 | | HIGHLAND DR | 2 | | I 64 EB | 2 | | |
|
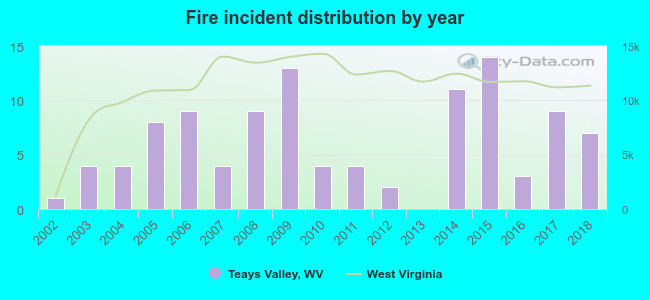 According to the data from the years 2002 - 2018 the average number of fire incidents per year is 6. The highest number of reported fires - 14 took place in 2015, and the least - 0 in 2013. The data has an increasing trend.
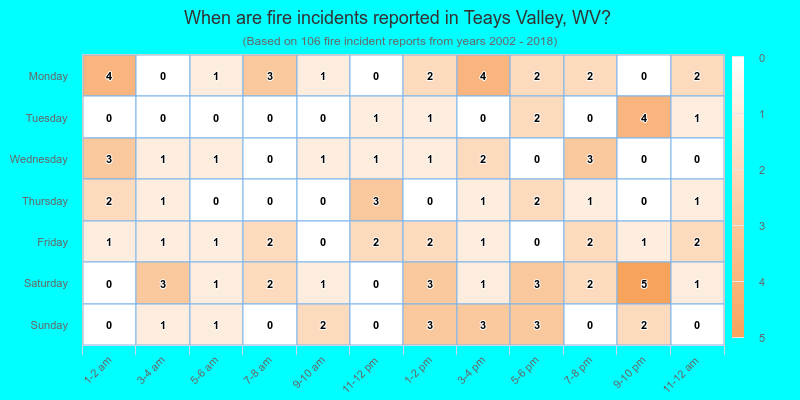
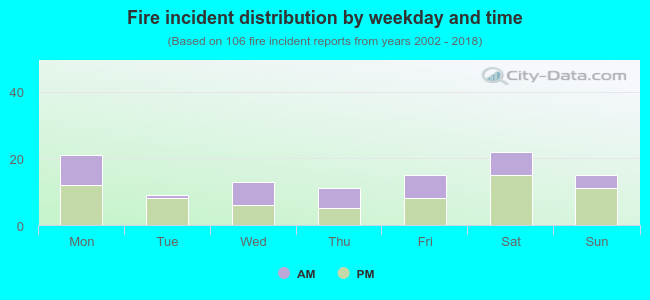 38.7% incidents where reported in the morning and 61.3% in the evening. The most fires (20.8%) took place on Saturday, and the least (8.5%) on Tuesday.
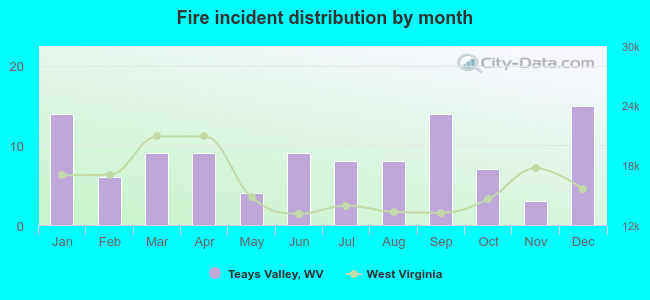 Based on the 106 fires from years 2002 - 2018 most fires (14.2%) took place during December, and the least (2.8%) in November.
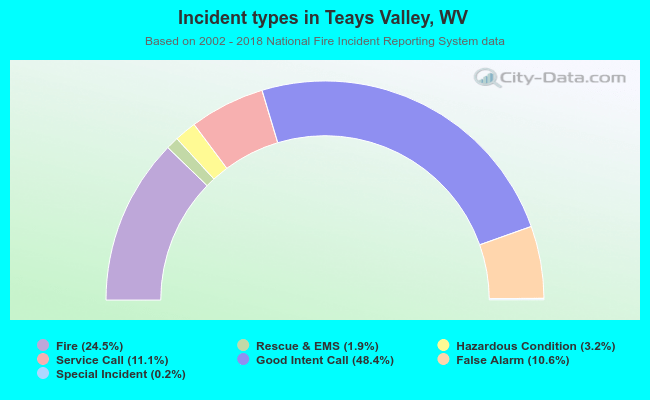 Out of all 432 cases reported during the years 2002 - 2018, the most belonged to the categories: Service Call (48.4%), Fire (24.5%), and Hazardous Condition (11.1%).
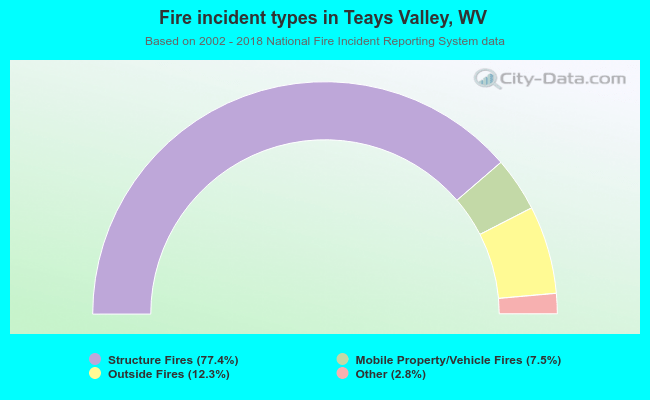 When looking into fire subcategories, the most incidents belonged to: Structure Fires (77.4%), and Outside Fires (12.3%).