Charleston: Fire Incidents, West Virginia (WV)
Where are fire incidents reported in Charleston, WV
Something went wrong! Please refresh the page.
| Fire incidents reported | |
|---|---|
| Sreet name | Count |
| KANAWHA BLVD | 1,950 |
| WASHINGTON ST | 1,464 |
| MACCORKLE AVE | 1,328 |
| RANDOLPH ST | 1,044 |
| CENTRAL AVE | 1,032 |
| LEE ST | 508 |
| RENAISSANCE CIR | 454 |
| JACOB ST | 288 |
| QUARRIER ST | 220 |
| VIRGINIA ST | 182 |
| SISSONVILLE DR | 154 |
| 7TH AVE | 140 |
| RED OAK ST | 98 |
| BRAWLEY WALK | 92 |
| MORRIS ST | 90 |
| PENNSYLVANIA AVE | 90 |
| CAPITOL ST | 82 |
| INTERSTATE 77 | 82 |
| CHANDLER DR | 80 |
| RHL BLVD | 80 |
| RUFFNER AVE | 76 |
| GARRISON AVE | 74 |
| LEON SULLIVAN WAY | 72 |
| SMITH ST | 72 |
| GREENBRIER ST | 70 |
| WALKER DR | 70 |
| GRANT ST | 68 |
| OAKWOOD RD | 68 |
| CLENDENIN ST | 64 |
| VENABLE AVE | 64 |
| Other | 249 |
2004 - 2018 National Fire Incident Reporting System (NFIRS) incidents
- Incident types reported to NFIRS in Charleston, WV
- 17,75835.4%Rescue & EMS
- 10,40520.7%Fire
- 7,14714.2%Good Intent Call
- 5,52511.0%Hazardous Condition
- 4,7579.5%False Alarm
- 4,3598.7%Service Call
- 1390.3%Special Incident
- 940.2%Overpressure Rupture
- Fire incident types reported to NFIRS in Charleston, WV
- 6,73864.8%Structure Fires
- 2,41223.2%Outside Fires
- 8938.6%Mobile Property/Vehicle Fires
- 3623.5%Other
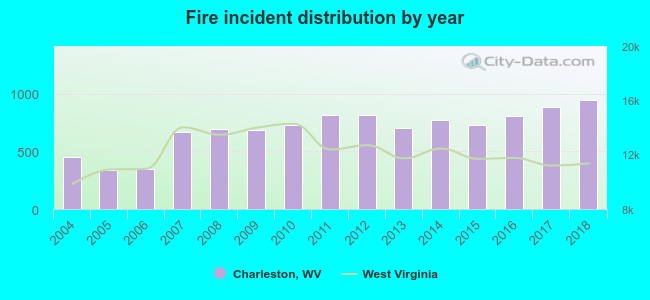 According to the data from the years 2004 - 2018 the average number of fires per year is 693. The highest number of reported fires - 944 took place in 2018, and the least - 341 in 2005. The data has a rising trend.
The average number of yearly fire incidents per 10k residents in Charleston, WV compared to nearest cities:
(Note: Based on data for the last 3 years, including only cities with population 5,000 and above)
| Charleston: | 174.3 |
| South Charleston: | 38.8 |
| Dunbar: | 32.3 |
| Cross Lanes: | 64.7 |
| Nitro: | 89.7 |
| Teays Valley: | 4.8 |
| Hurricane: | 93.8 |
| Oak Hill: | 54.6 |
 The median response time based on all reported fire incidents is 6 minutes. This is lower than the state median value.
The median response time in Charleston, WV compared to nearest cities:
(Note: Based on data for all years, including only cities with at least 500 fire incidents)
| Charleston: | 6 minutes |
| South Charleston: | 5 minutes |
| Cross Lanes: | 10 minutes |
| Elkview: | 15 minutes |
| St. Albans: | 7 minutes |
| Sissonville: | 15 minutes |
| Nitro: | 5 minutes |
| Poca: | 10 minutes |
| Clendenin: | 15 minutes |
 According to the data from the years 2004 - 2018 the average number of fire-related yearly deaths is 2. The highest number of deaths - 10 took place in 2012, and the lowest - 0 in 2005. The data has a rising trend.
The average number of fatalities per 1,000 fire incidents is 2. This indicator was the highest - 12 in 2012, and the lowest 0 in 2005. The trend for deaths per 1,000 incidents is decreasing. Compared to the West Virginia value the number of deaths per 1,000 fire incidents is lower.
According to the data from the years 2004 - 2018 the average number of fire-related yearly deaths is 2. The highest number of deaths - 10 took place in 2012, and the lowest - 0 in 2005. The data has a rising trend.
The average number of fatalities per 1,000 fire incidents is 2. This indicator was the highest - 12 in 2012, and the lowest 0 in 2005. The trend for deaths per 1,000 incidents is decreasing. Compared to the West Virginia value the number of deaths per 1,000 fire incidents is lower.Deaths per 1,000 incidents in Charleston, WV compared to nearest cities:
(Note: Based on data for all years, including only cities with at least 2,500 fire incidents)
| Charleston: | 2.5 |
 According to the reports from the years 2004 - 2018 the average number of fire-related casualties per year is 4. The highest number of reported casualties - 9 took place in 2006, and the lowest - 0 in 2015. The data has a decreasing trend.
The average number of casualties per 1,000 fires is 6. This indicator was the highest - 26 in 2006, and the lowest 0 in 2015. The trend for injuries per 1,000 fires is declining. Compared to the state value the number of injuries per 1,000 fires is lower.
According to the reports from the years 2004 - 2018 the average number of fire-related casualties per year is 4. The highest number of reported casualties - 9 took place in 2006, and the lowest - 0 in 2015. The data has a decreasing trend.
The average number of casualties per 1,000 fires is 6. This indicator was the highest - 26 in 2006, and the lowest 0 in 2015. The trend for injuries per 1,000 fires is declining. Compared to the state value the number of injuries per 1,000 fires is lower.Casualties per 1,000 incidents in Charleston, WV compared to nearest cities:
(Note: Based on data for all years, including only cities with at least 500 fire incidents)
| Charleston: | 5.2 |
| South Charleston: | 7.7 |
| Cross Lanes: | 11.8 |
| Elkview: | 1.6 |
| St. Albans: | 6.7 |
| Sissonville: | 1.2 |
| Nitro: | 5.8 |
| Poca: | 1.4 |
| Clendenin: | 5.0 |
 34.5% incidents where reported in the morning and 65.5% in the evening. The most fires (15.4%) took place on Saturday, and the least (13.1%) on Thursday.
 Based on the 10,405 fires from years 2004 - 2018 most fires (9.3%) took place during November, and the least (7.5%) in July.
 Out of all 50,209 cases reported during the years 2004 - 2018, the most belonged to the categories: Rescue & EMS (35.4%), Fire (20.7%), and Good Intent Call (14.2%).
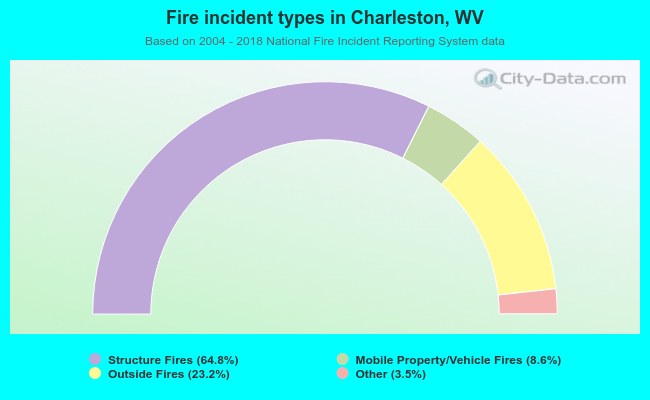 When looking into fire subcategories, the most reports belonged to: Structure Fires (64.8%), and Outside Fires (23.2%).