Red Bank: Fire Incidents, New Jersey (NJ)
Where are fire incidents reported in Red Bank, NJ
Something went wrong! Please refresh the page.
|
| |||||||||||||||||||||||||||||||||||||||||||||||||||||||||||||||||||||||||||||||||||||||||||||||||||||||||||||
2006 - 2018 National Fire Incident Reporting System (NFIRS) incidents
- Incident types reported to NFIRS in Red Bank, NJ
- 1,10940.2%False Alarm
- 79929.0%Hazardous Condition
- 44116.0%Fire
- 1615.8%Service Call
- 1094.0%Good Intent Call
- 843.0%Rescue & EMS
- 471.7%Overpressure Rupture
- 50.2%Special Incident
- 30.1%Severe Weather
- Fire incident types reported to NFIRS in Red Bank, NJ
- 18241.3%Outside Fires
- 16637.6%Structure Fires
- 7015.9%Mobile Property/Vehicle Fires
- 235.2%Other
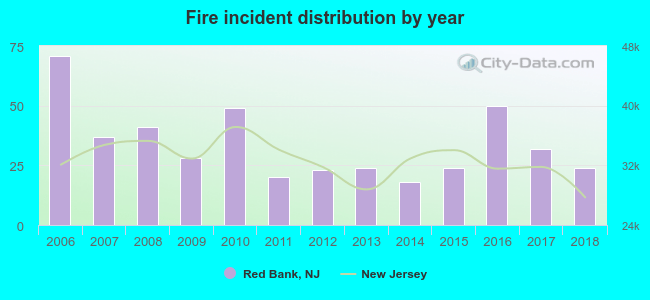 Based on the data from the years 2006 - 2018 the average number of fires per year is 34. The highest number of fire incidents - 71 took place in 2006, and the least - 18 in 2014. The data has a decreasing trend.
The average number of yearly fire incidents per 10k residents in Red Bank, NJ compared to nearest cities:
(Note: Based on data for the last 3 years, including only cities with population 5,000 and above)
| Red Bank: | 28.4 |
| Little Silver: | 11.3 |
| Fair Haven: | 13.2 |
| Lincroft: | 19.6 |
| Oceanport: | 26.3 |
| Eatontown: | 35.6 |
| Rumson: | 33.0 |
| West Long Branch: | 4.2 |
| Tinton Falls: | 47.9 |
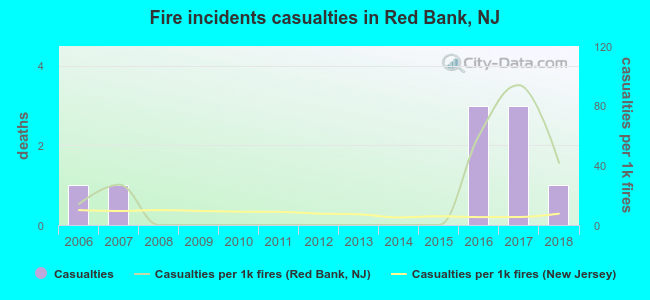 Based on the data from the years 2006 - 2018 the average number of fire-related casualties per year is 1. The highest number of reported injuries - 3 took place in 2016, and the lowest - 0 in 2008. The data has a constant trend.
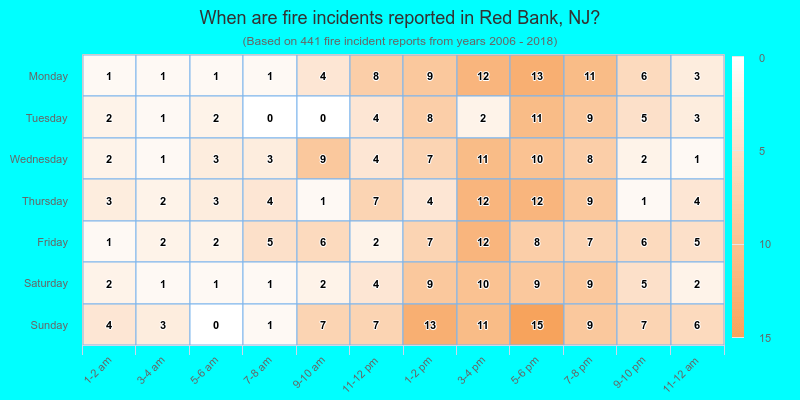
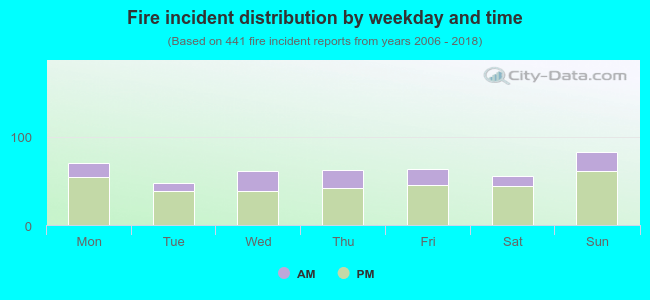 26.8% incidents where reported in the morning and 73.2% in the evening. The most fires (18.8%) took place on Sunday, and the least (10.7%) on Tuesday.
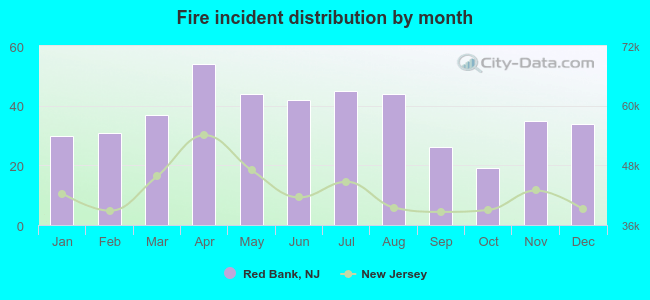 Based on the 441 fire incidents from years 2006 - 2018 most fires (12.2%) took place during April, and the least (4.3%) in October.
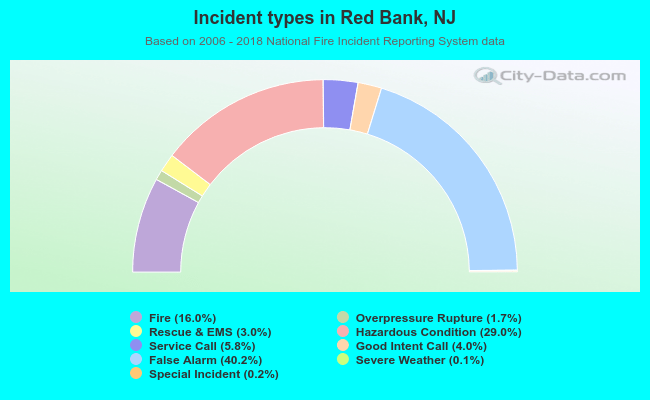 Out of all 2,758 cases reported during the years 2006 - 2018, the most belonged to the categories: False Alarm (40.2%), Hazardous Condition (29.0%), and Fire (16.0%).
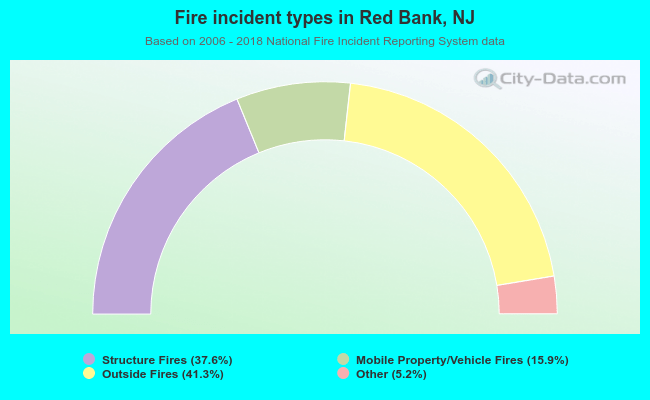 When looking into fire subcategories, the most reports belonged to: Outside Fires (41.3%), and Structure Fires (37.6%).